Mobile reports and market data
Documents
Difficulty Modelling in Mobile Puzzle Games: An Empirical Study on Different Methods to Combine Player Analytics and Simulated Data
The paper, by Jeppe Theiss Kristensen of A.P.
- Models trained on a combination of cohort statistics and simulated data produced the most accurate difficulty estimates across all scenarios, and neural networks were the most consistent among them.
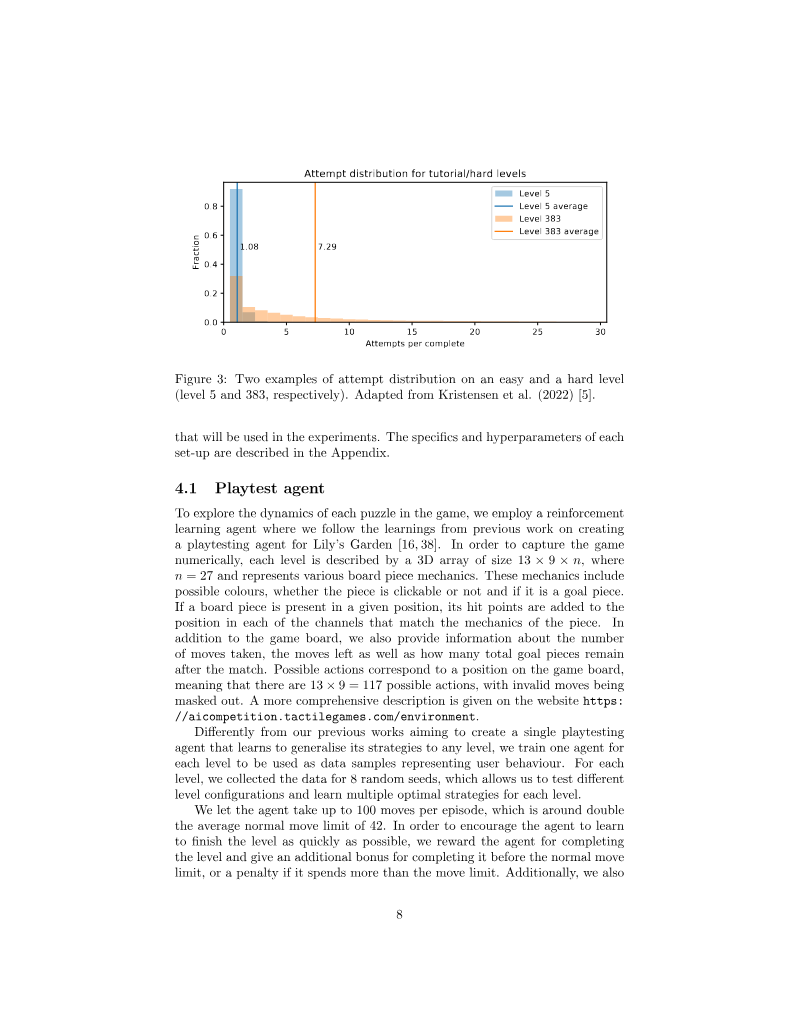
- The study uses average attempts per completion as its difficulty measure, and the difficulty across the first 500 levels stabilises at around 3.2 attempts per complete after the first 100 levels.
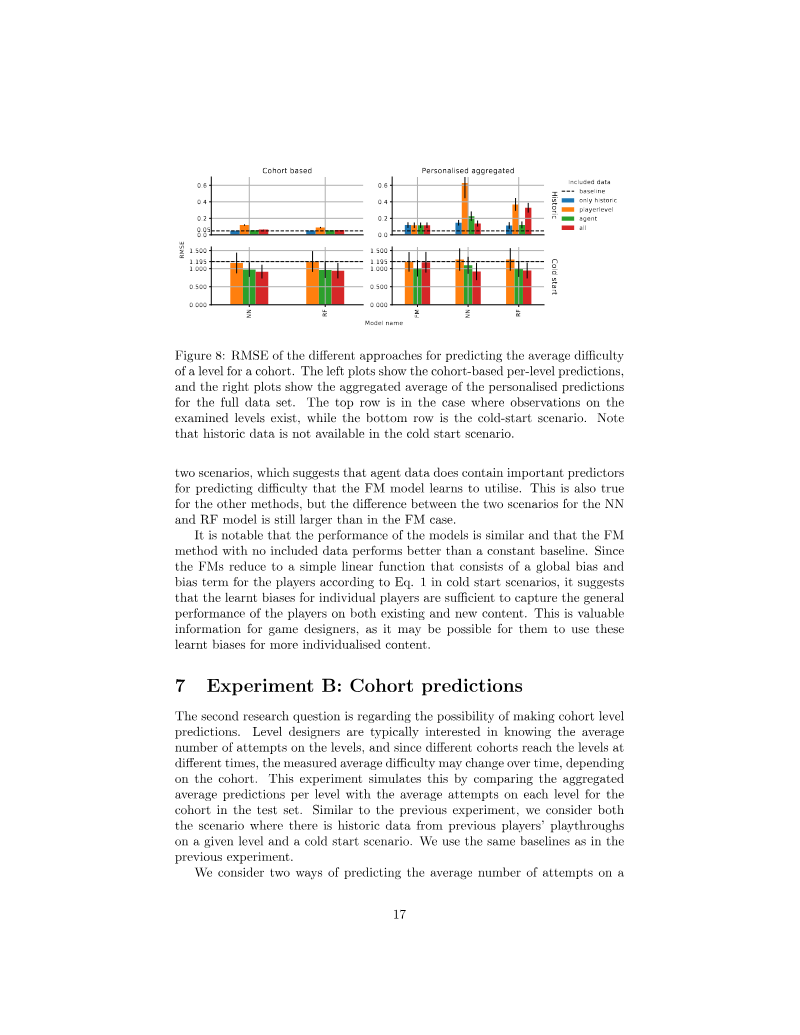
- For personalised predictions on levels with historic data, factorisation machines using player and level data performed best, while the random forest performed worse than all other methods.
Guide to Growing Chinese Gaming Apps Overseas: 2024
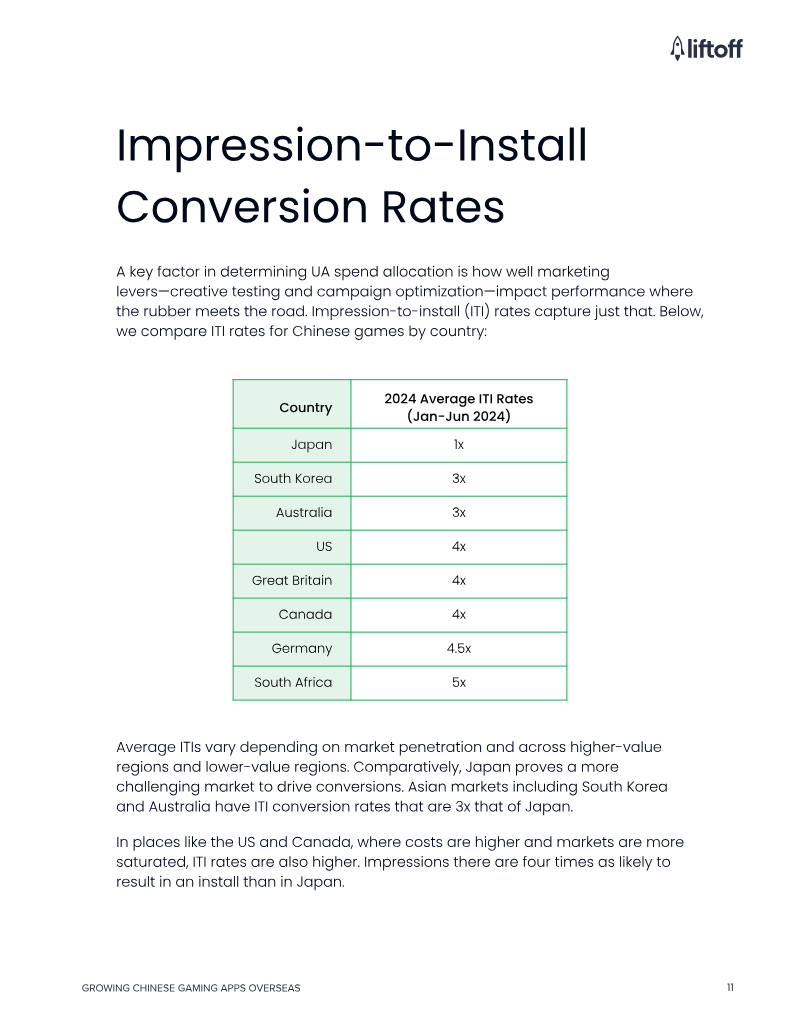
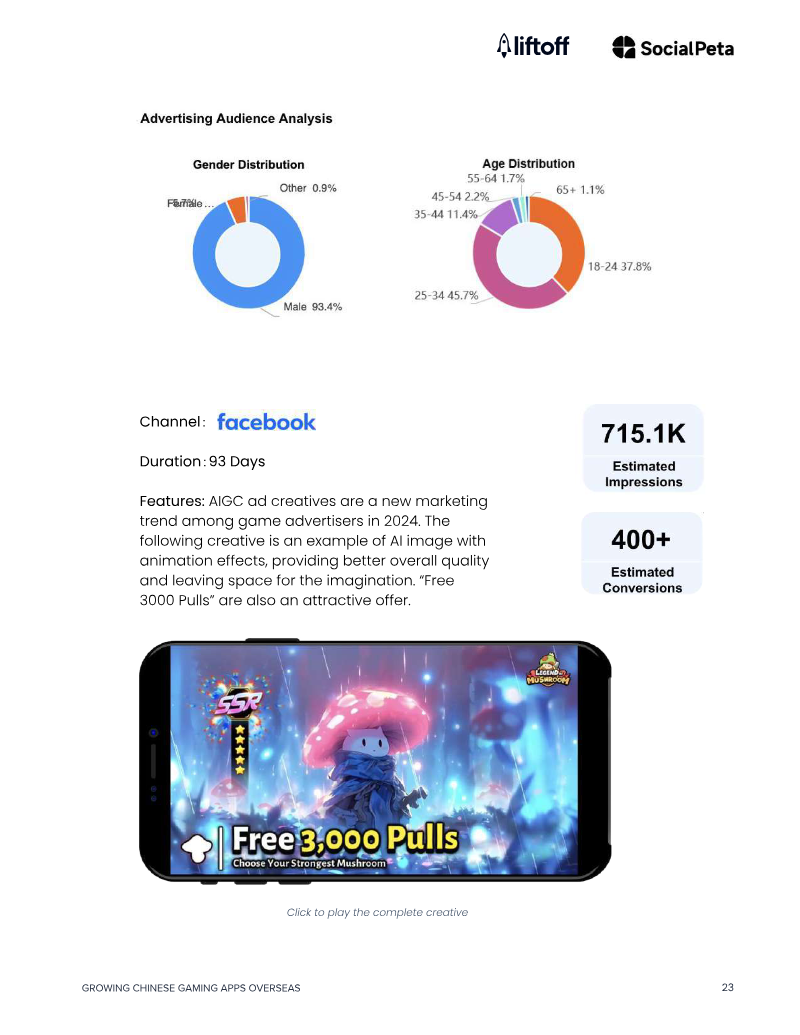
The document is Liftoff's "Guide to Growing Chinese Gaming Apps Overseas: 2024", which uses data from GameRefinery, Accelerate, Liftoff's programmatic advertising solution, and SocialPeta.
- Video ads show the highest average D7 ROAS for Chinese games at about 21%, compared with 10-15% for other formats.
- The US averages $7.68 per install, just under South Korea at $8.02, making these markets among the most costly for Chinese games.
- EMEA has the highest average D7 ROAS of the four regions for Chinese games, at 17.1%.


Liftoff Report: Mobile Ad Creative Index 2024
The Liftoff Mobile Ad Creative Index 2024 analyzes mobile ad creative performance across gaming, e-commerce, finance, and entertainment verticals, based on 602 billion impressions, 49.4 billion clicks, and 144 million installs from January 1, 2023, to January 1, 2024.
- Gaming ads utilizing video or playable formats are over 20 times more likely to drive installs compared to banner ads.
- Native ads represent the most cost-effective acquisition channel, averaging a $1.80 CPI across the analyzed verticals.
- E-commerce apps achieve the highest install-to-action (ITA) rates exceeding 30% through native and banner formats, which also maintain the lowest acquisition costs between $2.57 and $3.23.


Marketing Insights into Global Mobile Games & Minigames in 2024
The document "Marketing Insights into Global Mobile Games & Minigames in 2024" provides an overview of advertising trends and market performance for mobile games and minigames globally, with a specific focus on the Chinese market and international expansion strategies.
- The mobile game advertising market is shifting toward higher creative turnover, with the proportion of advertisers releasing new creatives rising to 55% in the second half of 2024 and new creatives accounting for 65% of total ad volume.
- WeChat minigames have become a significant market force, reaching RMB 60 billion in 2023 with a user base averaging one hour of daily engagement, led primarily by RPG/SLG hybrid titles.
- Casino games saw over 10% year-over-year growth in advertising activity, while casual games experienced a 3% decline, and RPG and puzzle genres maintained stable market positions.


South East Asian Mobile Game Market Insights 2024
This report provides an in-depth analysis of the Southeast Asian mobile game market for the first half of 2024, focusing on App Store and Google Play data.
- Southeast Asia's mobile game market saw 4.2 billion installs in H1 2024, a 3.4% increase, while in-app purchase (IAP) revenue reached $1.16 billion, a 3.4% year-over-year rise but a 3% decline from the previous half-year.
- Indonesia is the region's largest market by volume, accounting for 41% of total downloads with 10% growth, while Thailand leads in profitability, contributing $400 million in IAP revenue.
- Google Play remains the dominant platform in the region, capturing 91% of total download volume and 57% of total IAP revenue.
Mobile Gaming Benchmarks for Q1 2024
This document, "Mobile Gaming Benchmarks for Q1 2024," provides an analysis of key performance indicators for mobile games during the first quarter of 2024.
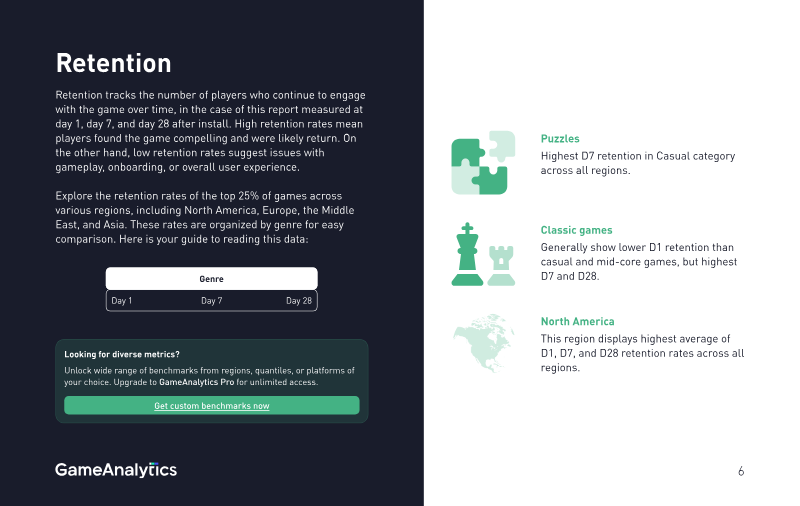
- Global median retention rates for Q1 2024 are 22.91% for day-1, 4.20% for day-7, and 0.85% for day-28.
- Classic genre titles, including board, card, casino, trivia, and word games, consistently outperform casual and mid-core titles in retention metrics across all tracked regions.
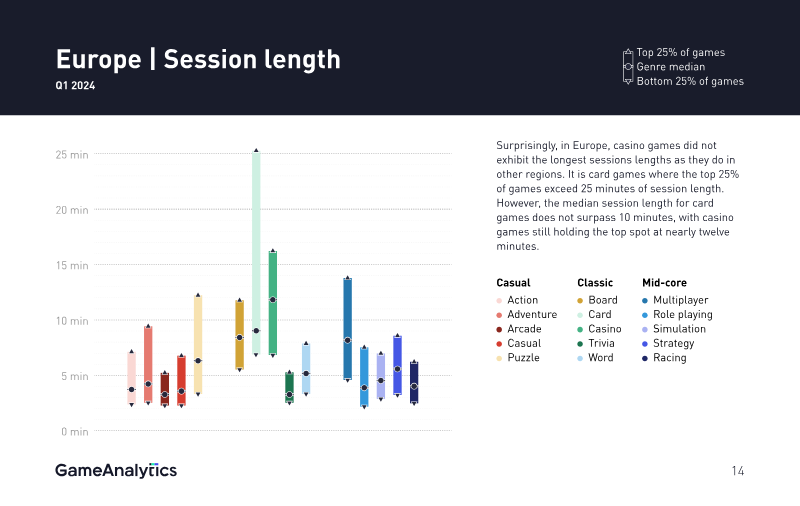
- The global median session length is 4.45 minutes, though casino and card games significantly exceed this, reaching up to 25 minutes in European markets.

Sensor Tower Global Mobile Gaming Industry Outlook 2024
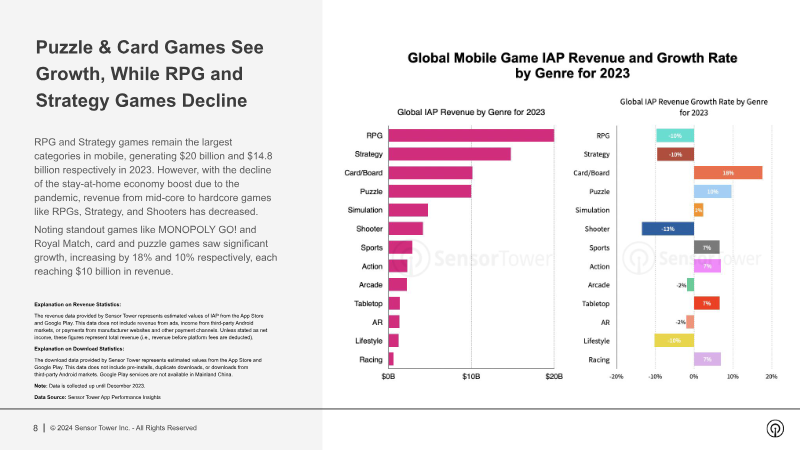
Global in-app purchase revenue from mobile games reached $76.7 billion in 2023 on the App Store and Google Play, a 2% year-on-year decline that was milder than 2022's drop and still 22% above 2019.
- Global mobile gaming revenue reached $76.7 billion in 2023, a 2% year-on-year decline, but is projected to recover to $78 billion in 2024 and exceed $100 billion by 2028.
- Consumer spending is shifting toward casual and hybrid-casual models, with casual revenue growing 8% to $28.6 billion and hybrid-casual revenue surging 30% to over $2.1 billion.
- Traditional high-revenue segments, specifically RPGs and Strategy games, experienced a 10% decline in 2023, though they remain the largest categories at $20 billion and $14.8 billion respectively.
Mobile Growth and Monetization Report 2024
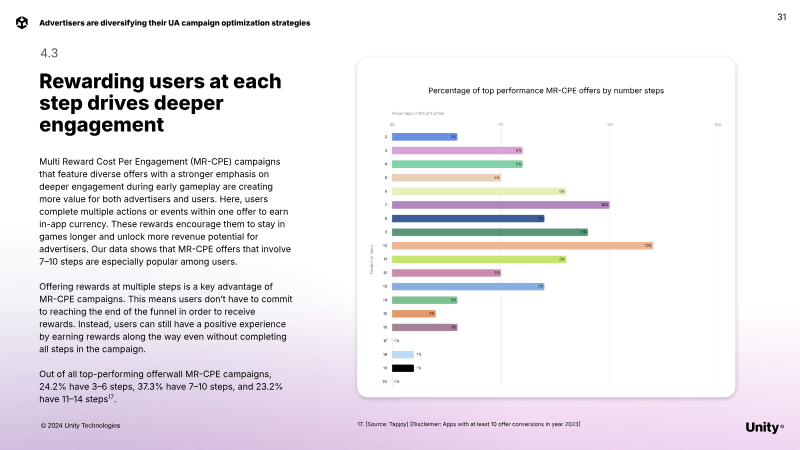
Unity's "Mobile Growth and Monetization Report 2024" presents data on user acquisition (UA), in-app purchases (IAPs), and in-app advertising (IAA) for mobile games.
- Advertisers are diversifying campaign optimization, with ROAS and event-based optimizers taking a larger share of budget year over year while CPI campaigns remain in the mix.
- 1.83% of users convert on IAP during their lifetime, and 28.81% of those converters make at least one additional purchase, so about one in three IAP purchasers repurchase.
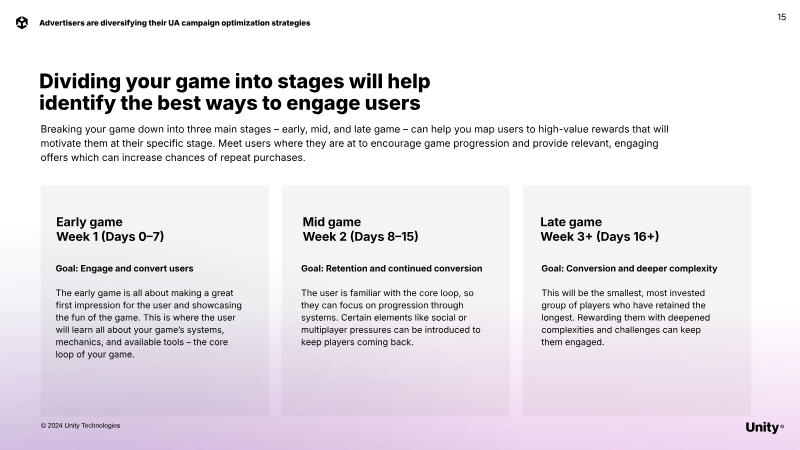
- In the 2023 Growth and Monetization Report, 77% of players who ever converted to IAP did so within the first two weeks.

The State of Gaming 2024: An Analysis of the Current Mobile Gaming Market Trends
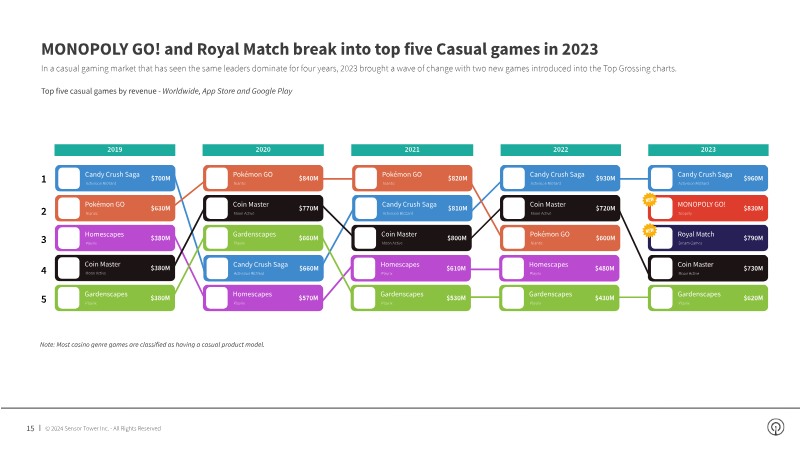
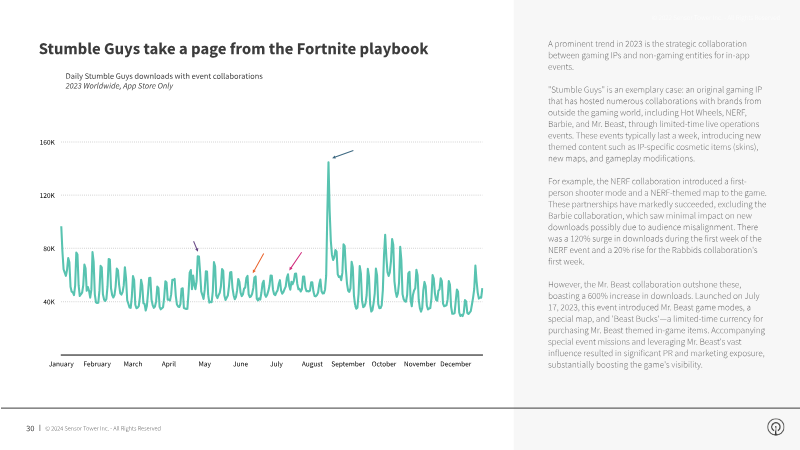
Sensor Tower's "The State of Gaming 2024" examines the mobile gaming market throughout 2023, covering multiple app stores, geographic markets, and game genres.
- Mobile game downloads declined in 2023, with the App Store down 6% and Google Play down 11% year over year.
- Hypercasual games led 2023 downloads at 37% share, but their downloads fell 14% year over year.
- Mid-core games generated 59% of 2023 mobile game revenue, while Casual games reached 38% and grew 8%.


Interactive Entertainment 2025: Global Market Sizing & Forecast
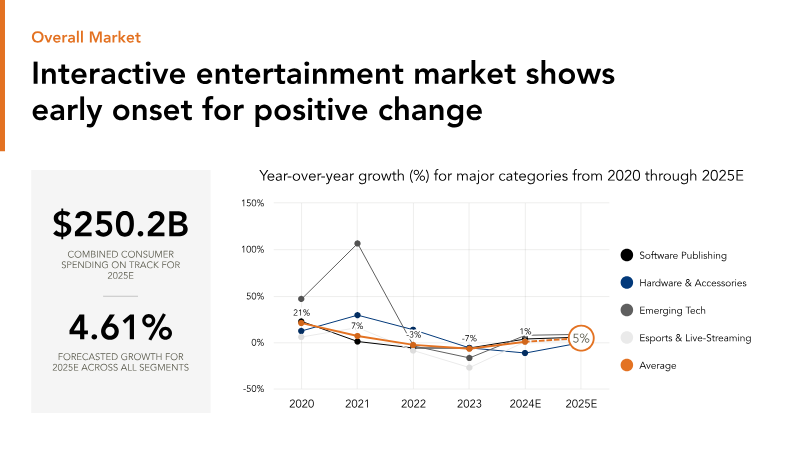
Global consumer spending on interactive entertainment is forecast to reach $250.2 billion in 2025E, up 4.6% year over year from roughly $239.2 billion in 2024E and $237.7 billion in 2023.
- The global interactive entertainment market is projected to reach $250.2 billion in consumer spending by 2025, marking a 4.6% year-over-year growth.
- Mobile gaming remains the industry's largest segment, with forecasted consumer spending of $115.7 billion in 2025.
- Console hardware is experiencing a significant cyclical downturn, with spending expected to decline by 31% in 2024 ahead of next-generation device launches.

The Xsolla Report: State of Play (Autumn 2024 Edition)
The Autumn 2024 Edition of The Xsolla Report, "State of Play," is a games-industry report published by Xsolla, a global video game commerce company.
- The report states that 77% of players have made purchases through web shops, and that 81% of players are aware web shops exist and have visited them.
- Asia is projected to contribute about $65 billion of the $98.7 billion in global mobile gaming revenue in 2024.
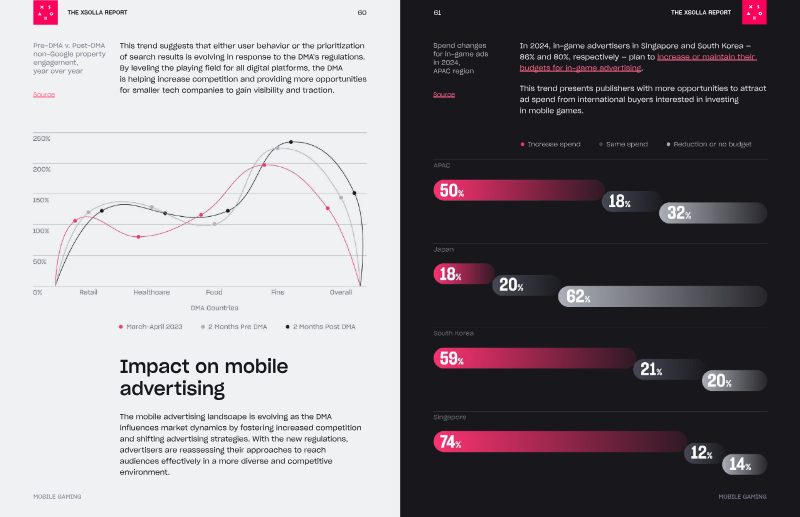
- Engagement with non-Google-owned search results in DMA-regulated countries grew from 138% to 163% year-over-year, a 25% increase.


State of Play: Winter 2024
The Xsolla Report: The State of Play, Winter 2024 edition, is a games-industry publication from Xsolla, a video game commerce company, covering the last five years of gaming, the influence of women in gaming, mobile gaming, cloud gaming, and investment patterns.
- Mobile gaming spend is projected by the document to reach $111.4 billion by the end of 2024, a 4% year-over-year increase that falls just short of the pandemic peak of $115.8 billion.
- Global in-app spending rebounded with 5.3% year-over-year growth, reaching a record $67.5 billion in the first half of 2023.
- The games industry reported an average annual growth rate of 3.9% and a 9.4% increase in 2023, reaching an estimated $106.8 billion in 2023.
Writers
Games and companies
Games