Skip to main content
Game Industry
Library
Library
Search
Ask AI
News
Connect your AI
Browse
The Catch Up
Topics
Collections
Writers
Help
Subscribe
Game Industry
Library
Library
Search
Ask AI
Saved
Library
23 reports matching your filters
All Types
Reports
Articles
Presentations
Whitepapers
Financial
Legal
Other
Search
Live Ops
Global
Market Analysis
Monetization
Mobile
Retention
Game Development
Japan
User Acquisition
Player Behavior
RPG
Investment
Marketing
PC
Console
Casual
Cloud Gaming
In-Game Advertising
Clear
Filters
1
Live Ops
Recently added
Newest first
Oldest first
Title A–Z
Title Z–A
Report
53 pages
Ad Monetization Without Killing Retention
Integrate advertisements as core gameplay design elements rather than external overlays to increase revenue without negatively impacting player retention.
Deploy rewarded video ads during high-stakes moments—such as revives, boosters, or time-limited rewards—to leverage scarcity and urgency for higher conversion rates.
Implement strategic gating for ad triggers based on level progression, total playtime, or specific cooldown periods to minimize player frustration.
Monetization
In-Game Advertising
Live Ops
+2
Sensor Tower
Apr 2026
Report
104 pages
2024 Integrated Report: Value Creation Story
The 2024 Integrated Report outlines a corporate mission focused on entertaining and enriching lives to make the world a better place.
The report identifies a specific event held on April 8, 2023, which recorded an attendance figure of 4,000 participants.
The document references the Kawasaki Brave Thunders, a professional basketball team, as part of its value creation narrative.
Mobile
Live Ops
Sports Games
+1
DeNA Co.
Report
4 pages
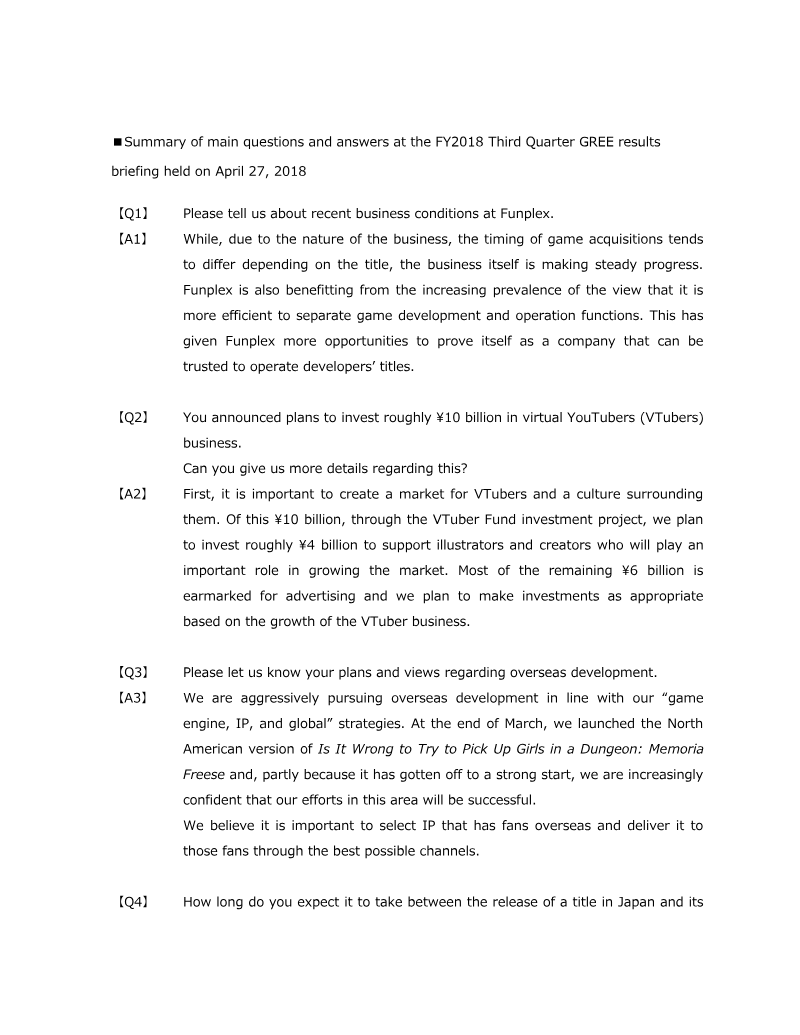
Summary of Main Questions and Answers at the FY2018 Third Quarter GREE Results Briefing: Japan
GREE is investing ¥10 billion into the VTuber market, with ¥4 billion allocated to creator support and ¥6 billion dedicated to advertising.
The company is leveraging its 3D rendering expertise to create synergies between VTuber content and VR technology to improve character interaction.
GREE’s international strategy focuses on a simultaneous or near-simultaneous global release schedule for Japanese IPs, exemplified by the North American launch of 'Is It Wrong to Try to Pick Up Girls in a Dungeon: Memoria Freese'.
Market Analysis
Investment
Game Development
+2
GREE
Report
1 pages
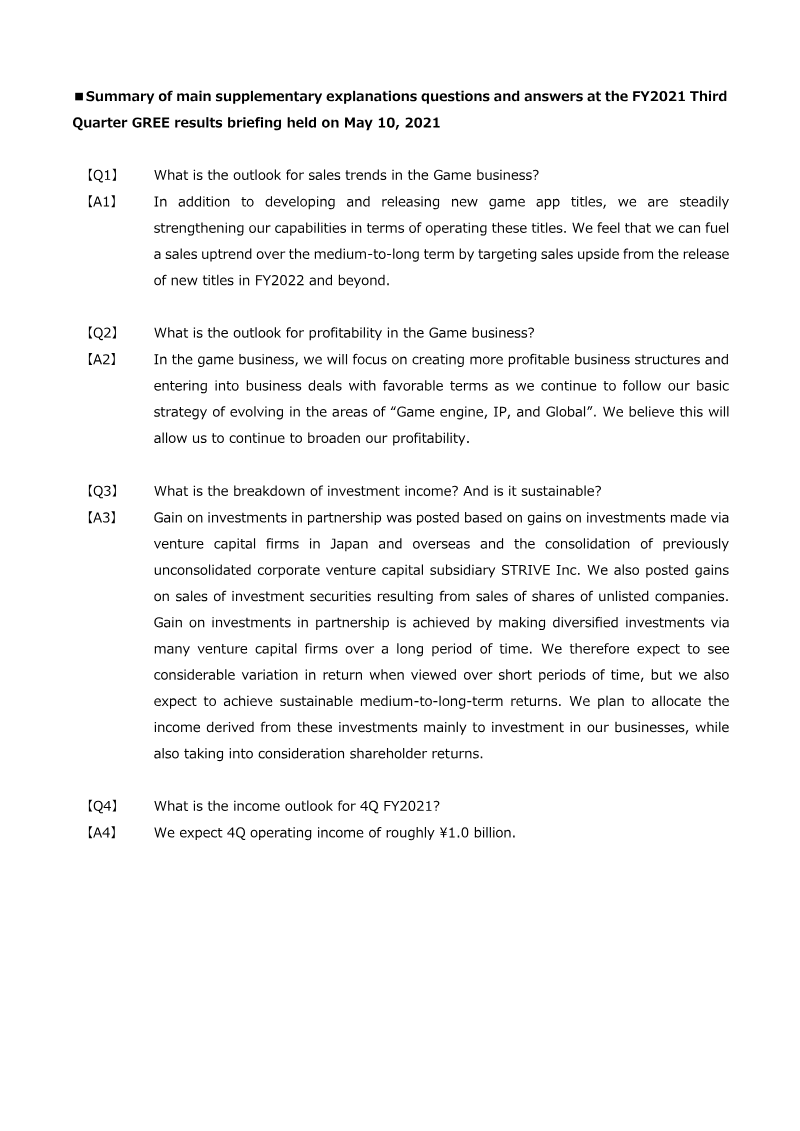
Summary of Main Supplementary Explanations Questions and Answers: FY2021 Third Quarter GREE Results Briefing
GREE projects operating income for the fourth quarter of FY2021 to reach approximately ¥1.0 billion.
The company anticipates a medium-to-long-term sales uptrend driven by a pipeline of new game titles scheduled for release in FY2022 and beyond.
Strategic growth initiatives focus on game engine development, intellectual property acquisition, and global market expansion.
Market Analysis
Game Development
Live Ops
+3
GREE
Report
2 pages
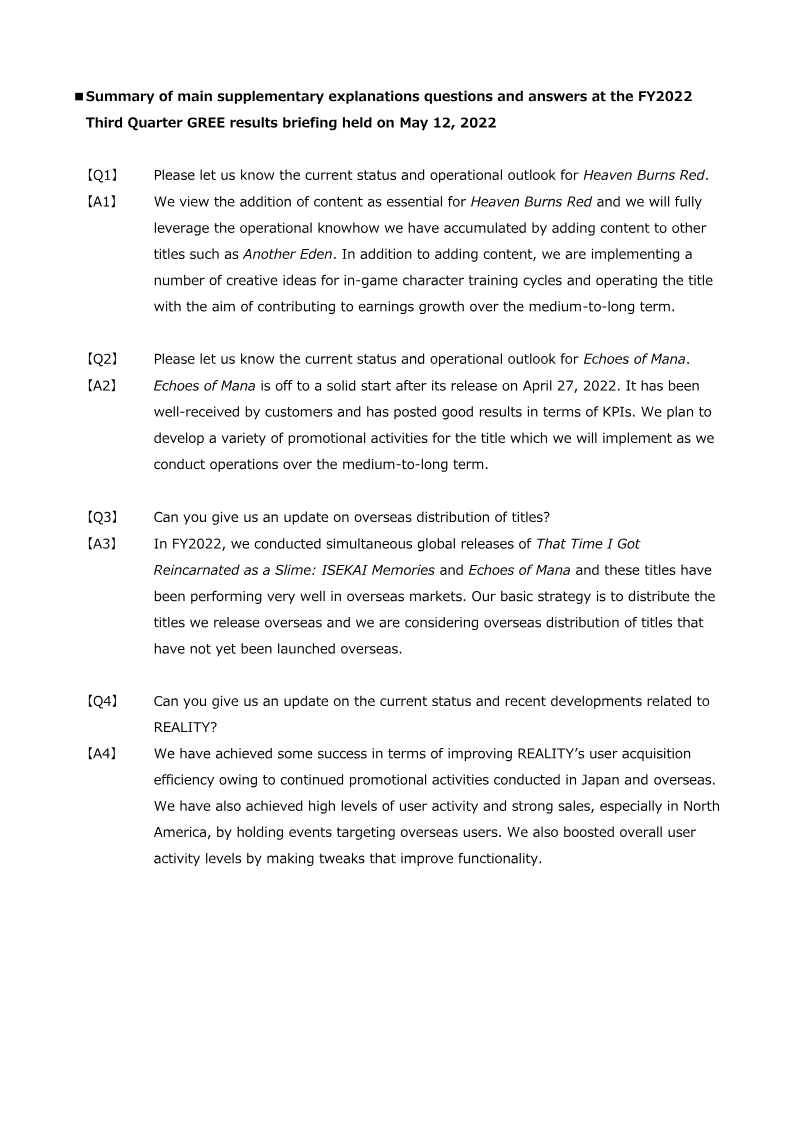
Summary of Main Supplementary Explanations Questions and Answers: FY2022 Third Quarter GREE Results Briefing
GREE projects Q4 operating income for its Internet and Entertainment Business to reach between ¥2.5 billion and just under ¥3.0 billion, driven by the performance of new titles.
The company reported a cumulative loss for Q3 FY2022, primarily due to volatility and a year-over-year decline in the Investment and Incubation Business.
Heaven Burns Red is being managed as a long-term growth engine, with the company applying operational experience from Another Eden to implement new content and training cycles.
Market Analysis
Live Ops
Mobile
+2
GREE
Report
3 pages
Summary of main supplementary explanations questions and answers at the FY2022 Fourth Quarter GREE results briefing held on August 4, 2022
GREE’s FY2022 Q4 earnings growth was driven by the successful launch of *Heaven Burns Red* and high-performing anniversary events, validating a 'release blitz' strategy focused on high-quality 3D rendering and marketing.
The company has allocated ¥10 billion over two to three years to its Metaverse business, which has currently reached a breakeven point as it seeks to expand its global user base.
Operating income for the Internet and Entertainment segment is projected to decline to ¥1.0–¥1.5 billion in FY2023 Q1, reflecting a normalization after the peak performance of new titles in FY2022 and ongoing system investments.
Market Analysis
Mobile
JRPG
+2
GREE
Report
2 pages
Summary of Main Supplementary Explanations Questions and Answers: FY2023 First Quarter GREE Results Briefing
GREE projects operating income for the Internet and Entertainment Business to reach between ¥1.0 billion and ¥1.5 billion in Q2 FY2023.
The flagship title 'Heaven Burns Red' maintains a stable user base, with the company leveraging its development and marketing lessons from this game to inform future title releases.
The metaverse segment, anchored by the platform REALITY, has reached a breakeven point and is currently reinvesting profits into promotional activities to scale its user base.
Market Analysis
Live Ops
Mobile
+2
GREE
Report
2 pages
Summary of Main Supplementary Explanations Questions and Answers: FY2024 Second Quarter
GREE forecasts consolidated operating income of approximately ¥1.5 billion for Q3 and ¥5.0 billion for the full fiscal year FY2024, excluding the Investment Business.
The company is shifting its Game and Anime Business strategy by discontinuing support for SINoALICE to prioritize more promising development projects.
Heaven Burns Red remains a core performance driver, with its two-year anniversary events contributing to strong financial results.
Market Analysis
Game Development
Mobile
+3
GREE
Report
3 pages
Summary of Main Supplementary Explanations Questions and Answers: FY2025 Full-Year Results
GREE is shifting its game division strategy to balance post-launch live-service volatility by investing in console titles built on proprietary IP.
The VTuber business has doubled sales per talent since FY2024, supported by a roster of approximately 90 talents and expanded merchandise and advertising channels.
The DX business is transitioning from a one-time project sales model to a recurring revenue structure, with modest growth expected through FY2026.
Market Analysis
Live Ops
Investment
+4
GREE
Report
15 pages
Q3 2022 Earnings Call: Stillfront Group AB
The provided report content contains only administrative header information and lacks the financial data, operational metrics, or strategic commentary necessary to extract specific insights regarding Stillfront Group AB's Q3 2022 performance.
No revenue figures, growth percentages, or specific business updates were present in the provided text to summarize.
The source material provided is incomplete and does not contain the body of the earnings call transcript required for analysis.
Market Analysis
Monetization
Live Ops
+2
Stillfront
Report
57 pages
How to Build an Effective Offer System in Your Game
A tiered pricing ladder ranging from under $1 to $99, which escalates after purchases and regresses during inactivity, allows for precise alignment with individual player spend propensity.
Conversion is driven by repeated exposure, with players typically requiring seven viewings of an offer before completing a purchase.
Strategic implementation of a limited set of offer types can drive conversion rates as high as 96% on login offers and increase repeat-purchase value by approximately 20% through endless offers.
Monetization
Live Ops
Market Analysis
+2
Sensor Tower
Jan 2026
Report
47 pages
How to Prepare Your Live Ops for the Holiday Season
Implement a series of short-term, 1-to-3-day events to generate immediate spikes in player engagement and session frequency.
Structure holiday content as a 'soft-sawtooth' difficulty curve that alternates between periods of challenge and respite to maintain player momentum.
Integrate holiday events directly into the core gameplay loop to ensure they feel like natural extensions of the existing experience rather than disruptive additions.
Live Ops
Monetization
Player Behavior
+2
Sensor Tower
Jan 2025
Report
40 pages
2024 Casual Gaming Apps Report
The casual gaming market is shifting from hyper-casual titles toward hybrid-casual and 3D match models, with 3D Match category market share on US iOS increasing fivefold between April 2023 and April 2024.
Developers are increasingly bypassing app store fees by adopting proprietary web stores and engagement-linked offers, a strategy now utilized by 70% of top-performing US casual games.
User acquisition costs are highly bifurcated, with iOS installs averaging $4.83 compared to $0.65 on Android, though iOS maintains a superior Day 7 return on ad spend.
Market Analysis
Monetization
Live Ops
+3
Liftoff
Apr 2024
Report
14 pages
The True Cost of Building a Mobile Game Backend
Building an in-house mobile game backend costs an average of $21.6 million, requiring 52 developers working over a 36-month period.
Diverting gameplay programmers to backend infrastructure tasks slows overall development velocity for 50% of surveyed studios.
Internal backend development contributes to negative organizational outcomes, including increased employee turnover, higher rates of crunch, and direct revenue loss for 20% of studios.
Game Development
Live Ops
Market Analysis
+2
Metaplay
Mar 2024
Report
14 pages
The True Cost of Building a Mobile Game Backend: Spring 2024
Building an in-house mobile game backend costs an average of $21.6 million per studio, based on 52 developers working for 36 months at a mean annual salary of $138,864.
The decision to build proprietary backend technology frequently diverts gameplay programmers from core development, with nearly 50% of studios reporting slowed production timelines as a result.
Internal backend development negatively impacts human capital, as one-third of surveyed studios reported increased employee crunch and higher turnover rates.
Live Ops
Game Development
Mobile
+1
Metaplay
Mar 2024
Report
24 pages
Mobile Gaming Benchmarks for Q1 2024
Global median retention rates for Q1 2024 are 22.91% for day-1, 4.20% for day-7, and 0.85% for day-28.
Classic genre titles, including board, card, casino, trivia, and word games, consistently outperform casual and mid-core titles in retention metrics across all tracked regions.
The global median session length is 4.45 minutes, though casino and card games significantly exceed this, reaching up to 25 minutes in European markets.
Retention
Live Ops
Mobile
+1
GameAnalytics
Jan 2024
Report
40 pages
Casual Gaming Apps Report 2024
Puzzle games now account for 37% of all mobile gaming installs as the industry shifts away from hyper-casual titles.
Casual mechanics are increasingly vital for mid-core titles, currently driving 74% of their total installs.
User acquisition costs on iOS remain significantly higher than Android, with a cost-per-install of $4.83 that is nearly eight times the rate on Android.
Market Analysis
Monetization
Live Ops
GameRefinery
Jan 2024
Report
24 pages
Mobile Gaming Benchmarks: Q1 2024
Global median retention rates for Q1 2024 were 22.91% for Day 1, 4.20% for Day 7, and 0.85% for Day 28.
Classic games, including board, card, casino, and trivia titles, consistently outperformed all other genres across most regions and metrics.
The global median session length is 4.45 minutes, with most genres averaging between 4 and 5 sessions per day.
Market Analysis
Retention
Live Ops
+2
GameAnalytics
Jan 2024
Report
13 pages
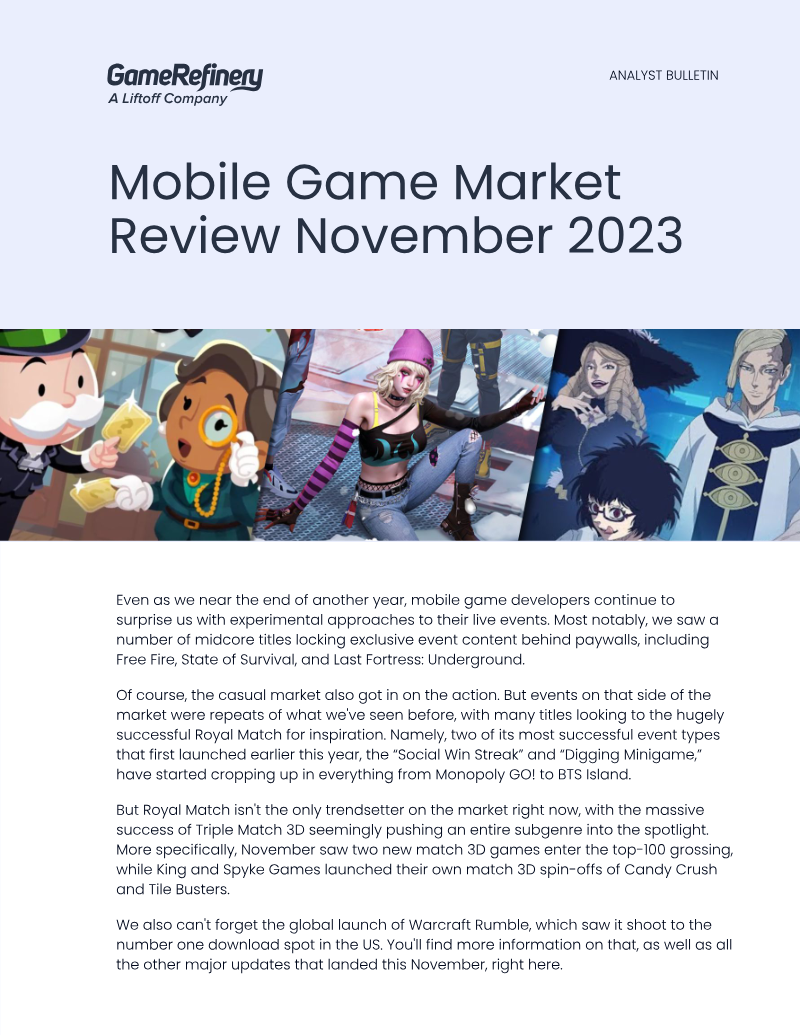
Analyst Bulletin: Mobile Game Market Review November 2023
Royal Match has emerged as the primary industry trendsetter, with competitors like Monopoly GO!, Matchington Mansion, and BTS Island adopting its 'Social Win Streak' and 'Digging Minigame' mechanics.
Midcore titles including Free Fire, State of Survival, and Last Fortress: Underground are shifting toward aggressive monetization by pay-gating exclusive event content and gameplay modes.
The 3D match subgenre is expanding rapidly following the success of Triple Match 3D, leading to new entries like Match Factory and 3D spin-offs of established franchises such as Candy Crush.
Market Analysis
Mobile
Global
+1
GameRefinery
Nov 2023
Report
47 pages
Game Development Report 2023
95% of studios are now pursuing or planning live service strategies, creating a critical mismatch with traditional, non-iterative production pipelines.
88% of developers are actively seeking new technological solutions to resolve systemic inefficiencies, specifically targeting long build times and fragmented 3D art pipelines.
Rising development costs, driven by AAA quality demands and technical debt from custom middleware, are currently impacting 77% of studios.
Market Analysis
Live Ops
Monetization
+1
Rendered VC
Jan 2023
Previous
1
2
Next