Diamond
Company
Documents about Diamond
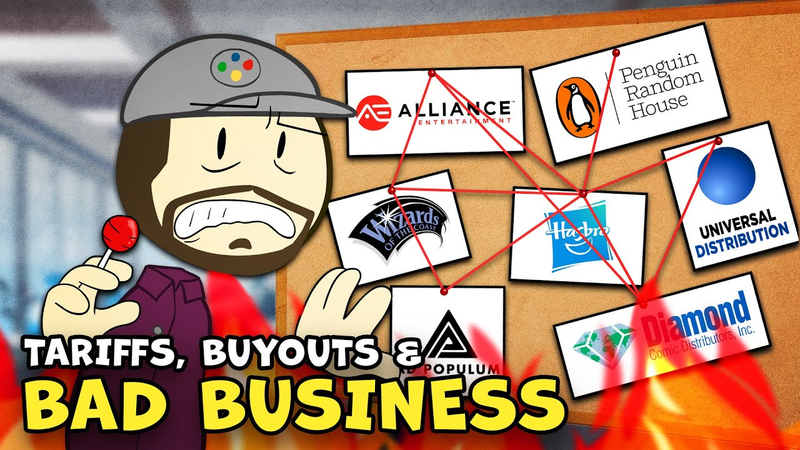
Board Games are in Trouble, and it's NOT Why You Think | Extra Credits
The board game and tabletop RPG industry is currently facing a systemic crisis driven by corporate consolidation, fragile global supply chains, and volatile trade policies.
- The board game industry is facing a systemic crisis driven by supply chain fragility, corporate consolidation, and volatile tariff policies that threaten the viability of publishers.
- The bankruptcy of Diamond Comic Distributors and the subsequent collapse of its subsidiary, Alliance Game Distributors, has created massive instability in the U.S. tabletop game distribution network.
- Modern board game production relies on 'just-in-time' supply chains that distribute manufacturing across multiple countries, making the process highly susceptible to border-crossing costs and tariff fluctuations.

How Chess.com became a $500M Business?
Chess.com has successfully transformed from a niche web portal into a dominant global platform, currently generating over $100 million in annual revenue with a valuation reaching $500 million.
- Chess.com has achieved a $500 million valuation and over $100 million in annual revenue by prioritizing a subscription-based model over aggressive advertising.
- The platform maintains a dominant market position with 200 million monthly web visits and a workforce of over 650 employees.
- Growth is driven by organic community engagement and strategic content rather than traditional paid user acquisition, bolstered by external catalysts like the COVID-19 pandemic and 'The Queen’s Gambit'.
Benchmarks: Steam Next Fest
This analysis evaluates the performance of games during the February 2025 Steam Next Fest (SNF) to determine how the event impacts wishlist acquisition and visibility.
- Steam Next Fest does not create momentum for games starting from zero; it functions as a tool to capitalize on existing interest, with minimal visibility lift for games entering with fewer than 2,000 wishlists.
- The tier of success a game enters Steam Next Fest with is highly predictive of its exit tier, as there is little evidence of games 'breaking out' from lower tiers to Diamond status during the event.
- Diamond-tier games (10,000+ wishlists earned) receive nearly triple the impressions by day two compared to lower-performing games, suggesting that Steam's algorithm amplifies games that already demonstrate high user appeal.
Benchmarks: How Many Wishlists Can I Get From Steam Next Fest
This analysis provides benchmarks for Steam Next Fest (SNF) performance based on data from 182 survey responses regarding the February 2026 event.
- Steam Next Fest performance is highly stratified, with top-tier games earning 10,000+ wishlists while underperforming titles are quickly suppressed by the algorithm, resulting in fewer than 1,000 wishlists.
- The Steam algorithm provides a brief baseline of visibility for all games during the first two days, but by day three, it aggressively shifts traffic toward top performers, effectively eliminating a 'middle class' of visibility.
- Total pre-existing wishlists are the strongest predictor of Steam Next Fest success, followed closely by recent wishlist velocity; both metrics serve as proxies for overall game quality.
What Is the Post Launch Discovery Queue
The Steam Discovery Queue (DQ) serves as a critical, often overlooked driver of visibility for games during their initial two-week launch window.
- The Steam Discovery Queue (DQ) accounts for nearly 50% of a game's total page visits during the two-week launch window, making it a critical driver of visibility.
- Steam treats all games roughly equally at launch, providing approximately 25,000 to 35,000 initial impressions, but the algorithm begins to favor or throttle games based on performance by day three.
- Diamond-tier games (earning $1M+) see a significant surge in DQ impressions after day three and a secondary boost around day seven, while lower-performing games see their impressions throttled.

Version1 Open to Merger or Other Options
Version1, the parent organization of the Minnesota RØKKR, is actively exploring strategic alternatives for its future, including potential mergers or acquisitions.
- Version1, the parent company of the Minnesota RØKKR, has officially begun exploring strategic options including a potential merger or acquisition.
- COO Brett Diamond stated that the organization is prioritizing a merger with another esports entity that aligns with their ownership group's vision.
- Despite the search for a partner, Version1 claims to be in good financial health, noting that it has met its financial projections every year.
The Median Indie Game Does Not Earn a Whole Lot
The indie game market on Steam is characterized by extreme revenue disparity, where the vast majority of titles generate minimal income.
- The median indie game released on Steam in 2019 earned only $1,136 in lifetime gross revenue.
- Steam revenue follows a extreme 'hockey stick' distribution, where reaching the top 4% of earners (Diamond tier) requires generating over $1 million in gross revenue.
- A game earning $10,000 in lifetime revenue sits in the 68th percentile, meaning it still outperforms nearly three-quarters of all titles on the platform.
What Is a Good Median Play Time for a Demo? Benchmark
Median play time serves as a critical, objective performance metric for game demos, offering a transparent view of player engagement that cannot be manipulated by marketing assets.
- Median play time is a critical performance metric for demos, with higher engagement strongly correlating to higher revenue tiers: Bronze (7 minutes), Silver (18 minutes), Gold (38 minutes), and Diamond (65 minutes).
- Across all surveyed demos, the average play time is 19.75 minutes, with a median of 14 minutes and a 70th percentile benchmark of 22 minutes.
- Players rarely finish a demo even if it is designed for a 30-minute duration, regardless of whether the game is linear or replayable.
Benchmarks for Selling a Game on Steam
The primary purpose of this analysis is to provide indie game developers with a framework for evaluating commercial performance on Steam.
- Steam revenue tiers for indie games are categorized as Bronze ($0–$10,000), Silver ($10,001–$249,000), Gold ($250,000–$999,000), and Diamond ($1 million+).
- The Steam algorithm begins actively promoting games through its recommendation widgets once they reach the Gold tier of $250,000 in lifetime gross revenue.
- A high-performing conversion rate for Steam wishlists to sales is 20%, with 15% considered a strong benchmark.
2022 CESA Games White Paper
The 2022 CESA Games White Paper serves as a comprehensive annual assessment of the global and domestic home video game industry.
- The 2022 CESA Games White Paper reports the total Japanese domestic home video game market (hardware and packaged software) at 371.9 billion yen, a slight decrease from 375.9 billion yen in 2020.
- The international home video game market reached 3.3978 trillion yen in 2021, showing growth from the 3.1316 trillion yen recorded in 2020.
- The Japanese domestic market for smart device game apps was estimated at 1.306 trillion yen in 2021, up from 1.2113 trillion yen in the previous year.
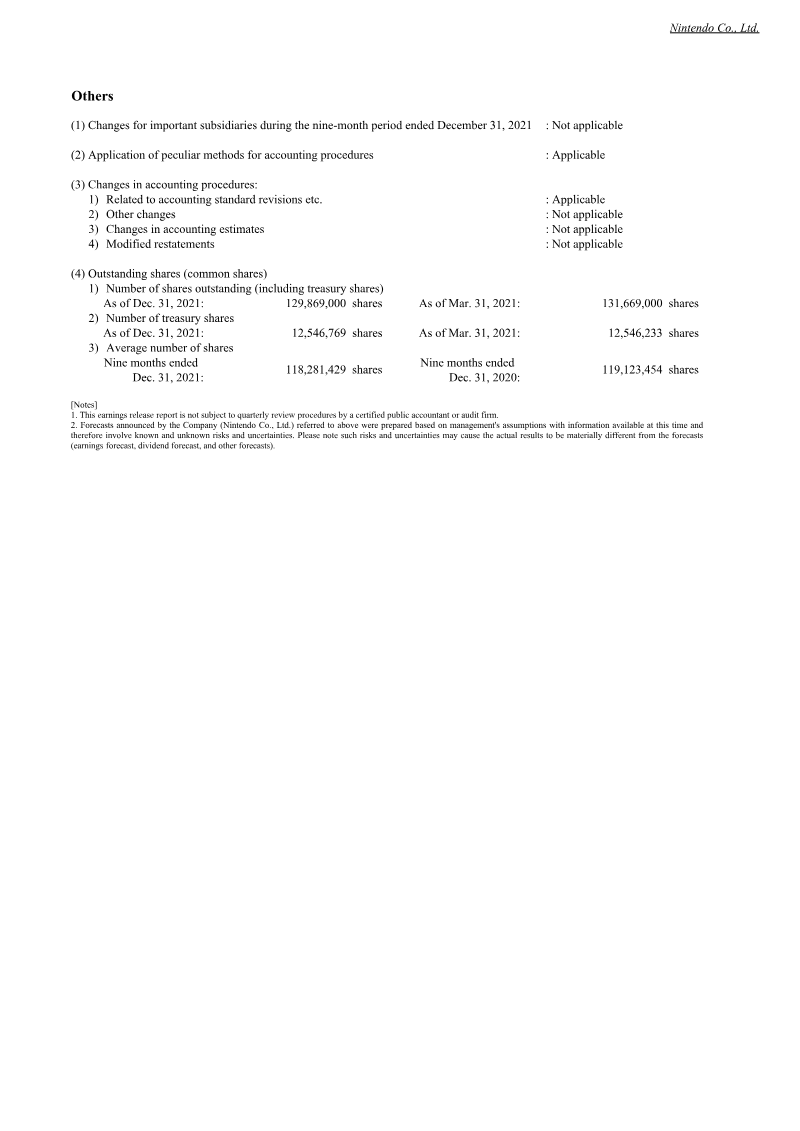
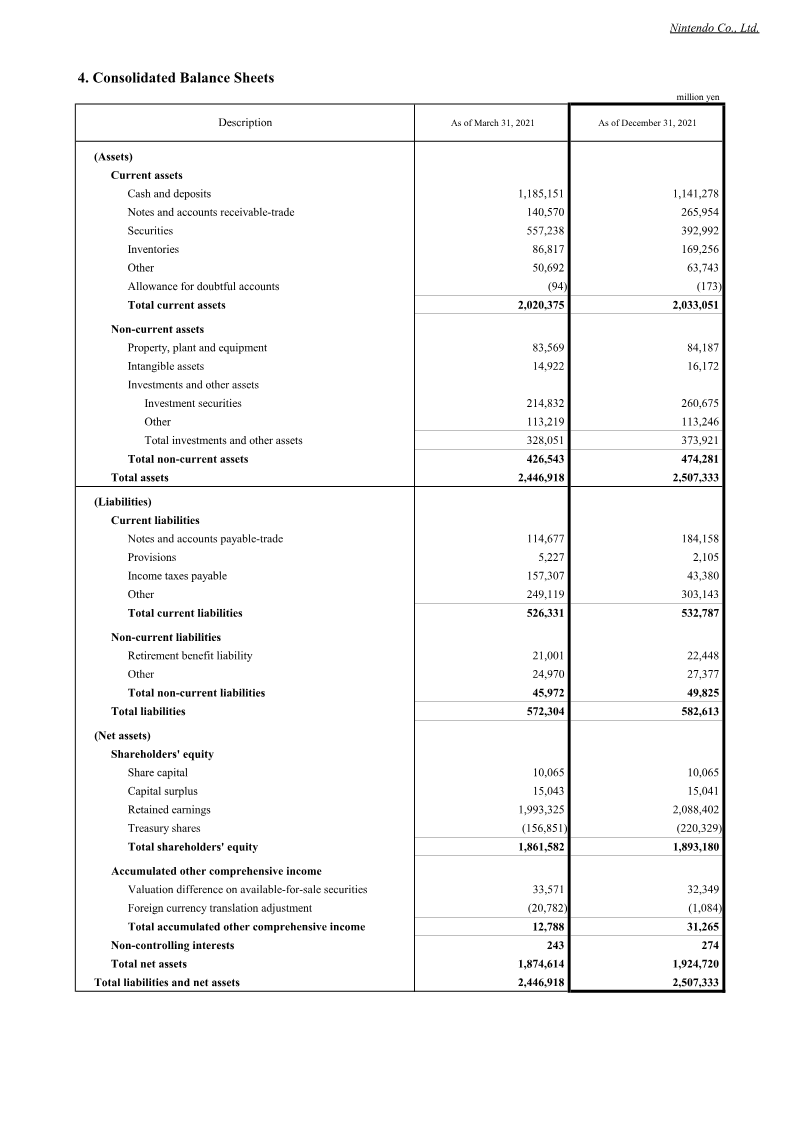
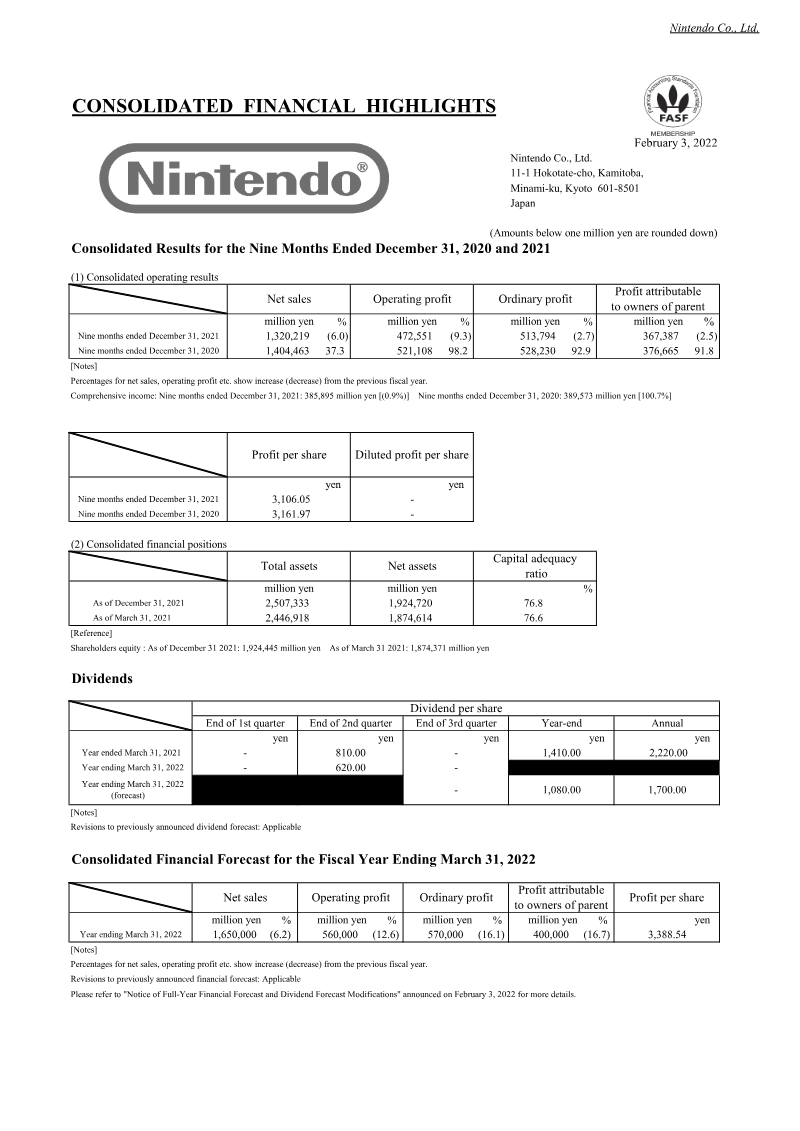
Consolidated Financial Results for the Nine Months Ended December 31, 2021: Nintendo
Nintendo’s consolidated financial results for the nine months ending December 31, 2021, reflect a period of transition characterized by a year-over-year decline in hardware sales following the exceptional performance of the previous fiscal year.
- Nintendo reported a year-over-year decline for the nine months ending December 31, 2021, with net sales falling 6.0% to 1,320.2 billion yen and operating profit dropping 9.3% to 472.5 billion yen.
- Hardware unit sales decreased 21.4% to 18.95 million units, though the launch of the Nintendo Switch – OLED Model helped the total install base surpass 100 million units.
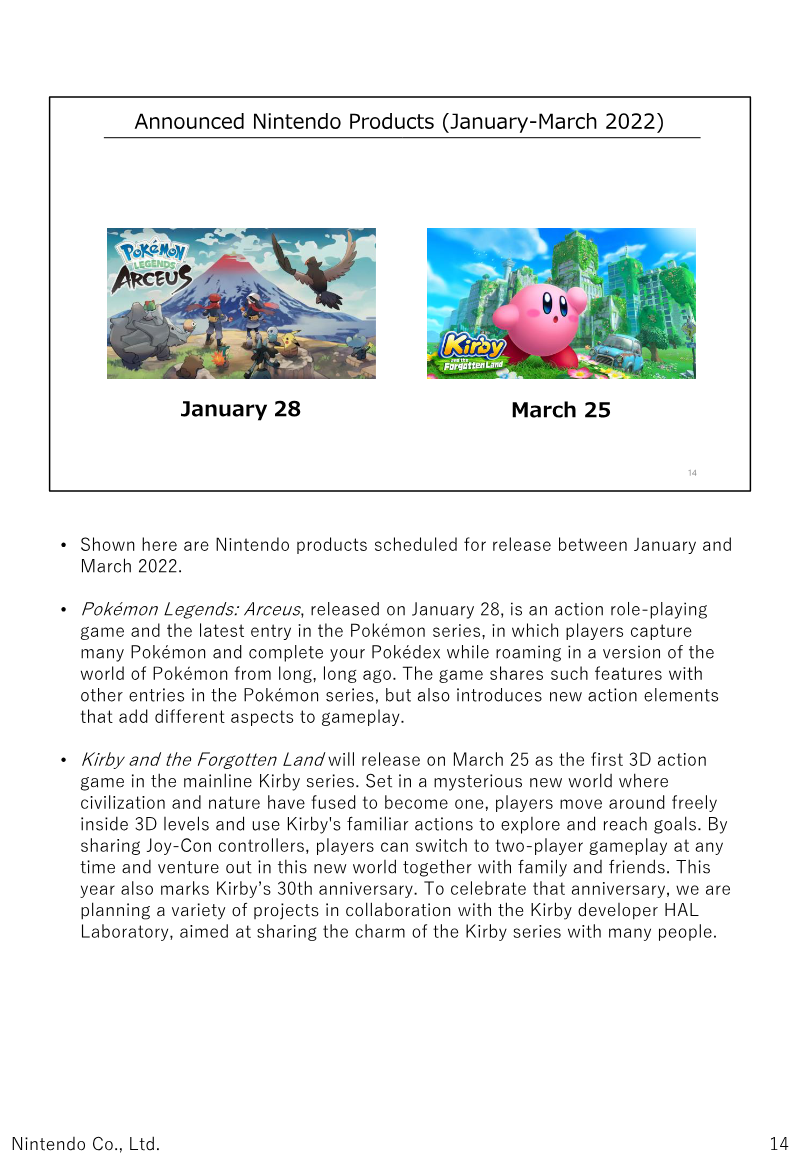
- Software sales remained resilient despite hardware declines, increasing 1.8% to 179.29 million units driven by titles like Pokémon Brilliant Diamond and Pokémon Shining Pearl.
Nintendo Financial Results Explanatory Material: 3rd Quarter of Fiscal Year Ending March 2022
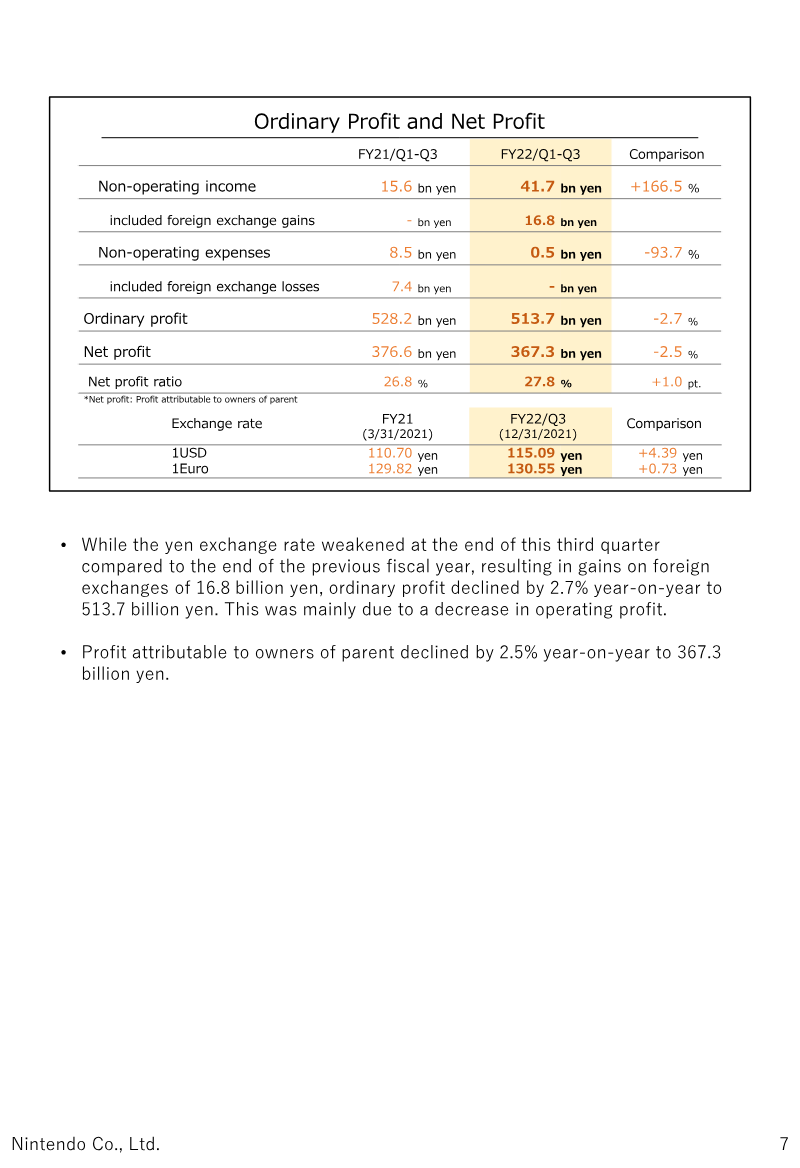
Nintendo experienced a period of transition during the first nine months of the fiscal year ending March 2022, characterized by a year-on-year decline in net sales and operating profit.
- The Nintendo Switch platform surpassed 100 million cumulative units sold during the first nine months of the fiscal year ending March 2022.
- Net sales and operating profit declined year-on-year due to the normalization of demand following the previous surge in Animal Crossing: New Horizons sales and ongoing semiconductor shortages.
- Digital revenue increased by 31.2% in the third quarter, driven by strong demand for downloadable content, add-on expansions, and the Nintendo Switch Online subscription service.