Report26 pages
China Steam & PC Gaming Market Report: 2025
The Chinese PC gaming market has reached a valuation of approximately $11–12 billion within a broader national gaming industry worth RMB 350.78 billion. Steam maintains a dominant position, commanding an 87% market share, though the broader distribution landscape remains highly fragmented. Developers must navigate a complex ecosystem where traditional storefront metrics are often obscured by grey-market and cross-region transactions. Consequently, pricing strategies must account for local market realities, as Steam titles in China are consistently priced 21% to 37% lower than Western benchmarks to align with regional purchasing power and consumer expectations.
Success in this market is increasingly predicated on community-led discovery rather than traditional store-page traffic. Platforms such as Bilibili, TapTap, Heybox, and Sonkwo serve as essential hubs for user-generated content, creator-driven promotion, and player engagement. The rise of a sophisticated fan economy further underscores this shift, as hit titles are now built through long-term community hype and viral social media resonance. Specialized offline events, such as WePlay Expo and G-Fusion, have proven more effective for reaching core PC and indie gaming audiences than mass-market trade shows.
International developers looking to penetrate this sector must prioritize local content ecosystems over conventional marketing funnels. Because discovery and validation are driven primarily by streamers and community influencers, go-to-market strategies require deep integration with Chinese digital platforms. Navigating these unique cultural and commercial dynamics necessitates specialized local expertise to effectively manage community engagement and optimize commercialization efforts within this distinct, high-growth environment.
- Steam dominates the Chinese PC gaming market with an 87% share, contributing to a total PC gaming valuation of approximately $11–12 billion.
- Pricing for Steam titles in China must be adjusted 21% to 37% lower than Western benchmarks to align with local purchasing power and consumer expectations.
- Market discovery is driven by community-led engagement on platforms like Bilibili, TapTap, Heybox, and Sonkwo rather than traditional store-page traffic.
- Successful market entry requires deep integration with local digital ecosystems and influencer-driven promotion rather than conventional marketing funnels.
- Specialized offline events such as WePlay Expo and G-Fusion are more effective for reaching core PC and indie gaming audiences than mass-market trade shows.
+1
Asia GameDev
Report49 pages
Essential Facts about Video Games in Italy: 2025
In 2025, roughly 14.2 million Italians—about a third of the population aged six to seventy‑five—engage in video gaming, with a pronounced male bias and a concentration of players under 35. The industry’s total revenue remains steady at €2.4 billion, of which game sales account for 77 percent (€1.8 bn). Gaming time has risen to nearly eight hours per week, driven primarily by smart‑device play (22 percent reach, €929 m revenue) and console gaming (13 percent reach, €643 m). App‑based games now represent more than half of the market, dominated by freemium monetisation; only one percent of app revenue comes from upfront purchases.
Revenue distribution varies by platform. Smart‑device earnings are almost entirely from in‑app purchases (ARPU €84), while console sales lean heavily on digital downloads—65 percent of new game revenue comes from full‑game downloads (€502 m) and 21 percent from DLC (ARPU €99). PC revenue is largely driven by DLC (43 percent) and full‑game downloads (98 percent of console sales). Subscription services are pivotal: console ecosystem subscriptions contribute 59 percent of total gaming‑subscription revenue (€153 m), with mobile and single‑game franchises accounting for 6 percent and 35 percent respectively.
Player demographics reveal that smart devices attract a younger, male‑skewed audience (31 percent of 6–17‑year-olds), whereas console and PC gaming remain niche but heavily male‑skewed, concentrated among teens. Casual and sports titles dominate sales across all platforms, with subscription services such as PlayStation Plus and Xbox Game Pass driving a significant share of paid play. Engagement patterns show males spending the most hours on consoles (average seven hours per week), while PC gaming remains steady across age groups. Approximately one‑quarter of players follow gaming news on YouTube or vlogs, and 20 percent rely on social media or family discussions for information. The data derive from a nationally representative online survey of 3,000 respondents, weighted against an offline omnibus sample and calibrated to industry sales figures.
- The Italian video game market generated €2.4 billion in 2025, with game sales accounting for 77 percent (€1.8 billion) of total revenue.
- App-based gaming dominates the market, representing over half of total revenue with a freemium model where only one percent of earnings come from upfront purchases.
- Smart devices are the primary revenue driver at €929 million, while console gaming accounts for €643 million, supported by an average of eight hours of gameplay per week across the population.
- Console revenue is heavily reliant on digital distribution, with 65 percent of new game sales coming from full-game downloads and 21 percent from DLC.
- Console ecosystem subscriptions are the primary driver of the subscription market, contributing 59 percent (€153 million) of total subscription revenue.
+4
IIDEA – Italian Interactive Digital Entertainment Association
Report34 pages
2026 Mobile & PC Gaming Benchmarks
The global gaming landscape in 2026 is defined by a widening performance gap between a small elite of top-tier titles and the broader market. Data derived from over 16,000 live mobile games indicates that retention metrics, including D1, D7, and D30, are in a state of decline. With median D30 retention falling below 1%, the industry has become increasingly unforgiving, necessitating a strategic shift toward immediate, high-quality onboarding and the refinement of core gameplay loops to mitigate rising churn rates.
Mobile gaming engagement remains characterized by high-frequency, habitual daily play, yet the industry suffers from a stagnation in innovation and an over-reliance on monetization at the expense of genuine engagement. Success in this segment requires developers to move beyond generic feature sets and instead prioritize behavioral loops that foster long-term habit formation. Conversely, the PC gaming sector operates on a different paradigm, where success is measured by depth, session length, and content longevity. On this platform, retention and engagement metrics serve as indicators of long-term player commitment and the intrinsic value of immersive, long-form experiences rather than simple return frequency.
To navigate these challenges, studios are increasingly turning to advanced data-driven infrastructure to optimize player experiences. By leveraging real-time insights and sophisticated market intelligence, developers can better align their growth strategies with evolving player behaviors. Ultimately, the ability to sustain a competitive advantage in both mobile and PC markets depends on a rigorous focus on content quality and the implementation of robust, data-informed engagement strategies that cater to the specific demands of each platform.
- Mobile gaming retention is in decline, with median D30 retention rates falling below 1% across a sample of over 16,000 live titles.
- The gaming market is experiencing a widening performance gap where a small elite of top-tier titles increasingly dominates the broader landscape.
- Mobile success now requires a strategic pivot toward immediate, high-quality onboarding and core gameplay loops to counter rising churn rates.
- Mobile engagement is currently stagnant due to an over-reliance on monetization, necessitating a shift toward behavioral loops that foster long-term habit formation.
- PC gaming success is defined by long-form, immersive experiences where metrics like session length and content longevity are the primary indicators of value.
+3
GameAnalyticsJun 2026
Report41 pages
PC/Console Gaming Index: 2025
The 2025 PC/Console Gaming Index demonstrates that action titles dominate the market, with approximately 262 million downloads year‑to‑date. Indie and AA developers such as R.E.P.O., Split Fiction, and Peak contribute the majority of these downloads, while Steam remains the leading platform for both volume (≈450 million downloads) and premium revenue. Console ecosystems differ: PlayStation and Xbox each secure around 376 million and 283 million downloads respectively, with a pronounced preference for AAA releases (≈50 % each).
Electronic Arts leads global download counts at roughly 82.8 million, followed by Microsoft (≈71 million) and Sony (≈55 million). Steam’s marketplace favors indie publishers, who account for 60 % of downloads, whereas PlayStation and Xbox are dominated by large studios. Monetization patterns diverge across platforms: Xbox users largely adopt free‑to‑play models (≈39 % of downloads), driven by Game Pass and cross‑platform titles, whereas Steam users prefer premium content (≈79 % paid). PlayStation exhibits the highest premium skew among consoles, with 83 % of downloads from paid titles.
Microsoft’s year‑to‑date download total reaches 452 million, with mobile accounting for 83 % of that figure and PC/console contributing 75 million. Sony’s strategy focuses on internal studios, generating 55 million PC/console downloads and 15 million mobile downloads centered on anime‑IP titles. Key publishers such as Kepler Interactive and Deep Silver excel in AA performance, while American and Japanese studios dominate global PC/console downloads—particularly on Xbox (over 50 % US share) and PlayStation (22 % Japanese share).
Monster Hunter Wilds illustrates a shift from pre‑launch pet and cooking themes to post‑launch epic gameplay, with US creatives featuring PlayStation branding and Japanese creatives using Capcom branding. Steam remains the dominant download platform, delivering nearly four times more downloads than PlayStation. The campaign’s channel shift saw TikTok fall from #2 to #7 post‑launch, while OTT rose to #2 in US spend, indicating a transition from trend‑driven hype to sustained engagement.
- Steam remains the dominant platform for PC/console gaming, generating approximately 450 million downloads year-to-date, which is nearly four times the volume of PlayStation.
- Monetization strategies are platform-specific: 79% of Steam downloads and 83% of PlayStation downloads are premium, while 39% of Xbox downloads are free-to-play, largely driven by Game Pass.
- Indie and AA developers drive the majority of the 262 million action-genre downloads, with indie titles accounting for 60% of total downloads on Steam.
- Electronic Arts leads global download counts at 82.8 million, followed by Microsoft at 71 million and Sony at 55 million for PC/console segments.
- Console ecosystems show a strong preference for AAA releases, which constitute approximately 50% of downloads on both PlayStation and Xbox.
+3
Sensor Tower
Report36 pages
Asia Pacific Market Report 2025: Creating Opportunities for Video Games in Asia
Asia’s gaming landscape in 2025 is dominated by a triad of regional strengths that together shape the global market. Japan remains the cultural nucleus, with iconic franchises such as Pokémon, Final Fantasy and Monster Hunter generating $215 billion in worldwide influence and $178.8 million in IP revenue, while mobile titles like Fate/Grand Order expand overseas earnings. The country’s mature domestic market and brand prestige are offset by regulatory limits on gacha mechanics, sparse esports sponsorships, and a need to align with global live‑service standards. Success will depend on leveraging storytelling prowess and anime‑gaming synergies rather than chasing fleeting trends.
South Korea contributes a high‑speed, 5G‑driven esports ecosystem and hybrid free‑to‑play models that set industry benchmarks for competitive play and monetization. Southeast Asia, meanwhile, is the fastest‑growing mobile‑centric market, with a $14.8 billion industry powered by 680 million under‑30 residents and high mobile engagement. Monetization is shifting from ad‑heavy hypercasuals to midcore RPGs and MOBAs, supported by local payment systems such as GCash and GoPay. Esports in the region is projected to generate $350–380 million, underscoring its economic significance.
Developers face significant entry barriers across the APAC region, including localization challenges, fragmented regulations, and diverse payment ecosystems. End‑to‑end solutions that integrate local payments, provide compliance support, and enable flexible distribution are essential. Embedding community‑driven monetization—through affiliate revenue shares, in‑game branded content, and live‑stream partnerships—offers a sustainable path to growth. The overarching thesis is that deep cultural insight, sharp localization, and adaptability to mobile‑first dynamics are the keys to unlocking opportunities in Asia’s rapidly evolving gaming market.
- Southeast Asia is the region's fastest-growing mobile-centric market, currently valued at $14.8 billion and driven by a demographic of 680 million residents under the age of 30.
- Japan remains a global cultural powerhouse, with iconic franchises generating $215 billion in worldwide influence and $178.8 million in IP-specific revenue.
- Esports in Southeast Asia is a significant economic driver, with projected revenue between $350 million and $380 million.
- Market entry in the APAC region requires integrated solutions for fragmented regulations, diverse payment ecosystems like GCash and GoPay, and complex localization challenges.
- Monetization strategies in Southeast Asia are shifting away from hypercasual ad-heavy models toward midcore RPGs and MOBAs.
+2
GamesBeat
Presentation89 pages
Capital Markets Event 2025: Coffee Stain Group
Capital Markets Event 2025 showcases the Coffee Stain Group’s strategy of building a portfolio around small, autonomous teams that prioritize gameplay quality and community engagement. Ninety percent of net sales derive from a handful of flagship titles—most notably Goat Simulator, Deep Rock Galactic and Satisfactory—which consistently achieve high review scores (above 96 %) and generate lifetime sales up to SEK 2 bn. The company’s partnership model, publishing and investing in niche‑focused games, sustains long‑term value through continuous content updates and a symbiotic developer‑player relationship.
The global gaming market is projected to grow at 3 % CAGR across all platforms, driven by rising consumer spend and the expansion of Steam, mobile, Game Pass and PlayStation Plus. Despite saturation and increased competition for player attention, Coffee Stain maintains a strong presence; its titles enjoy high review counts (over 500 k for Goat Simulator) and retain players through regular updates, platform expansions and community‑driven development. Innovation, creative gameplay and long‑term support are core to the firm’s approach.
Strategic collaborations reinforce this model. The partnership with Tuxedo Labs leverages the proprietary Teardown physics engine, producing a highly engaged community (10 000+ mods, 20 major updates) and peak concurrent users of 60 k for Deep Rock Galactic seasons. The studio’s headcount grew from six to 47 FTEs over five years, illustrating the scalability of open development and a “make happy decisions” culture that drives both critical acclaim (e.g., 9.5/10 reviews) and commercial success.
Coffee Stain’s Roblox title, Welcome to Bloxburg, exemplifies a successful free‑to‑play transition. With 791 k daily active users and SEK 1.35 bn in lifetime net sales, the monetization mix of currency purchases, optional unlocks and a premium subscription maintains a non‑pay‑to‑win stance while rebuilding player trust. The company’s lean cost base and strong cash generation are amplified by launch‑driven sales spikes from new content releases and strategic stakes such as its 30 % share in Iron Gate’s Valheim publishing.
Financially, the group reports a net‑sales CAGR of 34 % to SEK 1.2 bn and a cash EBIT margin of 44 %. Cash reserves reach SEK 472 m in 2025, with no external debt, providing flexibility for capital allocation and potential M&A. The lean, autonomous team model underpins low overheads, high cash conversion (≈120 %) and a focus on developing existing IPs while selectively pursuing new opportunities across platforms and partnerships.
- Coffee Stain Group maintains strong financial health with a 34% net-sales CAGR to SEK 1.2 bn, a 44% cash EBIT margin, and 120% cash conversion.
- The company holds SEK 472 m in cash reserves with zero external debt, providing significant flexibility for future M&A and capital allocation.
- Ninety percent of net sales are generated by a core portfolio of flagship titles—Goat Simulator, Deep Rock Galactic, and Satisfactory—which consistently maintain review scores above 96%.
- The Roblox title Welcome to Bloxburg has achieved 791,000 daily active users and SEK 1.35 bn in lifetime net sales following its transition to a free-to-play model.
- Strategic partnerships and investments, such as a 30% stake in Valheim publisher Iron Gate and the collaboration with Tuxedo Labs, serve as key drivers for long-term value and IP expansion.
+3
Coffee Stain Group AB
Report9 pages
ESG Fact Sheet: FY 2023/24
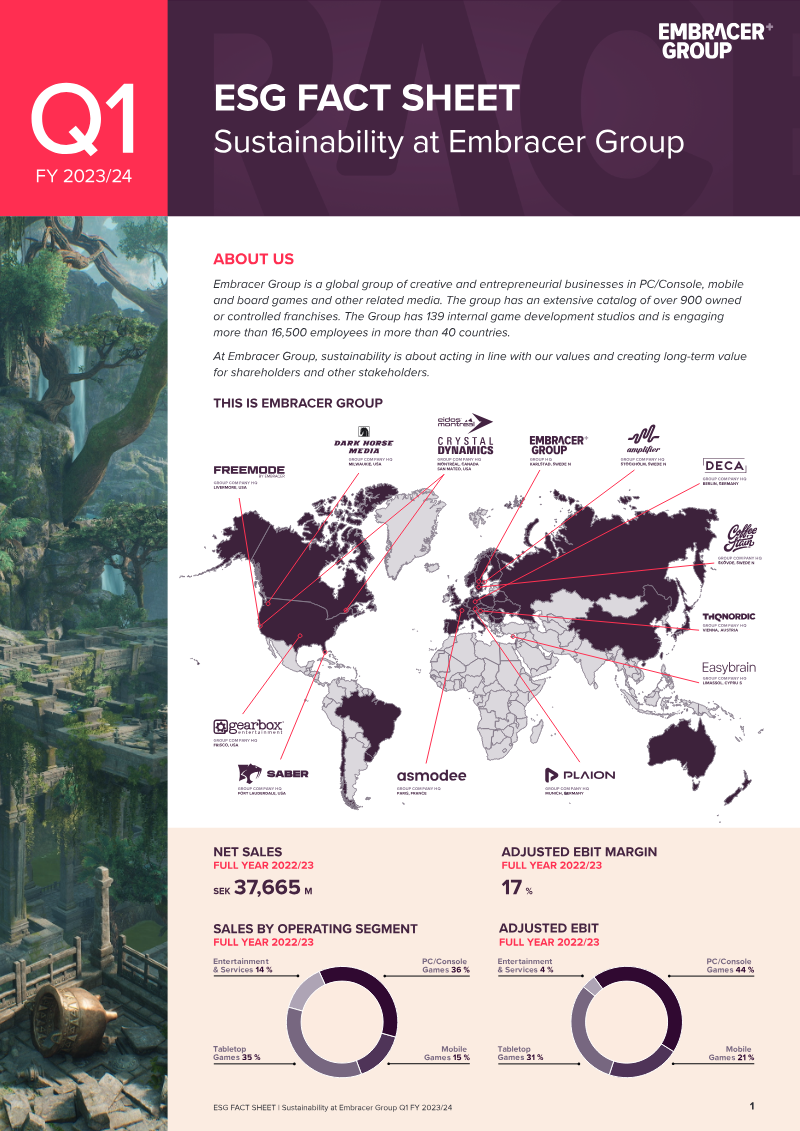
Embracer Group’s FY 2023/24 ESG Fact Sheet outlines the company’s sustainability framework, titled Smarter Business, which focuses on three core pillars: Great People, Solid Work, and Our Planet. Operating across more than 40 countries with 139 internal studios, the organization aims to integrate ethical governance and long-term value creation into its global operations. The company’s sustainability strategy is supported by 16 group policies and 12 guidelines, with oversight provided by the Audit and Sustainability Committee and an internal Ambassador Group.
Key performance indicators for the 2022/23 financial year highlight both progress and areas for development. Within the Great People pillar, the company reported a 26% female representation rate and an employee satisfaction score (eNPS) of +29. To foster leadership diversity, the board has committed to doubling the number of female managing directors and studio heads by 2025. Regarding environmental impact, the company has conducted a comprehensive greenhouse gas inventory, reporting total emissions of 687,102 tCO2e. The firm has aligned its climate strategy with the Paris Agreement, targeting a 45% reduction in carbon emissions by 2030 compared to a 2021/22 baseline.
The company utilizes a structured methodology for tracking progress, including annual global employee surveys and standardized sustainability due diligence during acquisitions. Furthermore, the organization actively participates in industry-wide initiatives such as the UN Global Compact, Women in Games, and PlayCreateGreen. By integrating these partnerships with internal training programs on privacy and ethics, the company seeks to manage operational risks while promoting digital well-being and accessibility across its portfolio of over 900 franchises.
- Embracer Group has committed to a 45% reduction in total carbon emissions by 2030, using the 2021/22 financial year as its baseline.
- The company reported total greenhouse gas emissions of 687,102 tCO2e for the 2022/23 financial year.
- Female representation across the organization stands at 26%, with a board-level mandate to double the number of female managing directors and studio heads by 2025.
- The organization maintains an employee satisfaction score (eNPS) of +29 across its 139 internal studios.
- Sustainability oversight is managed through 16 group policies and 12 guidelines, with governance provided by an Audit and Sustainability Committee and an internal Ambassador Group.
+3
Embracer Group
Report80 pages
PC & Console Gaming Report 2026
1. Market trajectory What direction is the PC and console market heading in 2026? 8 What direction is the PC and console market heading in 2026? 2. Attention & value allocation Where do players spend time and money on PC and console? 17 3. Market concentration What happens if you are not a top-20 game? 45 4.
- PC player base is projected to exceed one billion by 2028, with a CAGR of 2.9% from 2025-2028, while console player growth moderates with a 2.2% CAGR in the same period.
- Almost two-thirds of console revenues (PlayStation and Xbox) go to the top 20 games, whereas on PC, over half of revenue comes from games ranked 21+.
- PC is the only platform effectively monetizing Free-to-Play (F2P) games, with revenue holding stable despite falling playtime in the west; on console, F2P revenue is dropping faster than engagement.
- Games ranked 21+ are capturing a growing share of playtime across platforms, with PC showing the strongest shift since 2022, indicating market disaggregation and growth from outside the top 20 titles.
- Premium game revenue is growing on PC and PlayStation, but Xbox's more modest growth cannot offset declines in F2P and Call of Duty.
+3
NewzooApr 2026
Report6 pages
GungHo Business Report Vol. 42
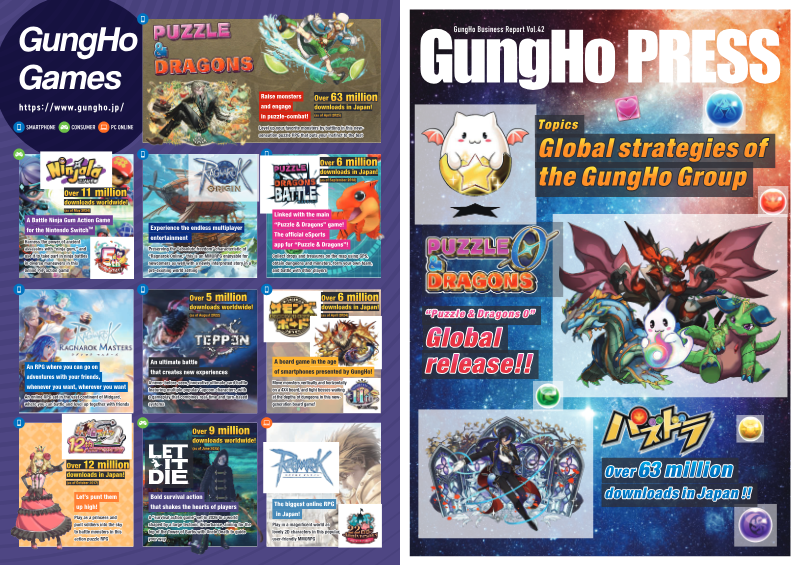
GungHo Online Entertainment’s Vol. 42 report outlines the company’s strategic focus on expanding its two flagship intellectual properties—Puzzle & Dragons and Ragnarok—into global markets while sustaining robust financial performance. The report highlights that Puzzle & Dragons, launched in 2012, has achieved over 63 million downloads worldwide and continues to drive user engagement through frequent events, cross‑media collaborations, and a 13th‑anniversary release in May 2025. The Ragnarok franchise, managed by subsidiary Gravity Co., Ltd., has expanded from its original PC MMORPG roots to mobile and console titles, with recent releases such as Ragnarok X (PC/Android/iOS) and LUNAR Remastered Collection targeting Latin America, Southeast Asia, and other regions.
Financially, consolidated net sales rose from ¥125.3 billion in 2022 to ¥103.6 billion in 2024, with operating profit increasing from ¥27.9 billion to ¥17.5 billion over the same period. Overseas sales ratio climbed from 39.3 % in 2022 to 47.7 % in 2024, reflecting successful international penetration. The company maintained a dividend payout ratio above 30 % and executed treasury‑share repurchases totaling ¥9.86 billion in 2024, underscoring a commitment to shareholder value.
Methodologically, the report aggregates data from internal analytics on downloads, MAU, and revenue across more than 150 countries in 11 languages. It also references quarterly performance metrics and event‑based user activity to gauge engagement. Overall, the document presents a cohesive narrative of sustained growth through IP expansion, diversified platform presence, and disciplined financial management.
- GungHo’s overseas sales ratio grew from 39.3% in 2022 to 47.7% in 2024, signaling a successful shift toward international market penetration.
- Consolidated net sales decreased from ¥125.3 billion in 2022 to ¥103.6 billion in 2024, with operating profit declining from ¥27.9 billion to ¥17.5 billion over the same period.
- The flagship title Puzzle & Dragons has surpassed 63 million global downloads since its 2012 launch and is preparing for a 13th-anniversary release in May 2025.
- Subsidiary Gravity Co., Ltd. is actively diversifying the Ragnarok franchise across PC, mobile, and console platforms, specifically targeting growth in Latin America and Southeast Asia.
- The company maintains a commitment to shareholder returns, evidenced by a dividend payout ratio exceeding 30% and ¥9.86 billion in treasury-share repurchases during 2024.
+4
GungHo Online Entertainment
Report2 pages
Ragnarok Online 3: Service to Begin in Japan
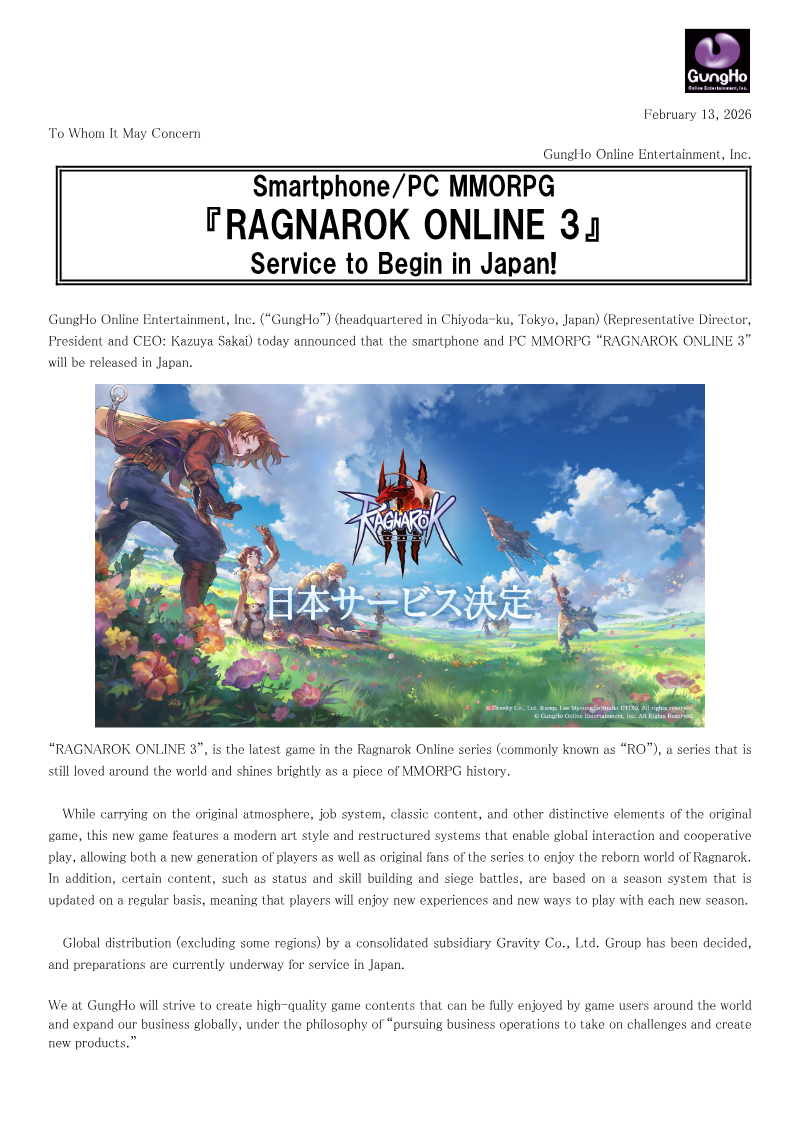
Ragnarok Online 3 is announced as a free‑to‑play smartphone and PC MMORPG that will launch in Japan on February 13, 2026. Developed by Gravity Co., Ltd. and Lee MyoungJin (studio DTDS) under GungHo Online Entertainment’s publishing umbrella, the title preserves core elements of the original Ragnarok series—job system, classic content, and atmospheric design—while introducing a modern art style and restructured systems that support global interaction and cooperative play. Seasonal updates will refresh status, skill building, and siege battles, offering continuous new experiences for both veteran players and newcomers.
The service will be available on iOS, Android, and PC (planned), with in‑game purchases. Distribution is managed by a consolidated subsidiary of Gravity, excluding certain regions, and preparations for the Japanese launch are underway. GungHo emphasizes its commitment to high‑quality content and global expansion, aligning with its philosophy of pursuing new challenges and product creation.
GungHo Online Entertainment, headquartered in Chiyoda‑ku, Tokyo, was founded in 1998 and reported paid‑in capital of ¥5.338 billion as of December 31, 2025. The announcement includes standard legal and trademark notices for Apple, Google, and related brands. Press inquiries are directed to GungHo’s IR group via [email protected].
- Gravity Co., Ltd. and studio DTDS will launch Ragnarok Online 3 in Japan on February 13, 2026, as a free-to-play MMORPG.
- The title will be available across iOS, Android, and PC platforms, featuring in-game purchases and a business model focused on seasonal content updates.
- GungHo Online Entertainment will publish the game, which retains core series elements like the job system and atmospheric design while introducing a modernized art style.
- The game is designed to support global interaction and cooperative play through restructured systems and recurring updates to skills, status, and siege battles.
- Distribution is managed by a consolidated subsidiary of Gravity, with the Japanese launch serving as a key component of GungHo’s broader global expansion strategy.
+2
GungHo Online Entertainment
Report6 pages
FY2025 Third Quarter Financial Highlights: Japan
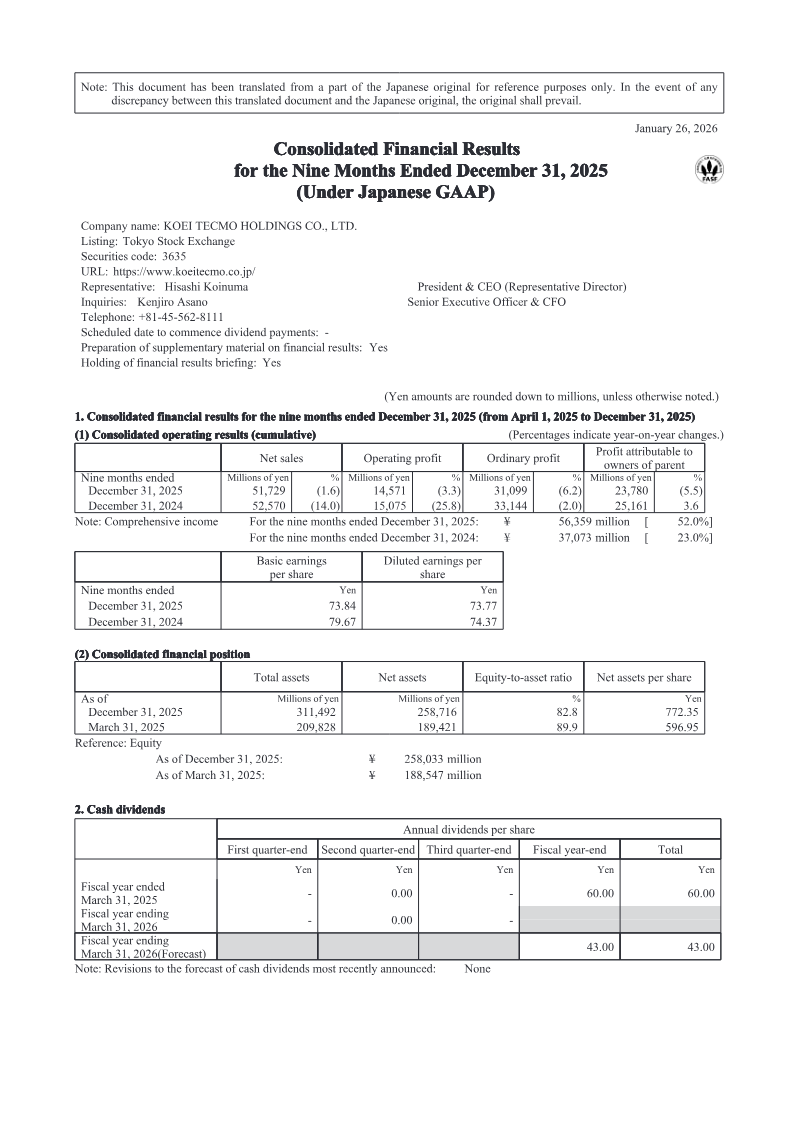
The FY2025 third‑quarter financial highlights for Koei Tecmo Holdings detail a modest decline in core operating metrics while comprehensive income rises sharply. Net sales for the nine months ended December 31, 2025 fell 1.6% to ¥51,729 million from ¥52,570 million in the prior year. Operating profit slipped 3.3% to ¥14,571 million, and ordinary profit decreased 6.2% to ¥31,099 million. Despite these contractions, comprehensive income surged 52.0% year‑on‑year to ¥56,359 million, driven by significant gains in non‑operating items such as interest income and foreign exchange gains. Basic earnings per share declined slightly to ¥73.84 from ¥79.67, reflecting a higher weighted‑average share count due to treasury share disposals and secondary offerings.
Total assets expanded from ¥209,828 million at March 31, 2025 to ¥311,492 million by December 31, 2025, largely through increases in investment securities and property, plant, and equipment. Net assets rose to ¥258,716 million, with the equity‑to‑asset ratio improving to 82.8% from 89.9%. Treasury shares reduced dramatically, lowering the average number of outstanding shares to 322 million from 315 million.
Dividend policy remains unchanged, with a forecast of ¥43.00 per share for the fiscal year ending March 31, 2026, and no revisions to cash dividend forecasts. The report covers Japan‑based operations for FY 2025, presenting consolidated quarterly financial statements without significant changes in consolidation scope or accounting policies.
- Koei Tecmo Holdings reported a 1.6% decline in net sales to ¥51,729 million and a 3.3% drop in operating profit to ¥14,571 million for the nine months ended December 31, 2025.
- Comprehensive income surged 52.0% year-on-year to ¥56,359 million, primarily fueled by non-operating gains from interest income and foreign exchange fluctuations.
- Total assets grew significantly to ¥311,492 million by December 31, 2025, up from ¥209,828 million at the start of the fiscal year, driven by increases in investment securities and property, plant, and equipment.
- Basic earnings per share fell to ¥73.84 from ¥79.67, impacted by an increase in the weighted-average share count following treasury share disposals and secondary offerings.
- The company maintains its dividend forecast at ¥43.00 per share for the fiscal year ending March 31, 2026, with no changes to its current dividend policy.
+2
Koei Tecmo

Report65 pages
Annual Report and Consolidated Financial Statements: 2020
ANNUAL REPORT AND CONSOLIDATED FINANCIAL STATEMENTS FOR THE YEAR ENDED 31 DECEMBER 2020 Strategic report 3 Highlights of the year 4 Chairman’s statement 6 History and background 7 Strategy 9 Business model 10 tinyBuild portfolio 14 Chief Executive’s ...
- tinyBuild aims for growth through both organic strategies, leveraging existing partnerships and in-house developers, and inorganic strategies, utilizing a low-risk M&A approach focused on 'acquihiring' development teams and acquiring relevant IP.
- The 'Hello Neighbor' franchise serves as a template for tinyBuild's multimedia strategy, having grown organically and through M&A, expanding into merchandise, books, and potential animated TV series, and generating over 60 million downloads for its first game.
- tinyBuild's organic growth strategy focuses on increasing the quality of its game pipeline with 23 games planned for 2021 and 2022, and accumulating IP through standard partnership agreements to extend franchise lifespans.
- The company mitigates risks associated with early-stage developer partnerships by typically providing funding at specific milestones, ensuring investments are tied to key development stages over a limited time horizon.
- tinyBuild's cash generated from operations increased from $11,732,000 in 2019 to $16,470,000 in 2020, with a net increase in cash and cash equivalents of $9,304,000 in 2020, bringing the total to $26,313,000 by year-end.
+3
tinyBuild

Report66 pages
Annual Report and Consolidated Financial Statements: 2021
ANNUAL REPORT AND CONSOLIDATED FINANCIAL STATEMENTS FOR THE YEAR ENDED 31 DECEMBER 2021 Strategic Report 3 Highlights of the year 5 Chairman’s statement 6 History and background 7 Strategy 9 Business model 11 Chief Executive’s review 16 Chief ...
- tinyBuild achieved record growth in 2021 through mergers and acquisitions and organically, and listed on the London Stock Exchange on March 9, 2021.
- The company's back catalog revenue has consistently grown, representing 51% of gaming revenue in FY17, increasing to 83% in FY19, and settling at 79% in FY21.
- tinyBuild has a strong focus on influencer marketing, having achieved over 5 billion content-related views on YouTube by December 31, 2021, and maintaining relationships with over 10,000 verified influencers.
- tinyBuild is actively relocating staff from Ukraine due to the war, setting up a temporary location in the Balkans and planning a third studio in Western Europe to assist with relocation and visa processes.
- The company has a policy against 'crunching' and provided an extra week of holiday to all direct employees in 2021 as appreciation for their work during the pandemic.
+3
tinyBuild

Report70 pages
Annual Report and Consolidated Financial Statements 2024
ANNUAL REPORT AND CONSOLIDATED FINANCIAL STATEMENTS FOR THE YEAR ENDED Chairman’s statement 4 History and background 5 Strategy 7 Business model 9 Chief Executive’s review 14 Chief Financial Officer’s review 16 Environmental, social and governance (ESG) 18 Principal risks and uncertainties ...
- tinyBuild experienced a significant decline in revenue and continued operating losses in 2024, with revenue dropping by 22% year-over-year to $34.7 million (from $44.7 million in 2023) and an operating loss of $20.4 million (compared to $63.8 million in 2023).
- The revenue decline was primarily due to limited flow-through from new games released in 2023 and a 50% drop in development revenues, largely from platform deals.
- Adjusted EBITDA remained negative at -$3.681 million in 2024, an improvement from -$7.113 million in 2023, impacted by revenue decline and a $13.7 million impairment of software development costs.
- tinyBuild raised over $11 million in new capital in January 2024 and welcomed Atari as a new core investor, helping to fund promising projects.
- The company maintains an organic growth strategy focusing on diversification, internal development teams (e.g., DUCKSIDE), established partnerships (e.g., Potion Craft), and leveraging influencer relationships for marketing, achieving over 5 billion content-related views on YouTube by December 31, 2024.
+2
tinyBuild
Report69 pages
Raport Roczny 2011: 11 bit studios
I.! PISMO ZARZĄDU ........................................................................................................... 3! II.! WYBRANE JEDNOSTKOWE DANE FINANSOWE ZAWIERAJĄCE PODSTAWOWE POZYCJE ROCZNEGO SPRAWOZDANIA FINANSOWEGO WRAZ Z DANYMI PORÓWNYWALNYMI ............... 4! III.! SPRAWOZDANIE FINANSOWE ZA ROK 201111 BIT STUDIOS S.A. .......................................
- 11 bit studios S.A. experienced significant financial growth in 2011, achieving a net profit of 1,292,777.32 PLN, a substantial improvement from a net loss of 231,199.53 PLN in 2010.
- The company's revenue from sales increased dramatically by 544.4% from 474,038.19 PLN in 2010 to 3,054,721.58 PLN in 2011.
- Total operating costs increased by 110.4% from 757,807.86 PLN in 2010 to 1,594,533.17 PLN in 2011.
- Share capital was increased on November 10, 2011, through the issuance of up to 500,000 Series D ordinary bearer shares, each with a nominal value of 0.10 PLN, raising the capital from 187,076.10 PLN to a maximum of 237,076.10 PLN.
- 11 bit studios S.A. continued work on versions of the game "Anomaly Warzone Earth" for additional hardware platforms in 2011, with plans to complete and launch sales in 2012, alongside building new game development teams.
+1
11 bit studios
Report67 pages
Annual Report 2014: 11 bit studios S.A.
I. PISMO ZARZĄDU ........................................................................................................3 II. WYBRANE JEDNOSTKOWE DANE FINANSOWE ZAWIERAJĄCE PODSTAWOWE POZYCJE ROCZNEGO SPRAWOZDANIA FINANSOWEGO WRAZ Z DANYMI PORÓWNYWALNYMI...........4 III. SPRAWOZDANIE FINANSOWE 11 BIT STUDIOS S.A. ZA ROK 2014 ...................................5 IV. SPRAWOZDANIE ZARZĄDU Z DZIAŁALNOŚCI SPÓŁKI W ROKU 2014. ............................. 40 V.
- 11 bit studios S.A. released "This War of Mine" in 2014, a milestone game developed in-house, and also launched "Spacecom" through its 11 bit launchpad publishing division.
- The company's total assets significantly increased from 589,514.42 PLN in 2013 to 1,745,563.16 PLN in 2014, driven by growth in intangible assets (from 466,671.58 PLN to 1,444,226.03 PLN) and tangible assets (from 63,180.84 PLN to 103,579.73 PLN).
- Net profit for 2014 was 890,745.75 PLN, a substantial increase from the previous year, with operating profit at 1,248,589.34 PLN.
- 11 bit studios S.A. generates most of its revenue in foreign currencies (primarily USD), meaning a weaker Polish Zloty positively impacts its income.
- The company faces risks including strong competition from other publishers, increasing competition in the game market, the risk of ideas being copied, and the challenge of keeping up with dynamic market trends like Virtual Reality (VR).
+3
11 bit studios
Report74 pages
Annual Report 2017: 11 bit studios
2.2. SPRAWOZDANIE Z SYTUACJI FINANSOWEJ (PLN) AKTYWA PISMO ZARZĄDU Nota Stan na Stan na 31.12.2017 31.12.2016 Aktywa trwate Warszawa, 26 marca 2018 roku Rzeczowe aktywa trwate 3.11. 814 332 779 540 Szanowni Akcjonariusze i Inwestorzy 3.12.
- 11 bit studios S.A. focused heavily on "Frostpunk" in 2017, anticipating it will drive financial results for years, with its release scheduled for April 24, 2018.
- The company continued developing "This War of Mine" in 2017, releasing the "Fathers Promise" DLC on November 14, with two more "TWoM: Stories" DLCs planned for 2018. They also began work on a new game, "Projekt 8," involving a 20-person team, to be released after "Frostpunk."
- 11 bit publishing released two external games in 2017: "Beat Cop" (March 30) and "Tower 57" (November 16), with external game sales contributing over 10% to total revenue and recouping investment within months.
- Operating profit for 2017 was 7,619,936 PLN, a 50.69% decrease from 15,454,560 PLN in 2016, despite a 5.64% increase in operating costs to 11,845,351 PLN (from 11,212,540 PLN in 2016) and increased promotional spending.
- 11 bit studios S.A. sold its 100% stake in subsidiary Games Republic Limited to Lousva Trading Limited on April 11, 2017, dissolving the 11 bit studios S.A. Capital Group.
+3
11 bit studios
Report127 pages
Annual Report: 11 Bit Studios S.A. 2024
ANNUAL REPORT OF 11 BIT STUDIOS S.A. FOR 2024 (all amounts in PLN unless stated otherwise) DEAR SHAREHOLDERS AND INVESTORS, It is with great pleasure that we present to you our Annual Report for 2024. During this period, 11 bit studios S.A. generated revenue of PLN 140.54 million, marking a 168.9% increase year on year and representing an all-time record for the Company.
- 11 Bit Studios S.A. is a computer game developer and publisher, with Frostpunk 2 (PC version) being a major recent success, selling 350,000 copies within three days of its September 20, 2024 launch and reaching 592,000 total unit sales by the end of 2024.
- The company's equity has grown significantly, from PLN 42.13 million in 2017 to PLN 229.92 million in 2024, reflecting a higher net profit in 2024 compared to 2023.
- Cash resources increased by 29.56% to PLN 70,463,596 at the end of 2024, up from PLN 54,386,466 in 2023, and total financial assets reached PLN 91,543,938.
- Total liabilities increased by 3.59% to PLN 32,384,084 in 2024, with current liabilities rising 12.66% to PLN 27,830,893, including PLN 11,002,109 in contract liabilities for future game sales and DLCs.
- The company has a multi-purpose credit facility of PLN 20,000,000 with PKO BP S.A. until June 25, 2025, which had no drawdowns as of the reporting date, and an investment credit facility with PKO BP S.A. of PLN 5,040,000 outstanding as of December 31, 2024.
+4
11 bit studios
Report27 pages
Quarterly Report of 11 Bit Studios S.A.: Q1 2019
portfolio of proprietary games) is expected to help stabilise the Company's financial results, which in the video games industry are typically highly volatile. The Company's revenue sources should also be considerably impacted by further development of its publishing division (11 bit publishing), which in 2018, driven primarily by the very successful release of Moonlighter, contributed 18% of the LETTER FROM THE MANAGEMENT BOARD ...
- 11 bit studios S.A. experienced a significant revenue increase of nearly 632% in Q1 2019 compared to Q1 2018, reaching PLN 14,183,796, primarily driven by strong sales of Frostpunk and This War of Mine.
- Operating expenses rose by 267.5% to PLN 8,524,924 in Q1 2019 (from PLN 3,186,555 in Q1 2018), with major items being salaries and wages (PLN 3,306,961), services (PLN 3,367,572, including Moonlighter royalties), and a non-cash provision for the Incentive Scheme (over PLN 2.05m).
- The company's publishing division, 11 bit publishing, contributed 18% of total revenue in 2018, largely due to the successful release of Moonlighter, and is expected to considerably impact future revenue.
- The porting of Beat Cop to PS4, Xbox One, Nintendo Switch, iOS, and Android, released in Q1 2019, proved profitable and supported the company's financial performance.
- 11 bit studios S.A. aims to stabilize its typically volatile financial results through its portfolio of proprietary games and plans to launch third-party games every quarter through its publishing arm.
+2
11 bit studios
Report49 pages
Semi-Annual Report of 11 bit studios S.A. for H1 2018
LETTER FROM THE MANAGEMENT BOARD LETTER FROM THE MANAGEMENT BOARD Dear Shareholders and Investors Dear Shareholders and Investors It is our great pleasure to present to you the half-year report of 11 bit studios S.A. for the first half of 2018. It was a Property, plant and equipment 3.9 715,168 814,332 very important period for our Company.
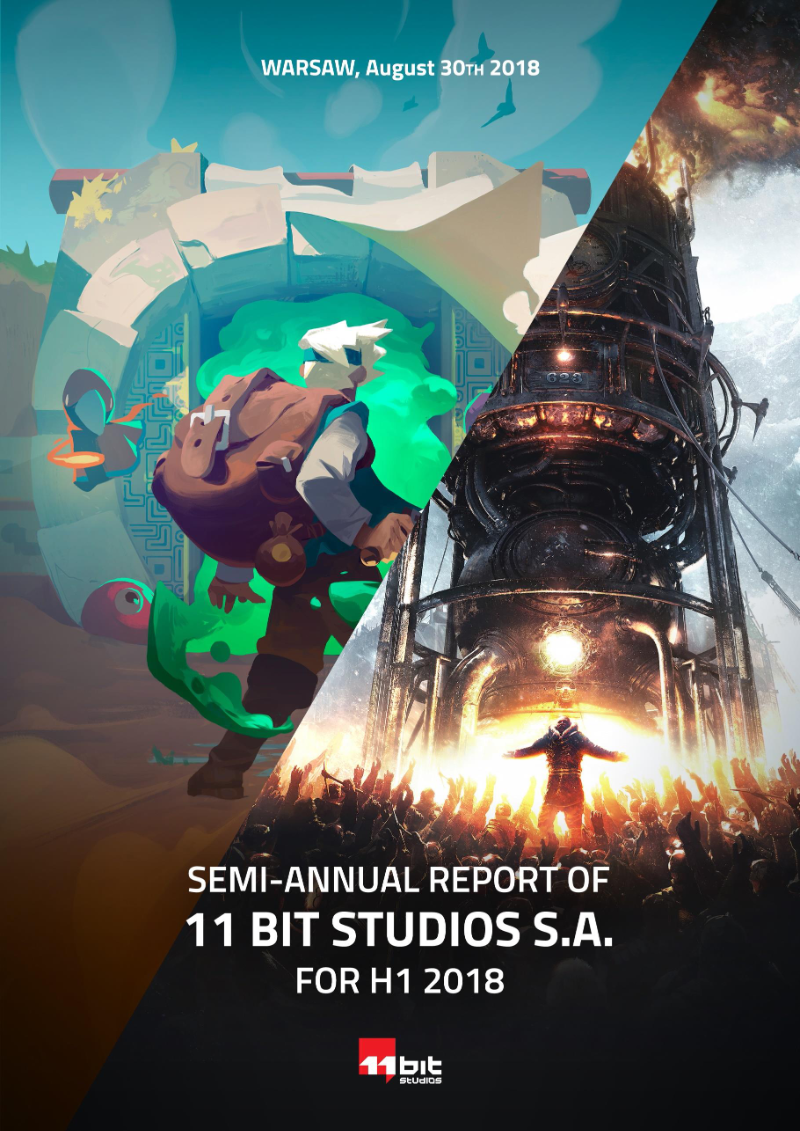
- 11 bit studios S.A. released Frostpunk in H1 2018, its largest and most expensive game to date, selling 250,000 copies in 66 hours and covering development costs. The company expects Frostpunk to be a significant revenue source for multiple quarters.
- The company's revenue increased by 427.4% in H1 2018 compared to H1 2017, driven by the successful launches of Frostpunk (April 24, 2018) and the published title Moonlighter (May 29, 2018).
- Moonlighter, a game published by 11 bit studios S.A., became a bestseller on Steam, demonstrating the company's strong publishing capabilities for independent developers. A Nintendo Switch version of Moonlighter is planned for later in 2018.
- 11 bit studios S.A. plans to continue supporting This War of Mine with two more add-ons and a Nintendo Switch release by the end of 2018, and Beat Cop will also launch on PS4 and Nintendo Switch by year-end.
- The company is developing a new game, 'Project 8,' which is in an advanced prototype stage, aiming for a team size and budget comparable to Frostpunk. In the medium term, 11 bit studios S.A. plans to have at least three comparable development teams to increase release frequency and stabilize financial results.
+3
11 bit studios