Global reports and market data
Documents

State of Mobile 2025: Why Community Wins on Mobile
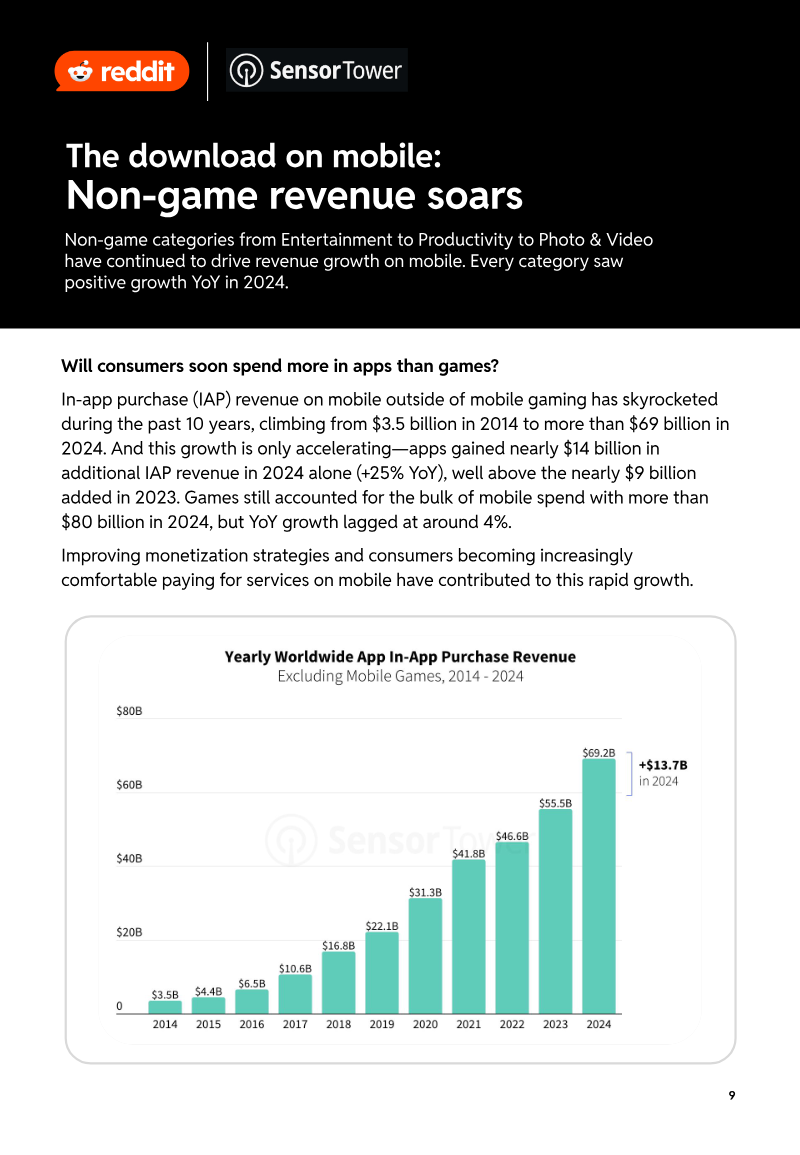
The State of Mobile 2025 report examines the current mobile ecosystem, emphasizing how community engagement—particularly on Reddit—drives sustained app growth.
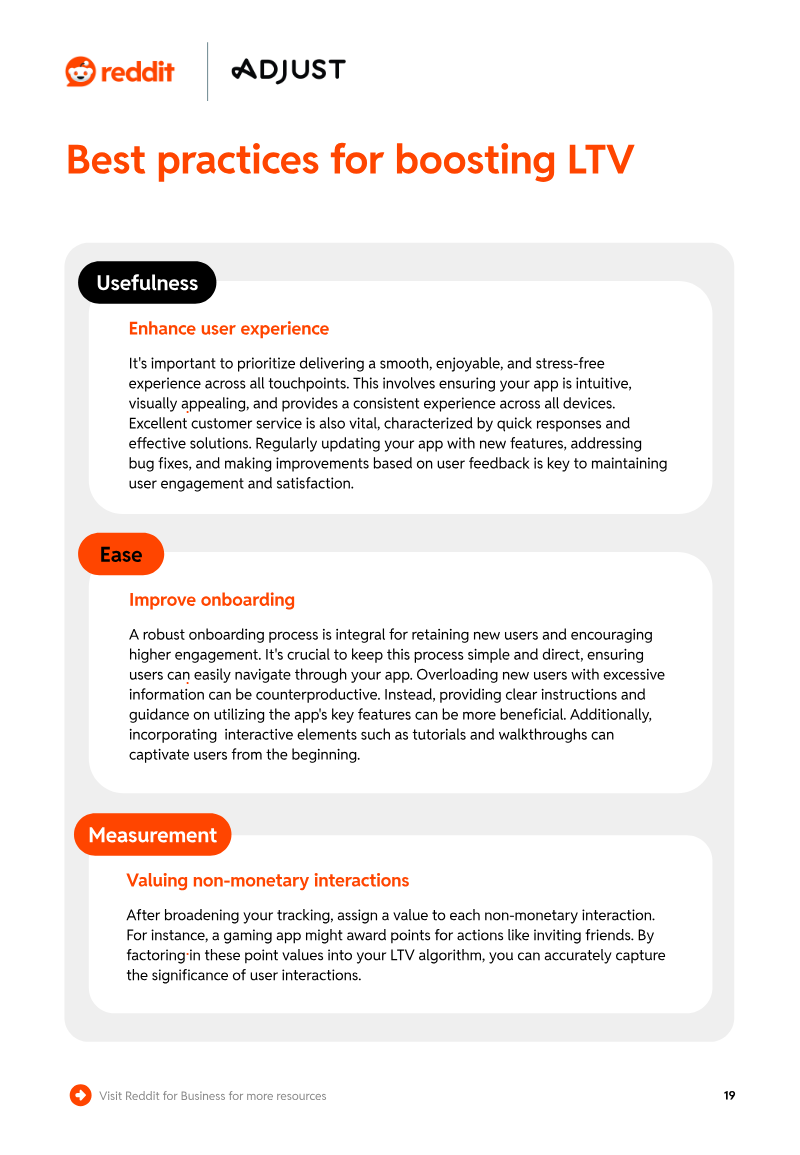
- Reddit-acquired users demonstrate significantly higher lifetime value, with 41% higher Day-1 spend than other social platforms and 159% higher than digital media.
- Reddit users exhibit superior long-term retention and engagement, spending 55% more time in-app on Day 1 and 103% more by Day 30 compared to other channels.
- Global mobile in-app purchase revenue reached $150 billion in 2024, representing a 13% year-over-year increase, while total usage hit 4.2 trillion hours.


Where the UGC Dollars Flow: Mapping $9B Investments in Creator Economy
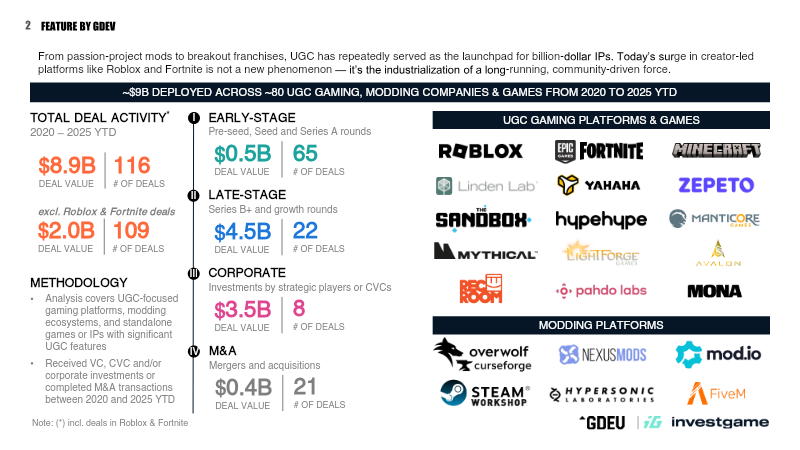
The analysis maps a $9 billion investment wave in user-generated content (UGC) gaming from 2020 to 2025, covering roughly 80 companies and titles.
- The UGC gaming sector attracted $9 billion in total investment between 2020 and 2025, with $8.9 billion concentrated in late-stage and corporate deals.
- Strategic investment from industry incumbents is a primary driver, highlighted by Sony/Kirkbi’s $2 billion commitment in 2022 and Disney’s $1.5 billion investment in 2024.
- Creator monetization is scaling rapidly, with Roblox and Fortnite collectively disbursing approximately $1.5 billion to developers in 2024 and reporting a 38% quarterly earnings increase between Q2 and Q3 2023.

Game Data: Building vs Buying
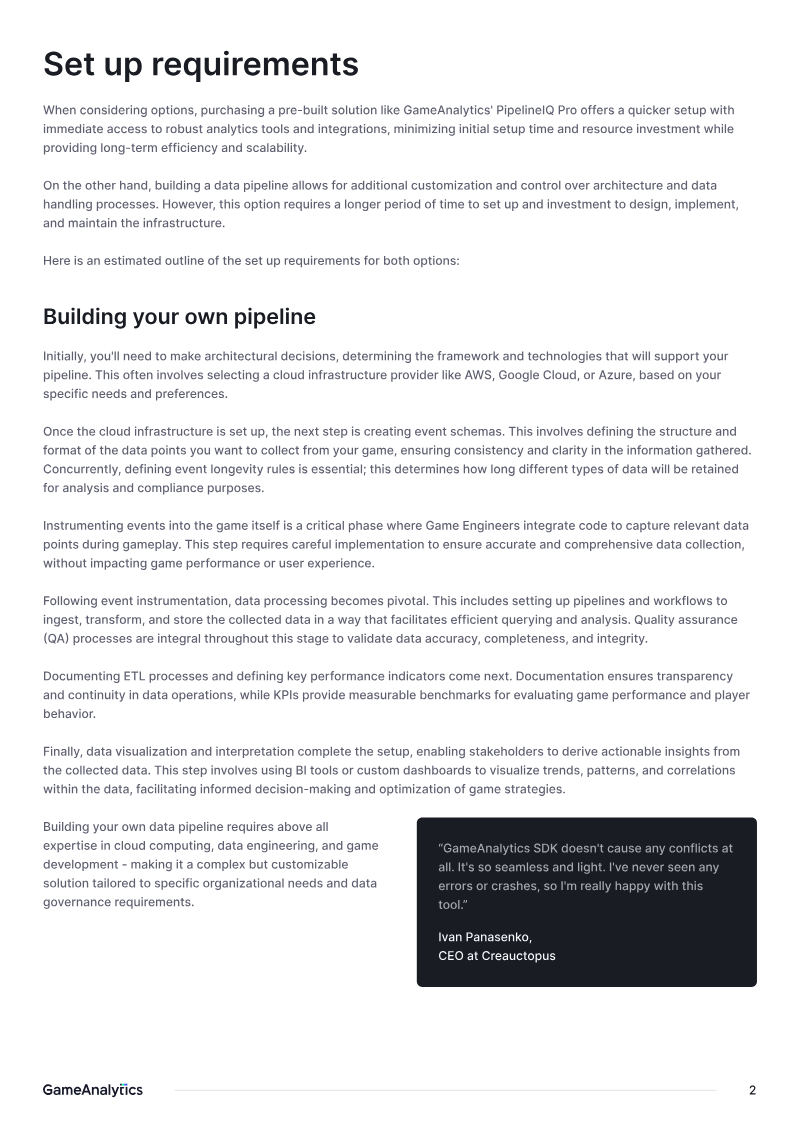
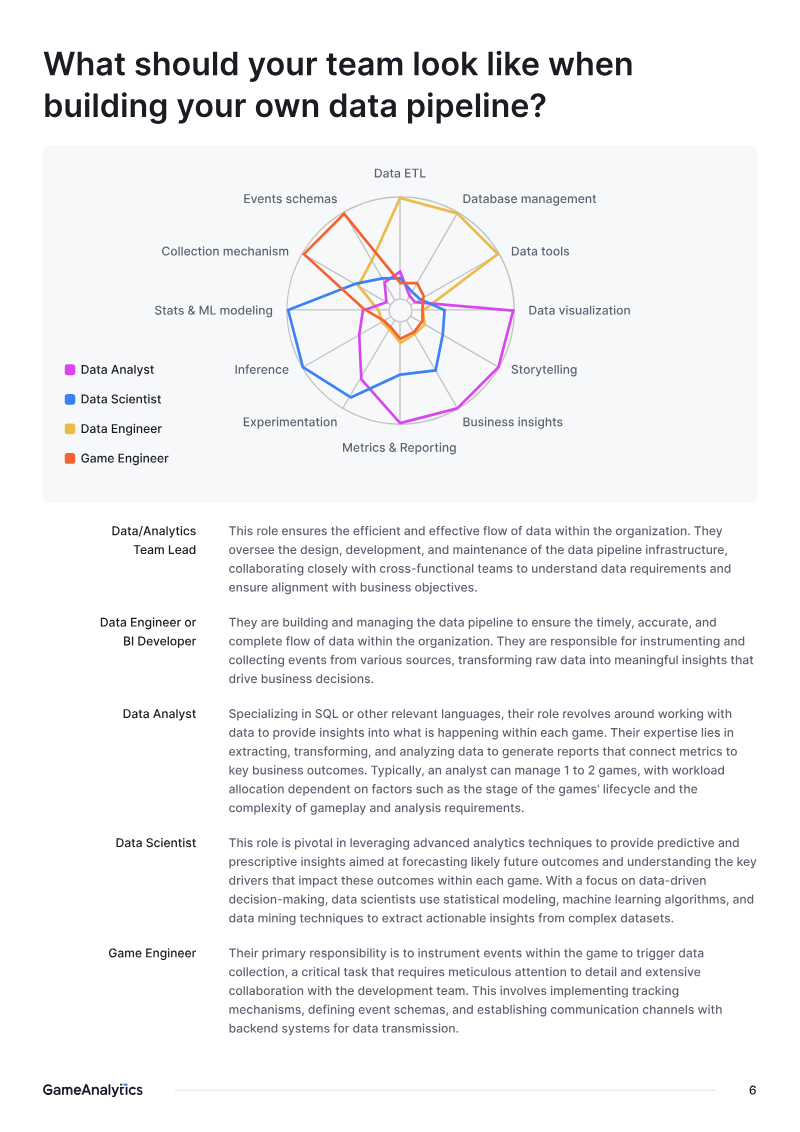
The document evaluates the trade-offs between building an in-house data pipeline and purchasing a third-party solution for game analytics, using GameAnalytics’ PipelineIQ Pro as the primary example.
- Building an in-house data pipeline for a studio with 5 million MAU costs approximately $50,000 per month, compared to $5,900 per month for a third-party solution like GameAnalytics’ PipelineIQ Pro.
- Human capital is the primary cost driver for both approaches, accounting for 89% of the budget for in-house builds and 78% for vendor-managed pipelines.
- Third-party solutions offer significantly faster deployment timelines, ranging from hours to days, whereas custom in-house pipelines typically require months to implement.

Game Analytics 100: The Retention Curve
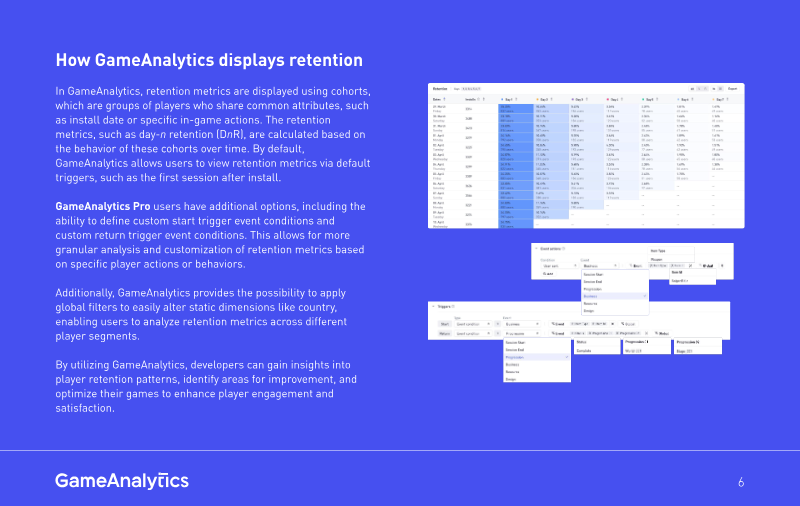
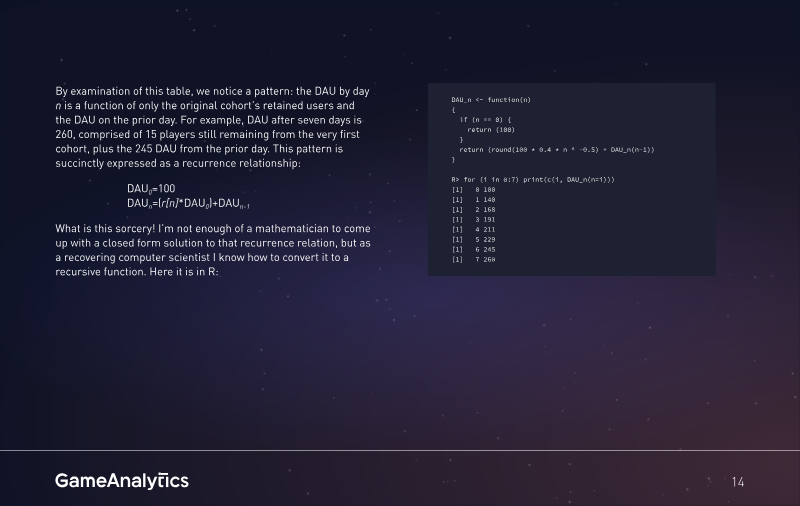
The analysis demonstrates that player retention in mobile games can be accurately modeled with a power-law curve, expressed either as \(r(n)=a\,b^n\) or \(r(n)=a\,n^{b}\).
- Mobile game retention follows a predictable power-law curve, modeled as r(n)=an^b, which allows analysts to forecast long-term player behavior using only day-1, day-3, and day-7 cohort data.
- Fitting retention curves enables precise lifetime value (LTV) projections; for example, an average revenue of $1.00 per daily active user results in an LTV90 of 7.65 and an LTV180 of 10.17.
- Analysts can derive the initial retention level (a) and decay exponent (b) by applying the LINEST function to logged cohort values in Excel, yielding representative curves such as r(n)=0.396n^-0.472.
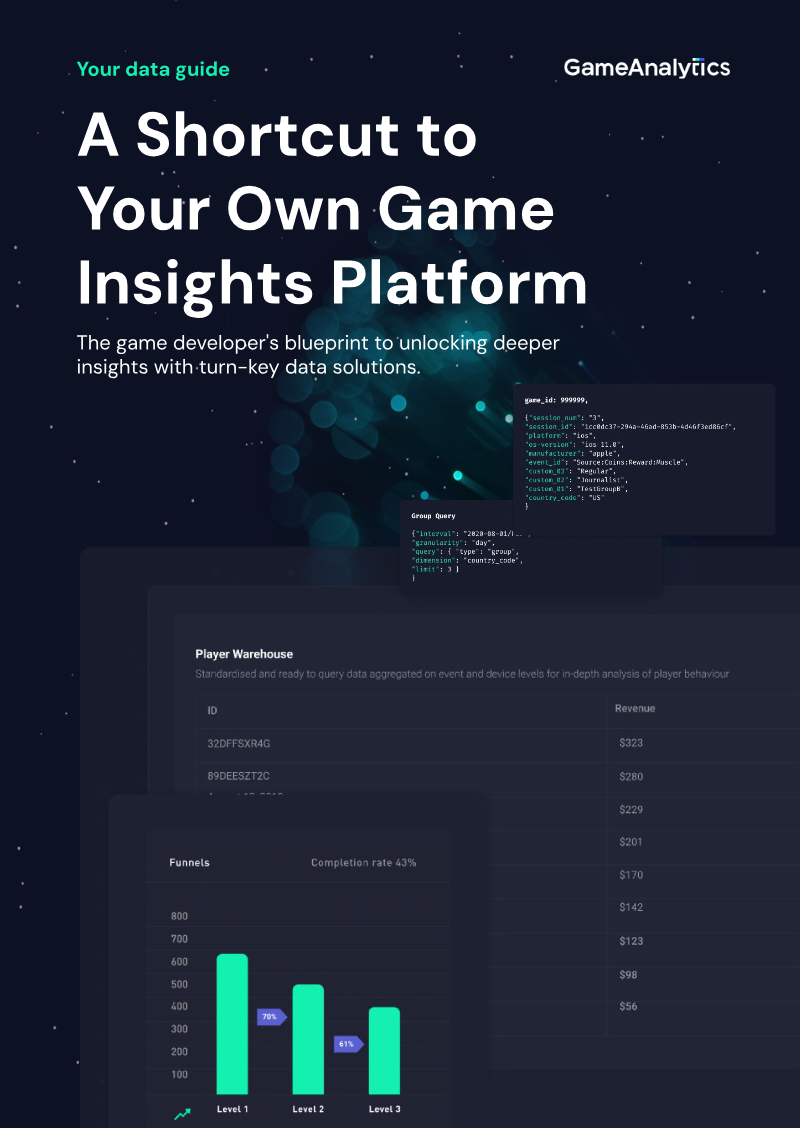
A Shortcut to Your Own Game Insights Platform
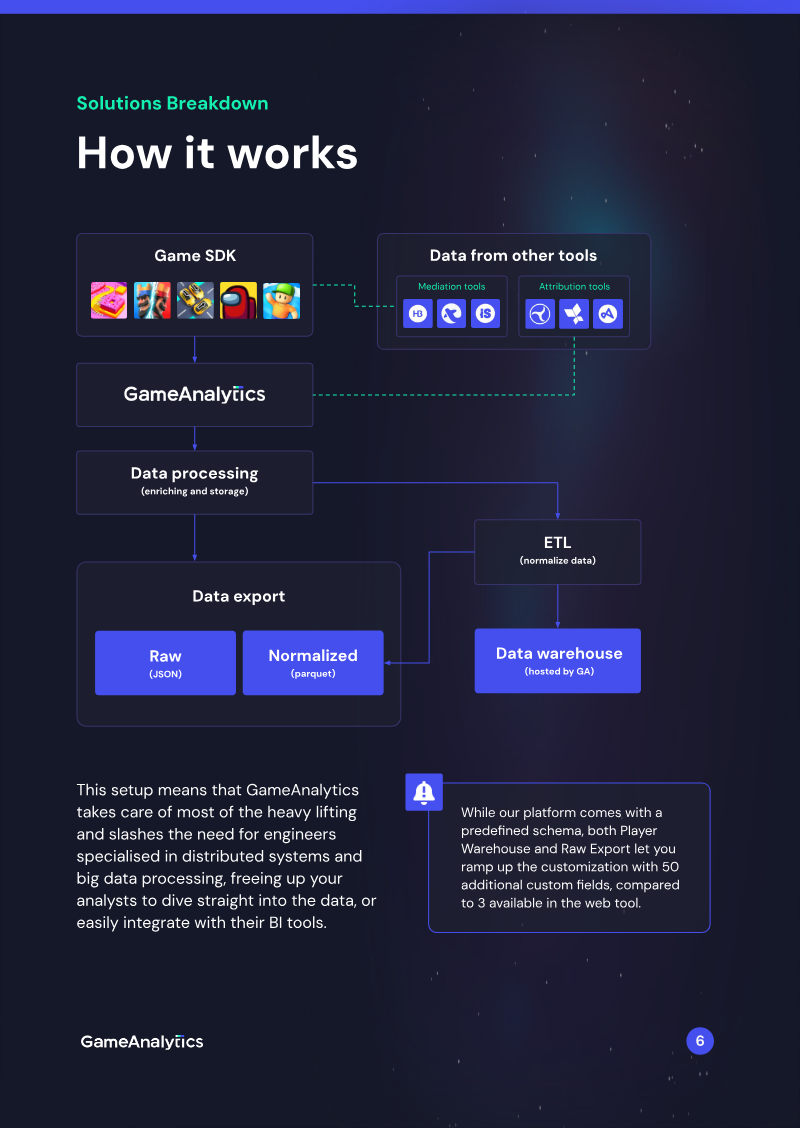
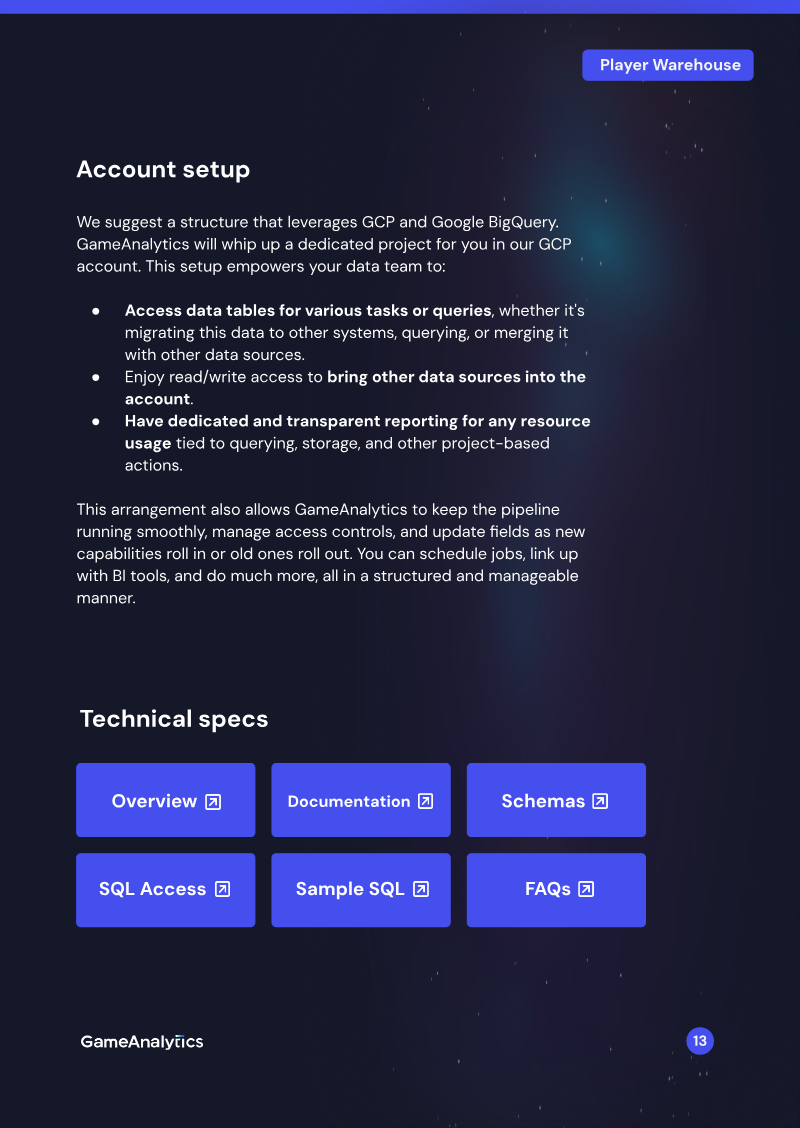
The guide presents a turnkey solution for game studios to build an in-house data pipeline without the high costs of custom engineering.
- GameAnalytics provides a turnkey data pipeline that eliminates the need for custom ETL development, proprietary SDKs, and ongoing infrastructure maintenance.
- The platform offers two primary data delivery methods: Player Warehouse for daily refreshed, SQL-ready event tables and Raw Export for real-time JSON streaming.
- A publisher utilizing Raw Export achieved a 50% increase in lifetime value (LTV) across 19 titles, while a VR MMO leveraged Player Warehouse to improve player engagement.


Your Data Tracking Plan: A Step-by-Step Guide for GameAnalytics
GameAnalytics presents a structured framework for designing and implementing data tracking within games, emphasizing the creation of a comprehensive tracking plan that aligns analytics teams with development stakeholders.
- Establish a structured tracking plan by aligning business objectives and player behavior questions with seven predefined event categories: Session, Business, Resource, Progression, Error, Ads, and Impression.
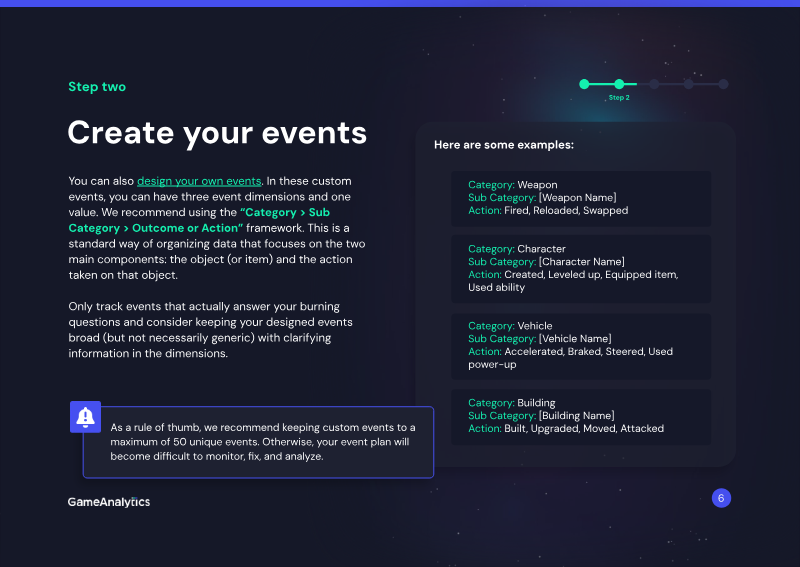
- Limit custom events to a maximum of 50 unique identifiers to maintain data integrity and prevent system clutter.
- Adopt a consistent Category > Sub-Action naming framework to ensure clarity and prevent redundant or misleading data collection.
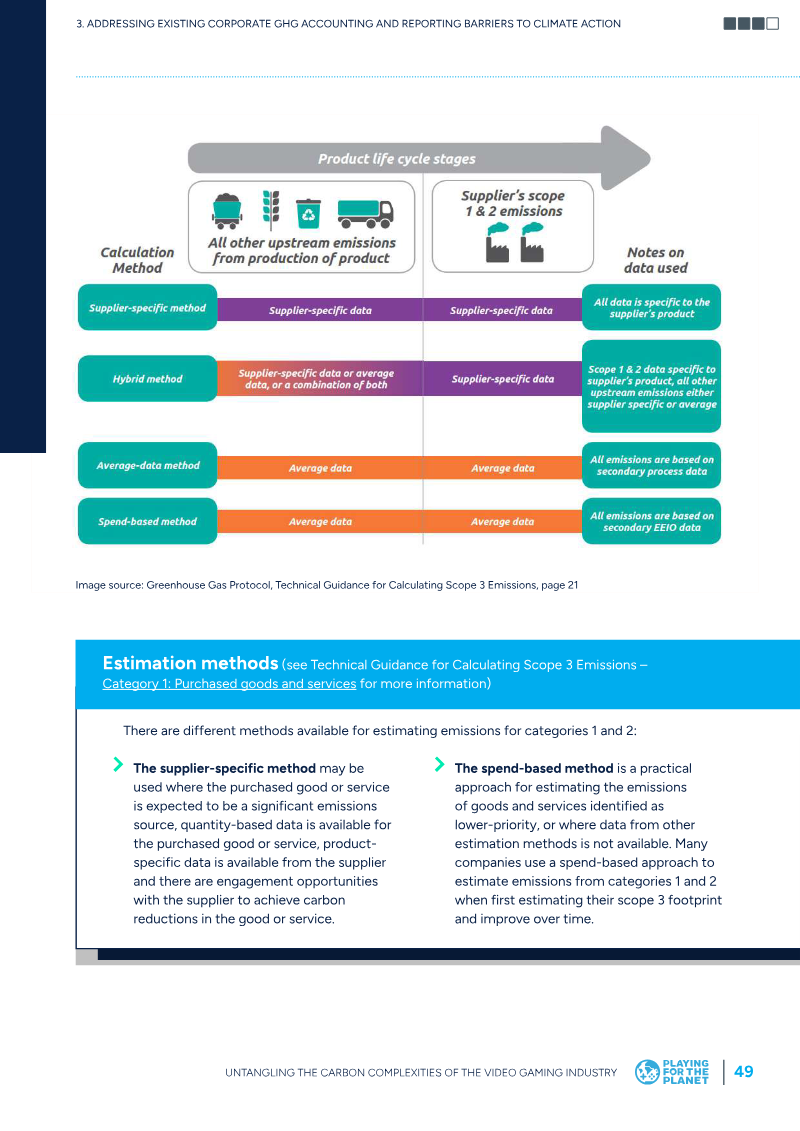

Playing for the Planet: Untangling the Carbon Complexities of the Video Gaming Industry
The analysis demonstrates that the video-gaming sector remains fragmented in its approach to carbon accounting, with only a minority of companies—12 out of 222 surveyed—committed to science-based targets.
- Only 12 out of 222 surveyed gaming companies have committed to science-based carbon reduction targets, highlighting a significant industry-wide gap in formal climate accountability.
- Scope 3 emissions—specifically purchased goods (Category 1) and the use of sold products (Category 11)—represent the dominant share of the industry's total carbon footprint.
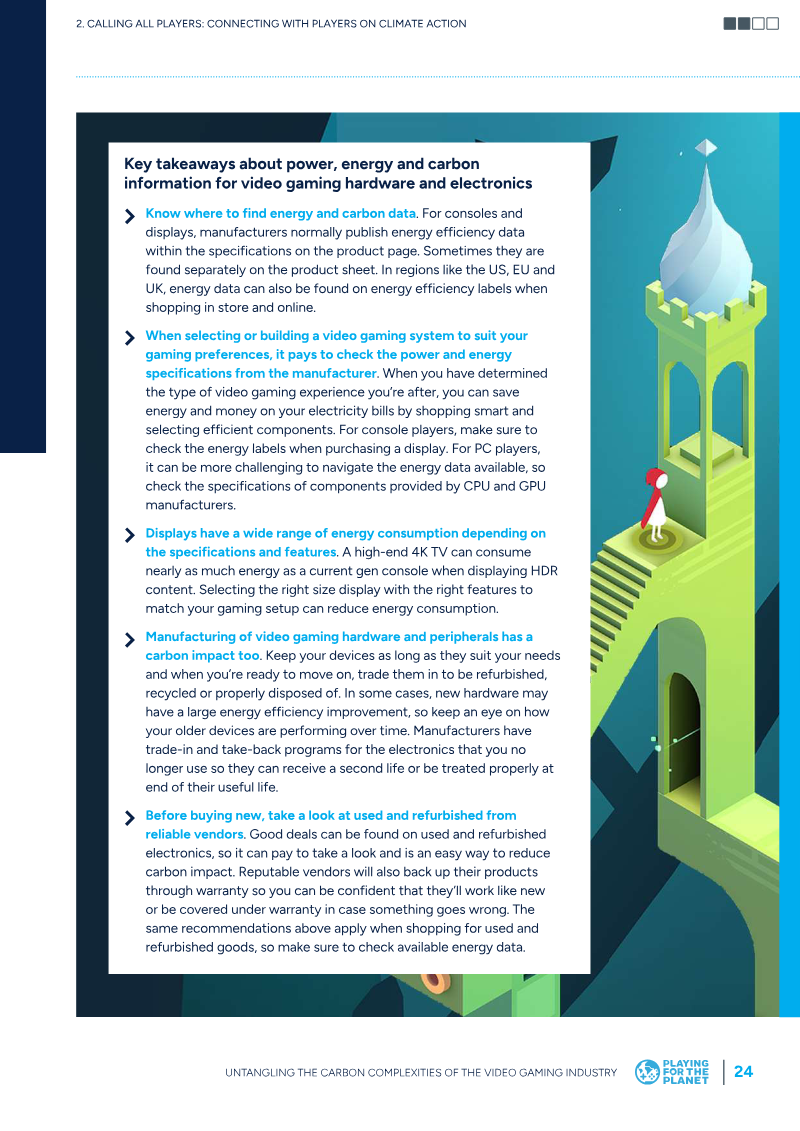
- Energy consumption during gameplay varies significantly by hardware, with current-generation consoles drawing 150–200W and PCs reaching up to 300W, compared to only a few watts for mobile devices.
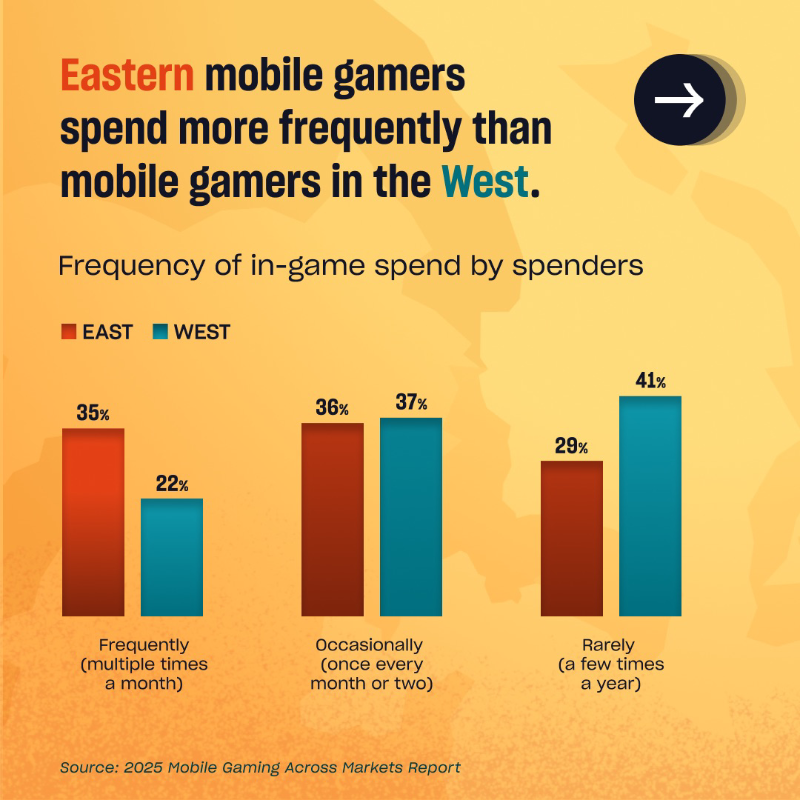
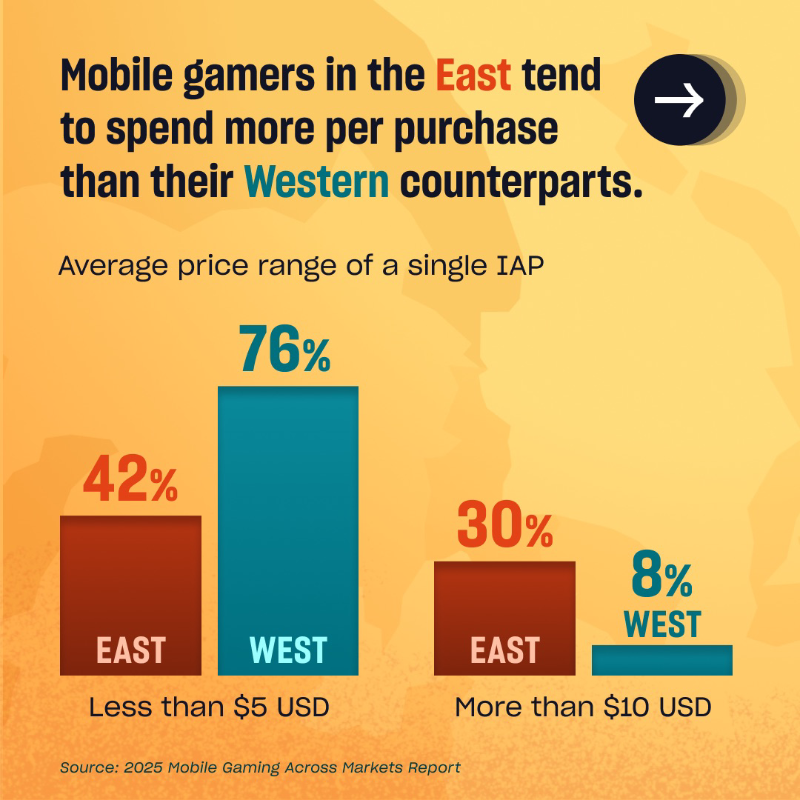

East vs. West: Monetization Trends
Mobile gaming monetization strategies reveal distinct behavioral patterns between Eastern and Western markets, driven by differing consumer motivations and spending habits.
- Eastern mobile gamers demonstrate a significantly higher propensity for large transactions, with 76% of purchases exceeding $10 compared to only 42% in Western markets.
- Western mobile gamers are more likely to make small-scale purchases, with 8% of spenders in the West opting for transactions under $5, contrasted with 30% in the East.
- Monetization strategies in the West should prioritize value-based bundles, as these resonate more effectively with the purchasing preferences of Western players.



Oświadczenie dotyczące zrównoważonego rozwoju: Polska 2025
The statement establishes MTG’s commitment to a comprehensive sustainability agenda for 2025, integrating environmental stewardship, social responsibility and robust governance across its entire value chain.
- MTG has committed to a 46.2% reduction in Scope 1–2 greenhouse gas emissions by 2031, with a 2030 target of a 40% cut in Scopes 1–2 and 25% in Scope 3 against a 2024 baseline.
- Executive accountability is reinforced by linking 5% of executive pay to ESG performance outcomes, overseen by a board committee with 29% female representation.
- The company aims to increase its S&P Global CSA score by 20 points by 2027 while aligning its decarbonization roadmap with the EU Fit for 55 framework.
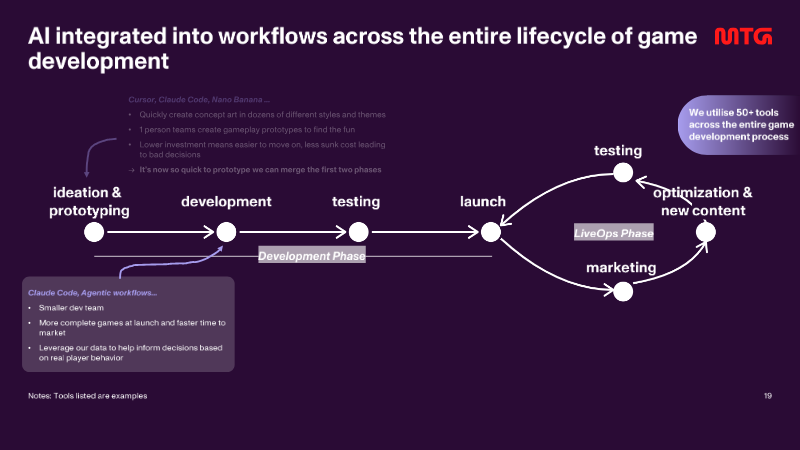

AI in MTG: Moving Beyond Theory
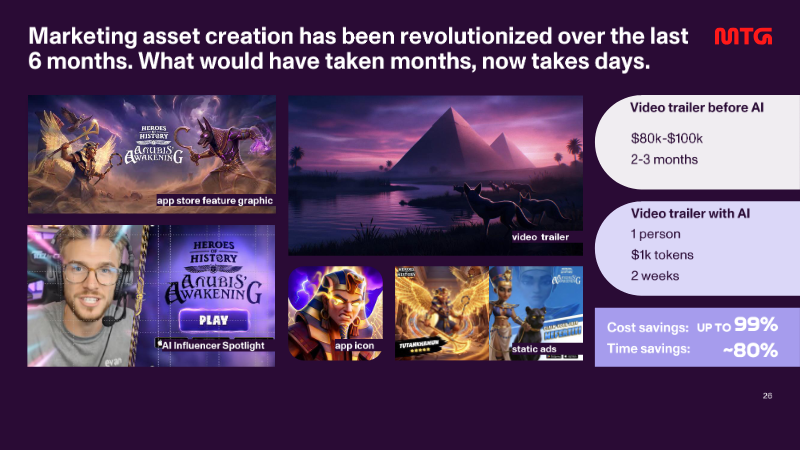
The document argues that artificial intelligence has become a strategic asset in mobile game development, transforming every phase of the lifecycle from ideation to live operations.
- Adopting an 'AI-first' development approach enabled the launch of five new mobile games in 2026, facilitating rapid iteration and simultaneous production of specialized content.
- AI integration has achieved significant operational efficiencies, including a 99% reduction in marketing asset costs and an 80% time saving on influencer spotlight production.
- Data analysis turnaround times have been reduced by 75% by utilizing AI agents to query large-scale datasets, allowing analysts to focus on high-level strategy.



Gamer Motivation Profile: Empirical Research and Data Insights
The Gamer Motivation Profile provides a comprehensive empirical framework for understanding player behavior through a psychometric model that categorizes gaming preferences into twelve distinct motivational drivers.
- The Gamer Motivation Profile utilizes a dataset of over 1.75 million global participants to categorize player behavior into twelve distinct motivational drivers across six primary clusters.
- The psychometric model employs factor analysis to link player demographics, such as age and gender, with specific gaming preferences to enable precise audience segmentation.
- Developers can use the framework to compare individual game franchises against broader genre benchmarks to identify how specific titles deviate from industry norms.
Gamer Motivation Profile: Empirical Research Methodology
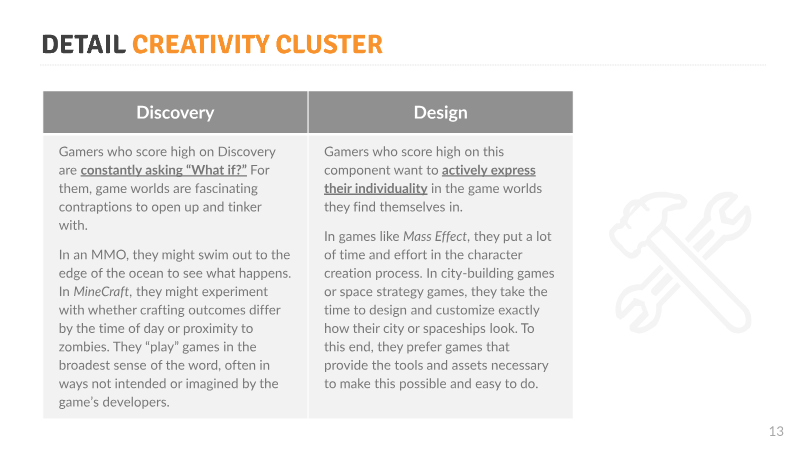
The Gamer Motivation Profile provides an empirical framework for understanding player behavior by categorizing gaming preferences into twelve distinct motivational factors.
- The Gamer Motivation Profile categorizes player behavior into twelve distinct factors grouped into six thematic clusters: Action-Social, Mastery-Achievement, and Immersion-Creativity.
- The model is built on a global dataset of over 1.25 million unique gamers, providing a statistically significant foundation for analyzing player engagement.
- The participant demographic is 74% male, 22% female, and 3% non-binary, with a median age of 23 and a primary geographic concentration in North America (33%) and Western Europe (14%).