Mobile reports and market data
Documents
The State of Payment Apps: An Analysis of Payment App Market Trends and Top Apps in the U.S.
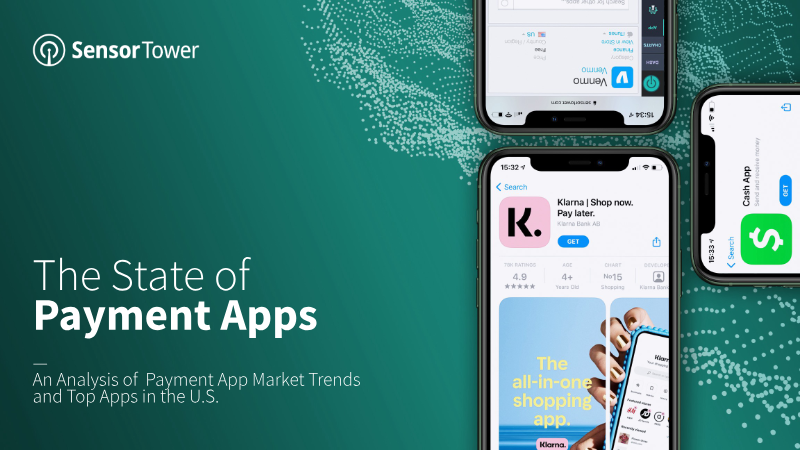
Sensor Tower's report analyzes payment apps available on the U.S. App Store and Google Play, covering download trends and rankings of top apps from Q1 2018 through Q1 2021.
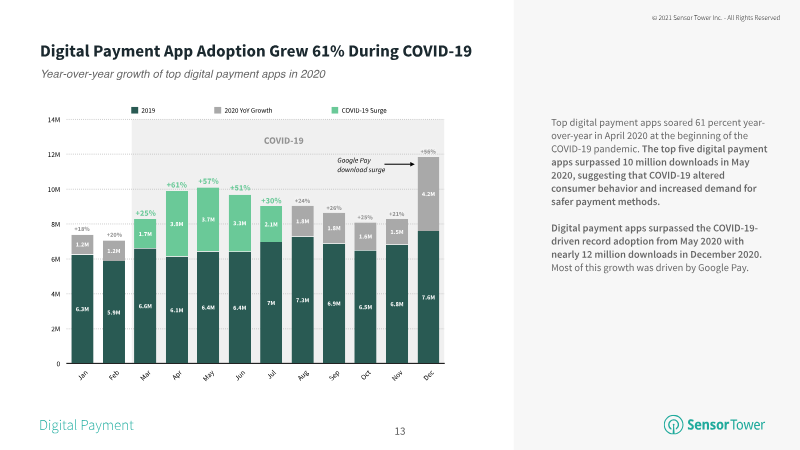
- Top digital payment and money transfer apps reached a peak of 35 million U.S. installs in Q2 2020. The document links this to the beginning of the pandemic and the first federal stimulus checks.
- Cash App accounted for 30 percent of the market share among top digital payment apps in Q1 2021, though this share decreased year-over-year.
- Google Pay's market share among top digital payment apps climbed to 19 percent in Q1 2021, up from 8 percent in 2020.

2023 Casual Gaming Apps Report
Liftoff's 2023 Casual Gaming Apps Report, compiled with GameRefinery and based on data from Accelerate, Liftoff's programmatic advertising solution, covers casual gaming apps for the period February 1, 2022 to February 1, 2023.
- Casual games were the source of 86.9% of gaming installs across categories, far ahead of sports & driving at 6.6%.
- Simulation games had the lowest user acquisition cost, at $0.59 per install, while lifestyle players cost over twice as much at $1.32.
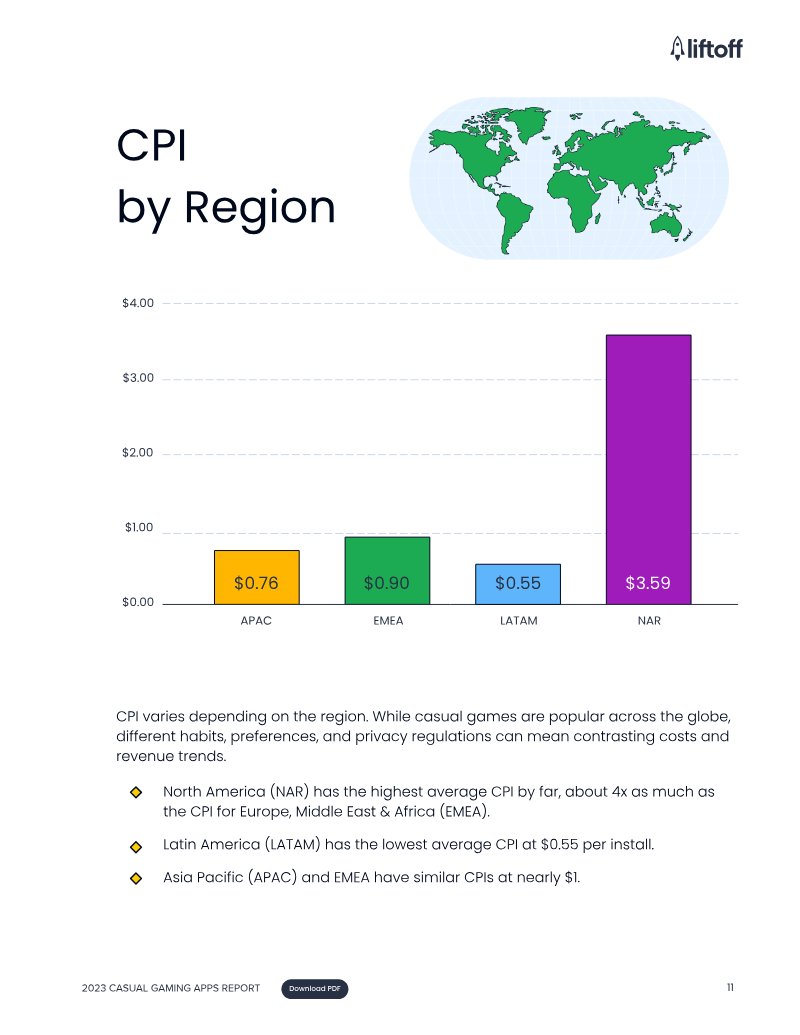
- Android had an average CPI of $0.63, while acquiring iOS users cost $2.23 per install, over three times as much.

Gaming Spotlight 2023 Review
This document is data.ai and IDC's Gaming Spotlight 2023 review of the games market.
- Mobile game consumer spend is forecast to reach $108 billion in 2023, a slight 2% decline year-over-year.
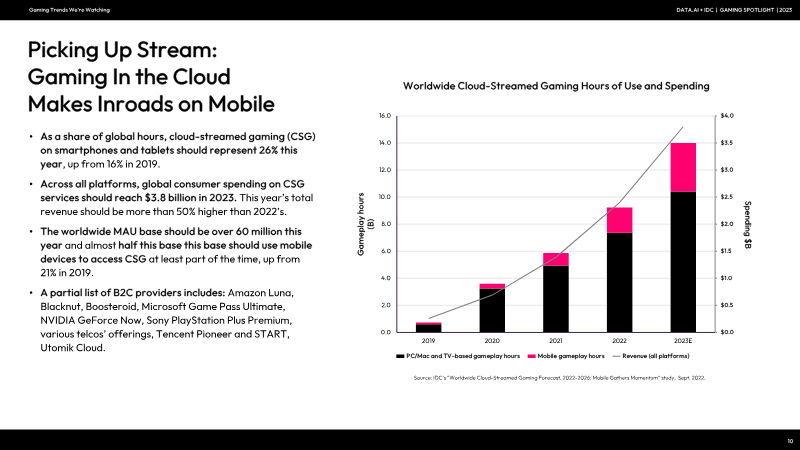
- Cloud-streamed gaming on smartphones and tablets is forecast to represent 26% of global hours in 2023, up from 16% in 2019.
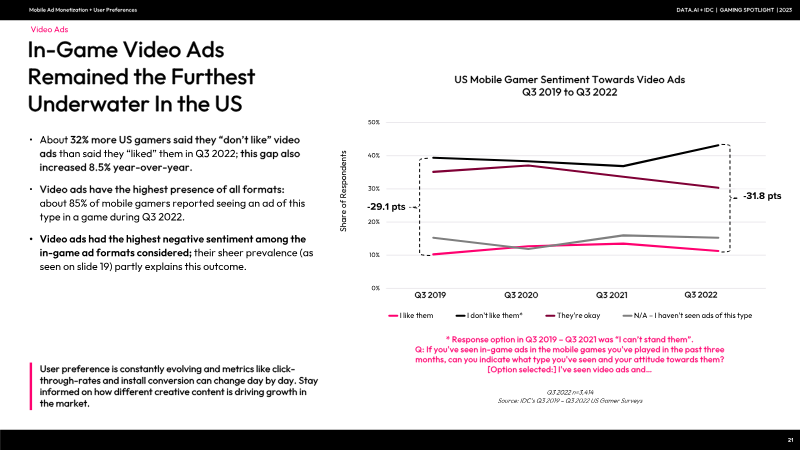
- About 24% more US gamers said they “don't like” banner/display ads than those who said they “liked” them in Q3 2022.
2023 Liftoff Company Midcore Gaming Apps Report
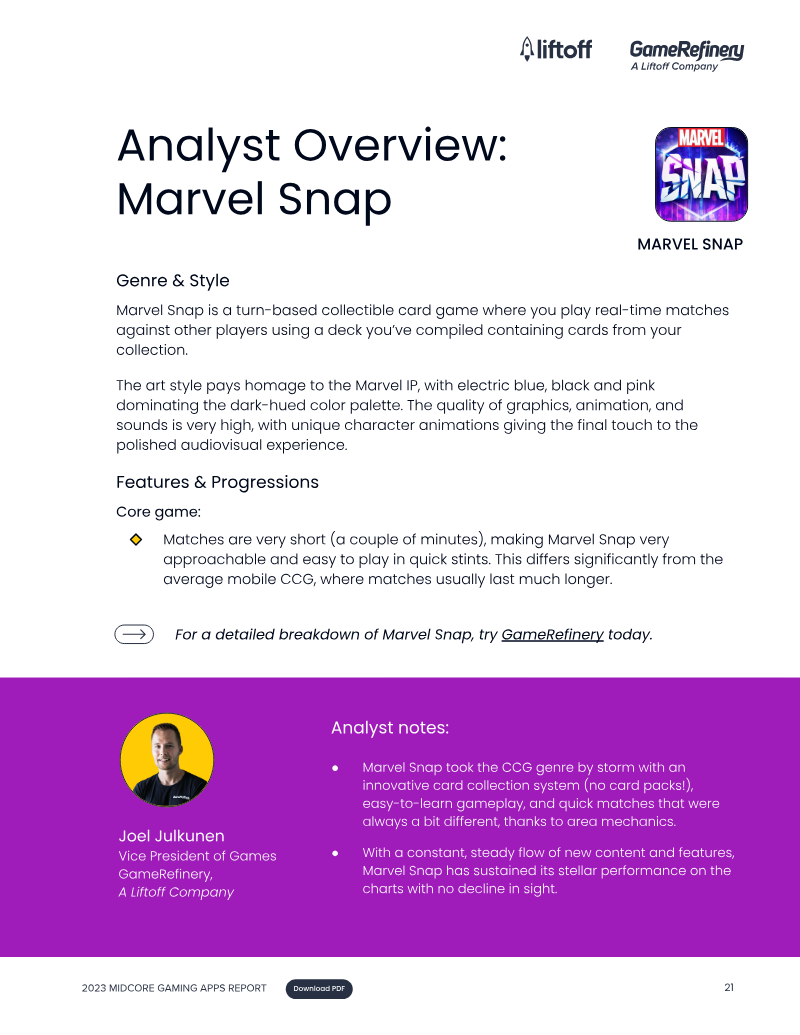
The Liftoff 2023 Midcore Gaming Apps Report, prepared with GameRefinery, examines the midcore mobile games market.
- Midcore games carry higher acquisition costs than casual games, with overall CPI averaging around $2, which the report says is 2x the casual figure.
- Android is the more cost-effective platform for midcore user acquisition, with Android users costing 5x less than iOS users.
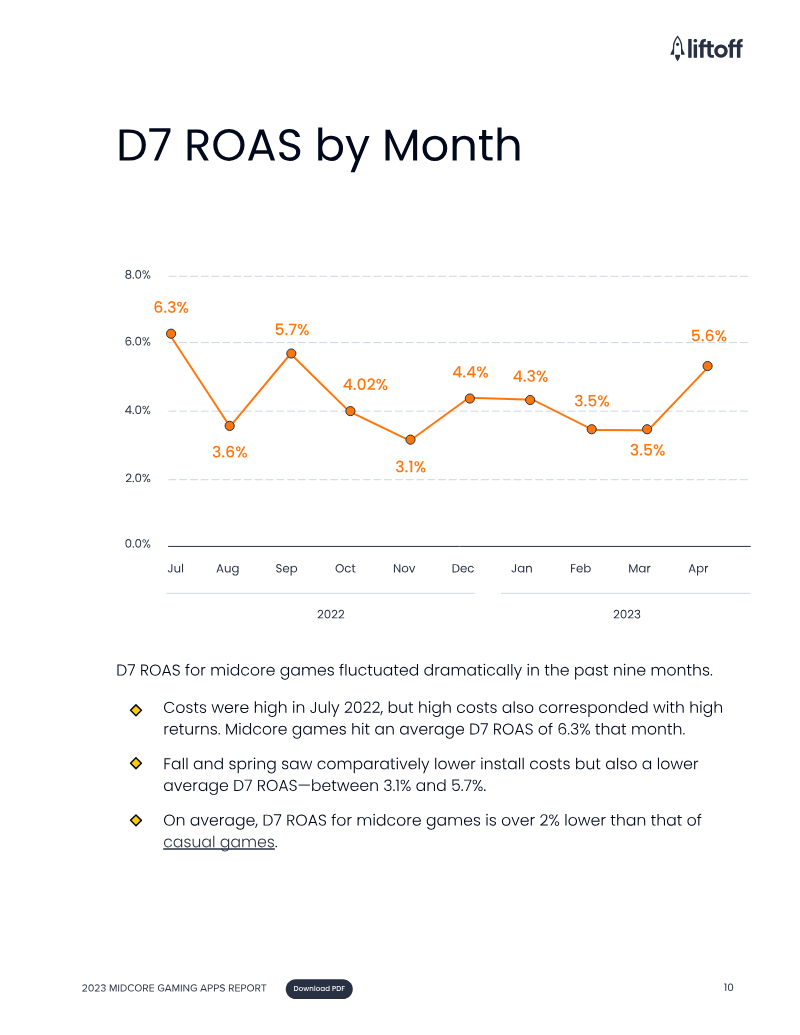
- Midcore D7 ROAS averages 4.3%, lower than the roughly 7% reported for casual games across platforms.

Q1 2023: Store Intelligence Data Digest
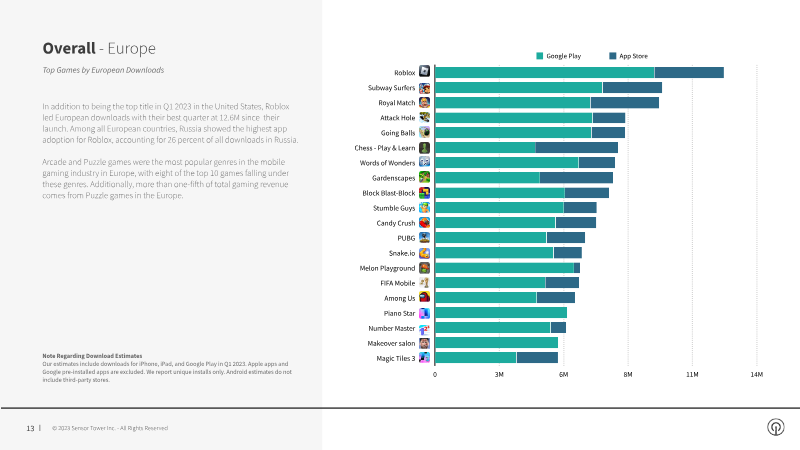
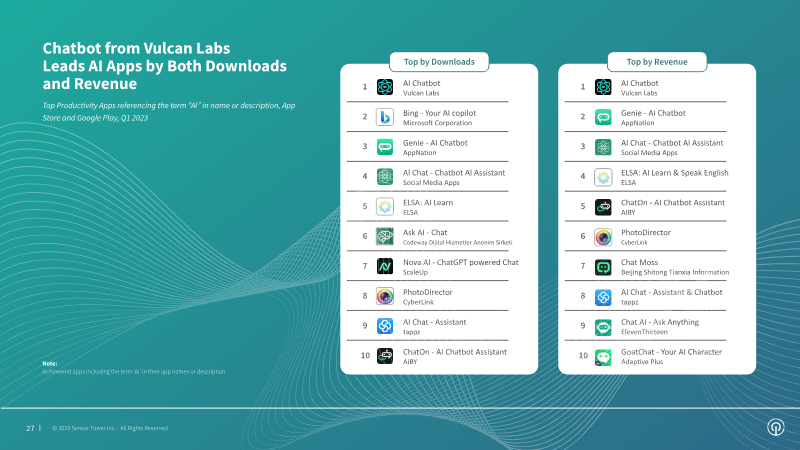
Sensor Tower's Qualitative Insights team compiled this Q1 2023 Store Intelligence digest, covering App Store and Google Play download estimates for January 1 through March 31, 2023.
- TikTok remained the No. 1 app worldwide by downloads for the eleventh consecutive quarter in Q1 2023.
- Temu took the top spot on both the App Store and Google Play in the U.S. in Q1 2023, with 19.5M unique installs.
- Meta held the top publisher position worldwide since Q2 2022, while Google's downloads declined to 579M in Q1 2023.

Global Mobile Game & App (Non‑Game) Marketing White Paper 2022
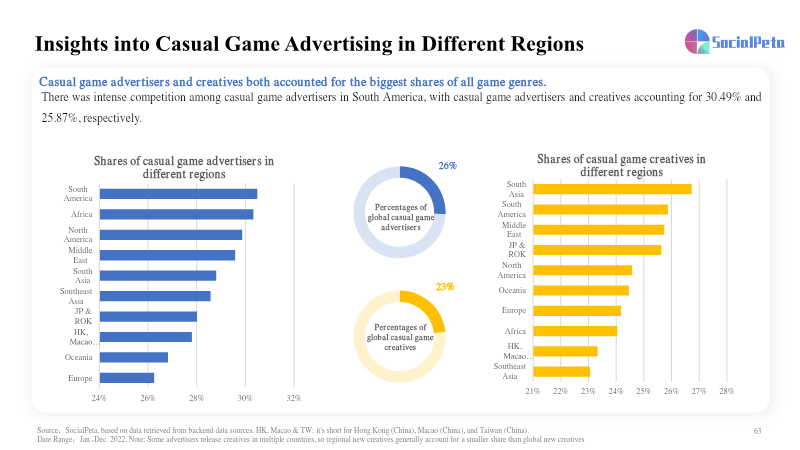
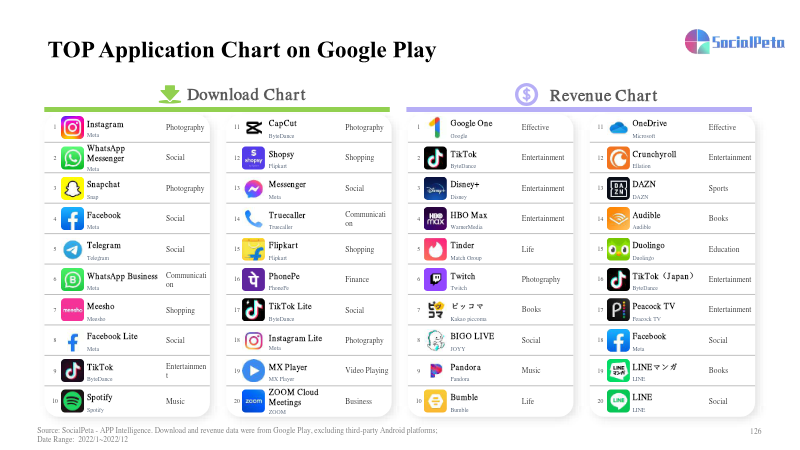
SocialPeta's 2022 Global Mobile Game & App (Non-Game) Marketing White Paper covers advertising data for the global mobile game market and mobile non-game apps for January to December 2022.
- Casual games held the largest advertiser share in 2022 at 27.87%, up 2.94% from the prior year.
- Casual game creatives reached 22.69% in 2022, up 4.74% year-on-year, the largest increase among all game genres for creatives.
- The number of mobile game advertisers in 2022 averaged over 37,000 each quarter, a 17.5% year-on-year increase, while average quarterly creatives were nearly 12 million, down 15.9% year-on-year.

Q1 2023 Insights into Global Mobile Game Marketing Trends
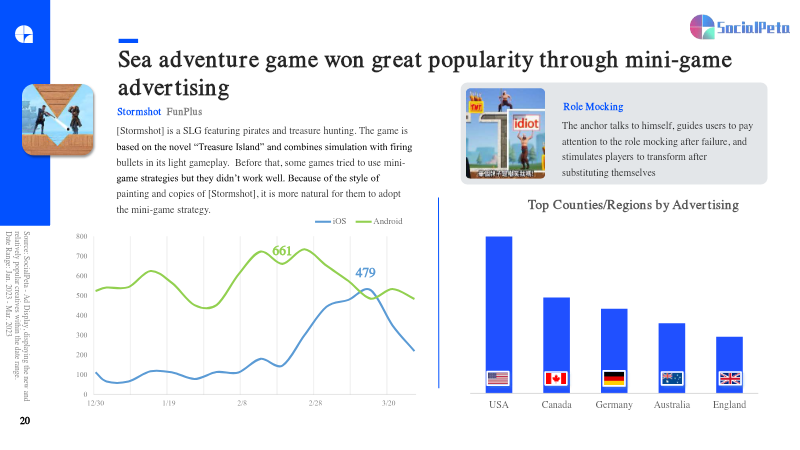
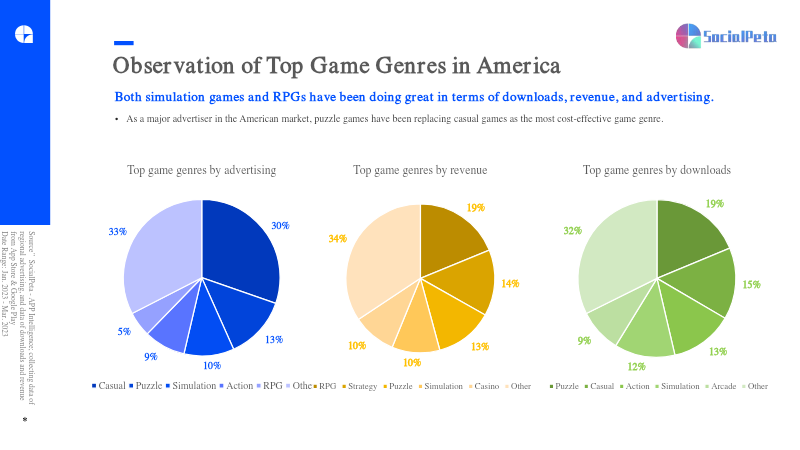
SocialPeta, an advertising and marketing data platform, presents a Q1 2023 analysis of global mobile game marketing trends, drawing on ad data captured from January 2022 to March 2023.
- Q1 2023 saw nearly 50K advertisers with new creatives, accounting for over 92% of advertisers.
- Creatives on Android started to rise, accounting for nearly 70%.
- Video made up 82.97% of game ad creatives by type over the January 2022 to March 2023 period.

Insights into Marketing Trends of Global Mobile Apps
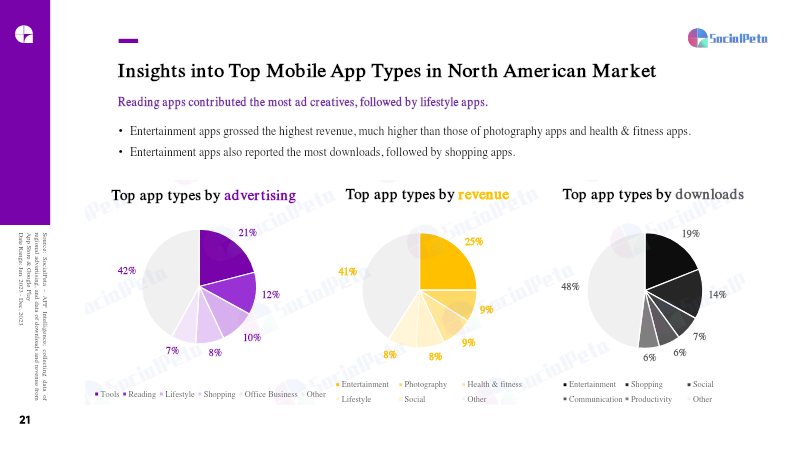
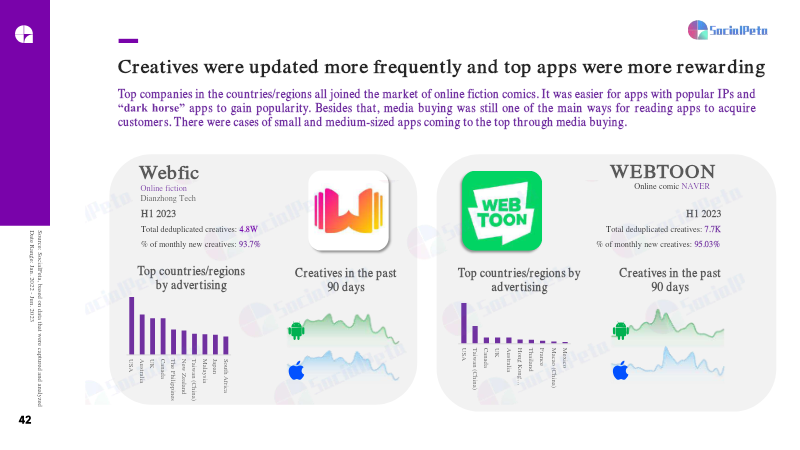
This SocialPeta report, "Insights into Marketing Trends of Global Mobile Apps" (H1 2023), analyzes mobile app advertising worldwide.
- In H1 2023, the Middle East's video share exceeded 72%, Southeast Asia's exceeded 69%, and Japan and South Korea's exceeded 68%.
- In H1 2023, creatives on Android accounted for over 70% of the total, and average creatives per advertiser on Android were 39.2% higher than on iOS.
- Tool app advertisers recorded the largest increase among app types studied, with YoY growth above 100% in all countries and regions covered.

5 Mobile App Forecasts: 2023
data.ai's 2023 outlook presents five forecasts for the global mobile market, covering advertising, gaming, top-grossing apps, category growth, and time spent.
- Mobile gaming consumer spending is projected to decline to $107 billion in 2023 due to macroeconomic pressures and stricter privacy regulations like IDFA.
- Global mobile advertising spend is expected to reach $362 billion in 2023, with short-form video apps serving as the primary growth driver to offset reduced performance marketing budgets.
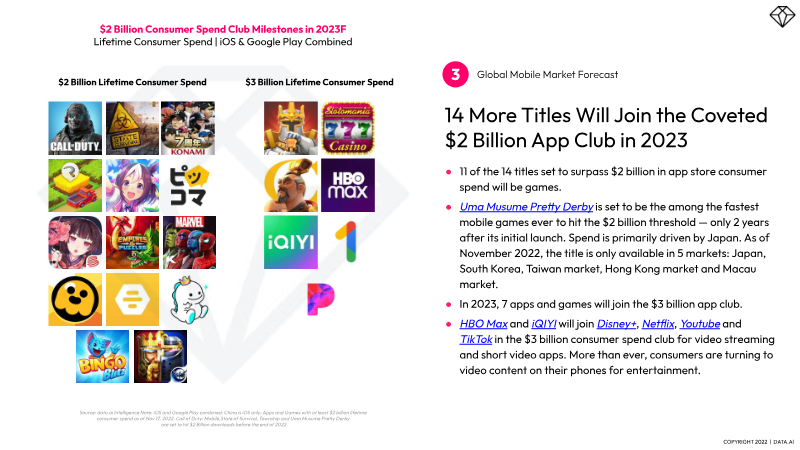
- Eleven of the fourteen new apps projected to surpass $2 billion in lifetime consumer spend during 2023 are games, demonstrating that top-tier titles remain resilient despite the broader market downturn.
Mobile Games: State of the Market
Mobile gaming performance in the first half of 2023 is analysed against the first half of 2022, covering 37 countries from January 1 to June 30, 2023.
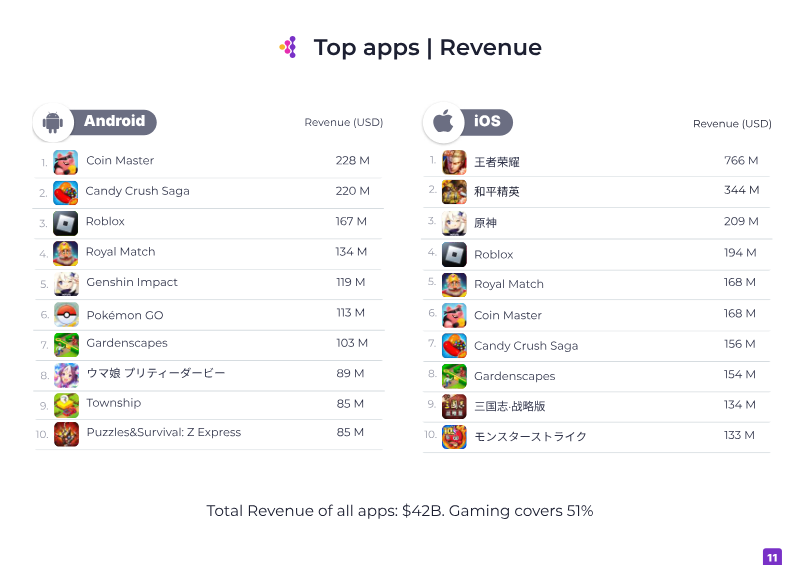
- Mobile gaming revenue and downloads declined globally in the first half of 2023, though the sector still accounts for 51% of total app revenue and 29.6% of total downloads.
- The United States leads global mobile gaming revenue with $5.71 billion, while India holds the largest share of global downloads at 15.29%.
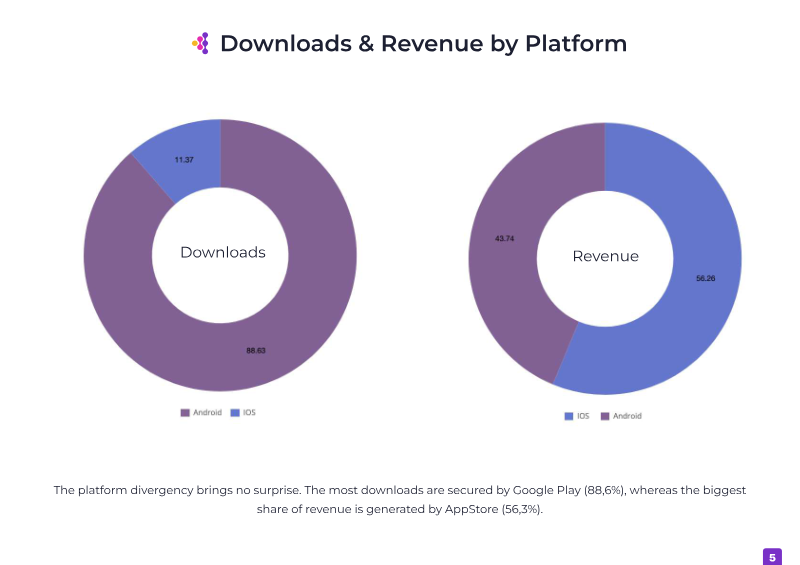
- Platform performance remains split: Google Play dominates volume with 88.6% of total downloads, while the App Store captures 56.3% of total revenue.
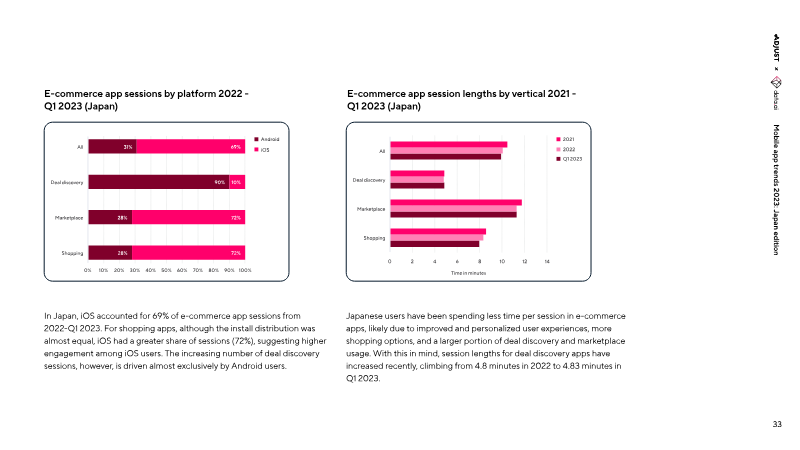

Mobile App Trends 2023: Japan Edition
Mobile App Trends 2023: Japan Edition is a report prepared by Adjust in collaboration with data.ai, analyzing mobile app installs, sessions, and post-install engagement in Japan from January 2021 to March 2023.
- Japanese app users spent $4.65 billion across all verticals in Q1 2023. The key findings page cites a 13% increase on the previous quarter, while the market overview gives 12%.
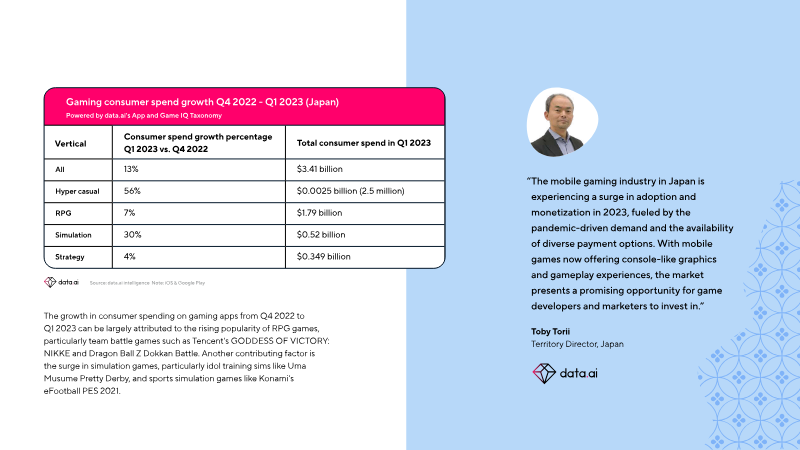
- Gaming consumer spend rose from $3 billion to $3.14 billion between Q4 2022 and Q1 2023, a 13% increase.
- Fintech app sessions grew 14% year over year in 2022 and a further 17% in Q1 2023 compared with Q4 2022.

Mobile Growth & Monetization Report 2023
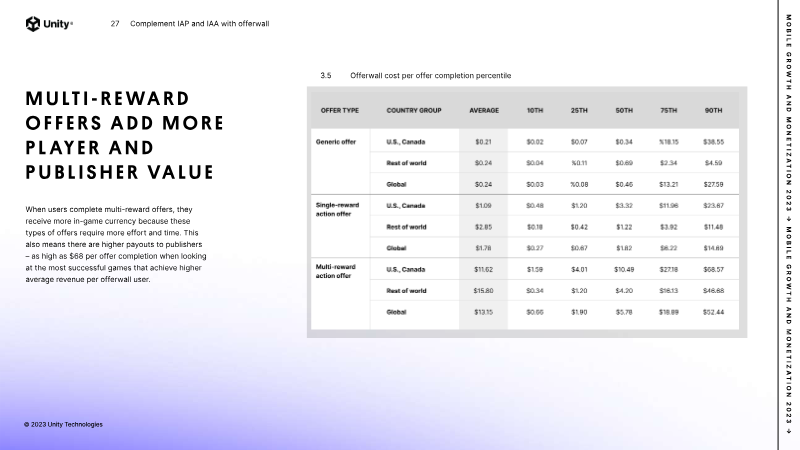
Unity's Strategic Partnerships team, drawing on data from the Unity portfolio of products, presents the Mobile Growth and Monetization Report 2023.
- 77% of players who have ever converted to IAP did so within the first two weeks, and by day 21 over 80% of IAP payers had converted.
- Rewarded ads placed between game levels were the placement players engaged with most, in 55% of games.
- Offerwalls can represent an average of 33% of ad revenue for games using more than one monetization type.
Writers
Games and companies
Games