Mobile reports and market data
Documents

Sensor Tower India: Mobile Game Market Insights 2025
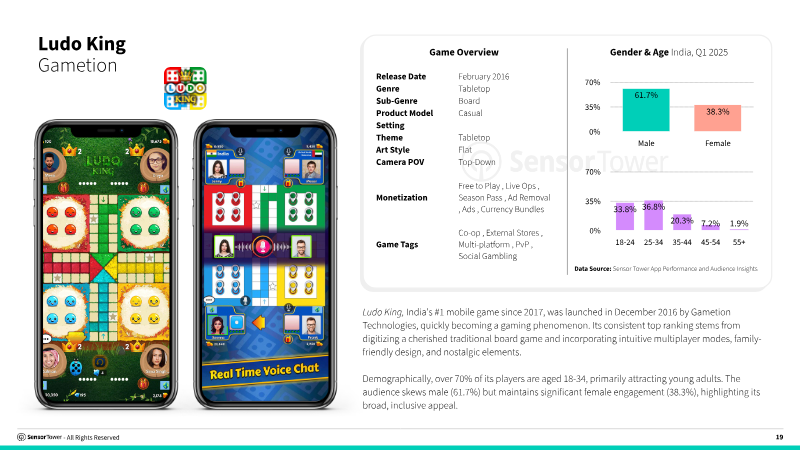
India has firmly established itself as the world's leading mobile game market by downloads, achieving 8.45 billion in FY 2024-25, despite an 8.7% year-over-year decline.
- India is the world's largest mobile-gaming market by volume, recording 8.45 billion downloads in FY 2024-25 but generating only $400 million in in-app purchase (IAP) revenue.
- Monetization is heavily concentrated in competitive, engagement-heavy genres including Shooter, Casino, and Strategy (4X), while high-volume downloads are driven by casual Simulation, Arcade, and Tabletop titles.
- The player base is predominantly male (86%) and aged 18-34 (77%), though lifestyle titles represent a unique segment for attracting female gamers.


China Game Industry Report 2025
The "China Game Industry Report 2025" provides an authoritative assessment of the Chinese game market's performance and trends in 2025, along with a forward-looking analysis for 2026.
- Chinese self-developed mobile games generated US$20.455 billion in overseas revenue in 2025, marking a 10.23% year-on-year increase and the sixth consecutive year exceeding RMB 100 billion.
- The United States remains the primary overseas market for Chinese games, accounting for 32.31% of total export revenue, followed by Japan at 16.35% and South Korea at 9.15%.
- Strategy games (SLG) dominate the overseas market, capturing 49.97% of earnings, significantly outpacing shooters at 9.69% and RPGs at 9.39%.

The Mobile App Growth Report: 2025 Edition
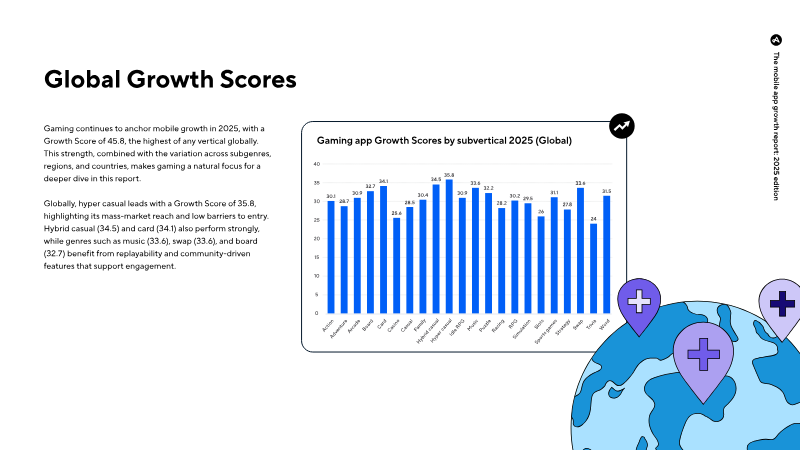
Adjust's 2025 Mobile App Growth Report argues that mobile growth now depends on value over volume, and it supports that view with a reworked Growth Score.
- Global mobile app installs grew 11% year-over-year in 2025, with user sessions increasing by 10% as the industry shifts from volume-based acquisition to value-driven retention.
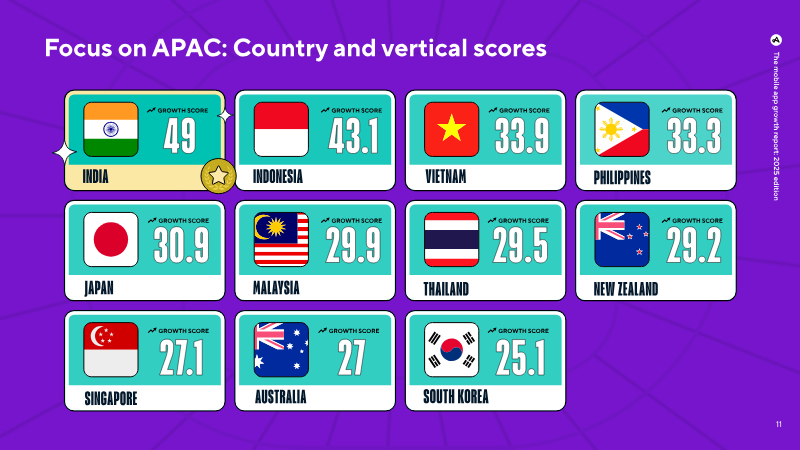
- The Asia-Pacific region is the primary driver of global growth with a score of 45, led by India, which holds a national growth score of 49 and a gaming-specific growth score of 52.2.
- Gaming remains the dominant global vertical, with Latin American and Middle Eastern markets projected to reach revenue milestones of $35.9 billion and $3.73 billion respectively by 2030.
Mobile App Trends 2025: Japan Edition
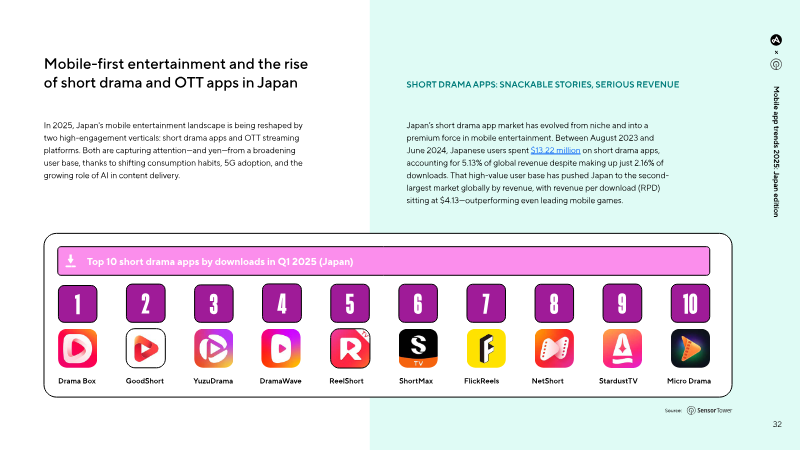
Japan ranks as the world's third-largest consumer app spending market, at $16.5B in 2024 across 194M mobile connections.
- Japan’s mobile market generated $16.5 billion in consumer spend in 2024, supported by a 7% year-over-year increase in total installs.
- The finance sector is a primary growth driver, with a 50% surge in installs fueled by the adoption of payment and banking applications.
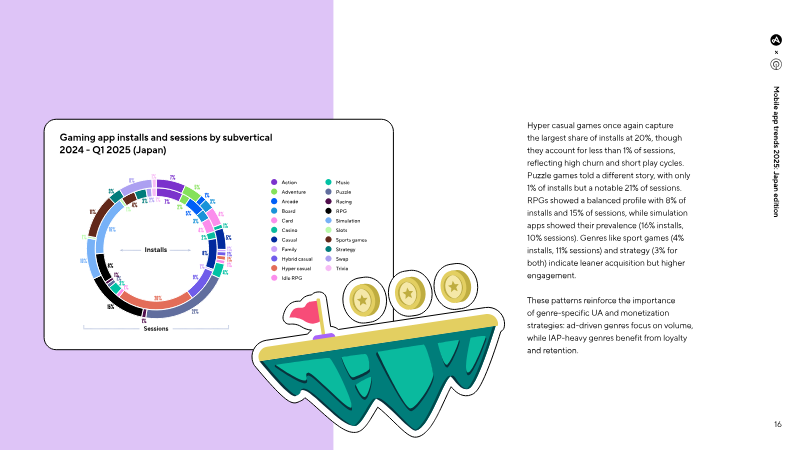
- Gaming remains a stable pillar, with card games seeing a 127% increase in sessions and role-playing games maintaining 40-minute average session lengths.
Mobile Game Genre Report: Comparing and Contrasting Eastern and Western Markets
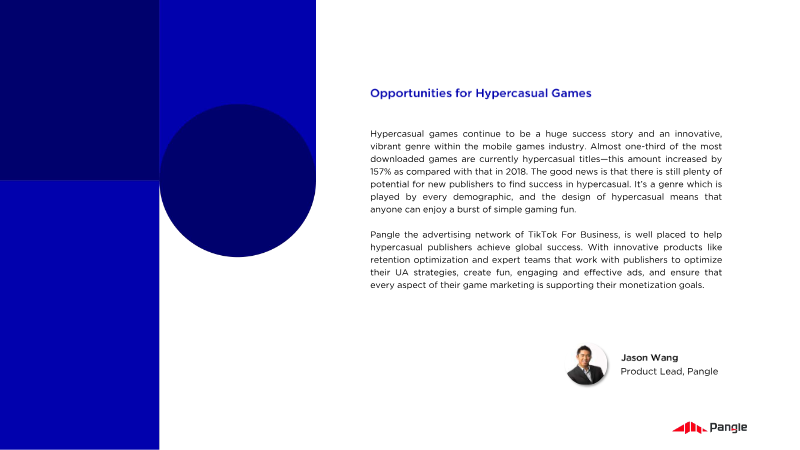
Hypercasual was the top mobile genre by downloads in 2021, and this Pangle and Newzoo genre report compares how it performs in the West (U.S., U.K.) and the East (Japan, South Korea).
- Hypercasual games represent 36% of the top 100 global mobile downloads, though they command nearly 50% of top charts in the U.S. and U.K. compared to only 20% in Japan and South Korea.
- The hypercasual sector suffers from high volatility, with only eight of the top 36 titles from 2020 maintaining their positions in the 2021 rankings.
- Developers are shifting toward 'hybrid-casual' models—incorporating lite meta features and live operations—to address retention rates that typically drop below 10% by day seven.
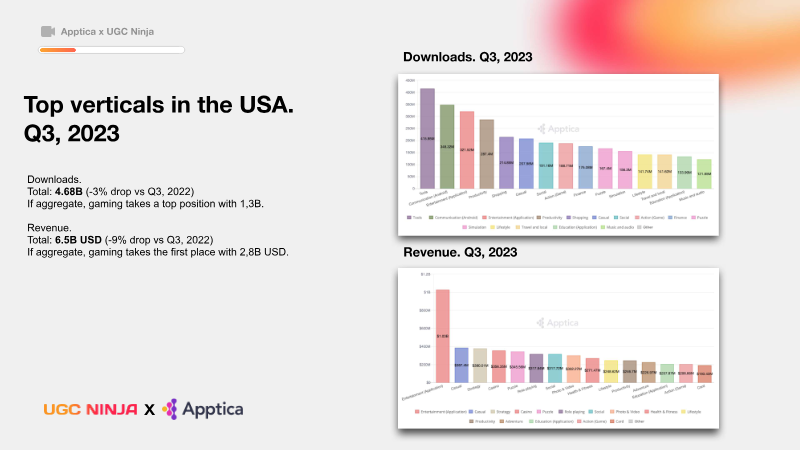


Creative Analytics
Mobile advertising activity in Q3 2023 is analyzed through data from Apptica's ad intelligence platform, paired with creative guidance from UGC Ninja, an agency focused on UGC-style ads.
- Video-centric content now dominates the mobile advertising landscape, accounting for 80% of all creatives in Q3 2023, up from 69% in the previous quarter.
- Total mobile advertisers declined 7% year-over-year to 54,900, though the gaming, entertainment, and lifestyle verticals bucked this trend with continued growth.
- Android remains the primary platform for ad distribution, hosting 68% of the 15.2 million total creatives compared to 32% on iOS.

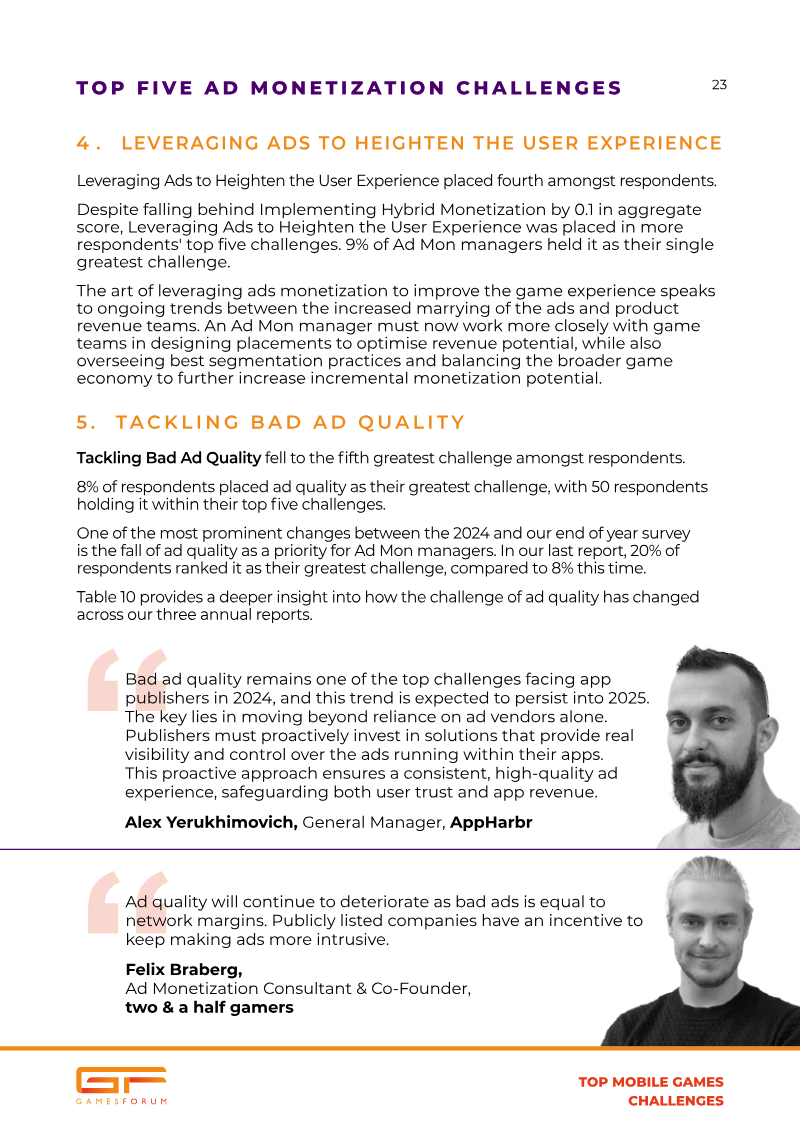
Intelligence Top Mobile Games Challenges: A User Acquisition, Ad & Product Monetization Report
Gamesforum's 2025 mobile games challenges study maps the priorities of user acquisition, ad monetization and product monetization professionals.
- Market saturation and rising costs per installment are the primary obstacles for 41% of user acquisition managers, driven by intense competition from non-gaming entities.
- Product managers are prioritizing LiveOps as their most significant challenge, with nearly 30% ranking it above traditional concerns like game economy balancing or prototyping.
- The industry is shifting away from high-volume acquisition toward sustainable growth models that prioritize long-term user retention and lifetime value maximization.

Top 10 Hybridcasual Games in Q1 2025: The Great Puzzle Takeover
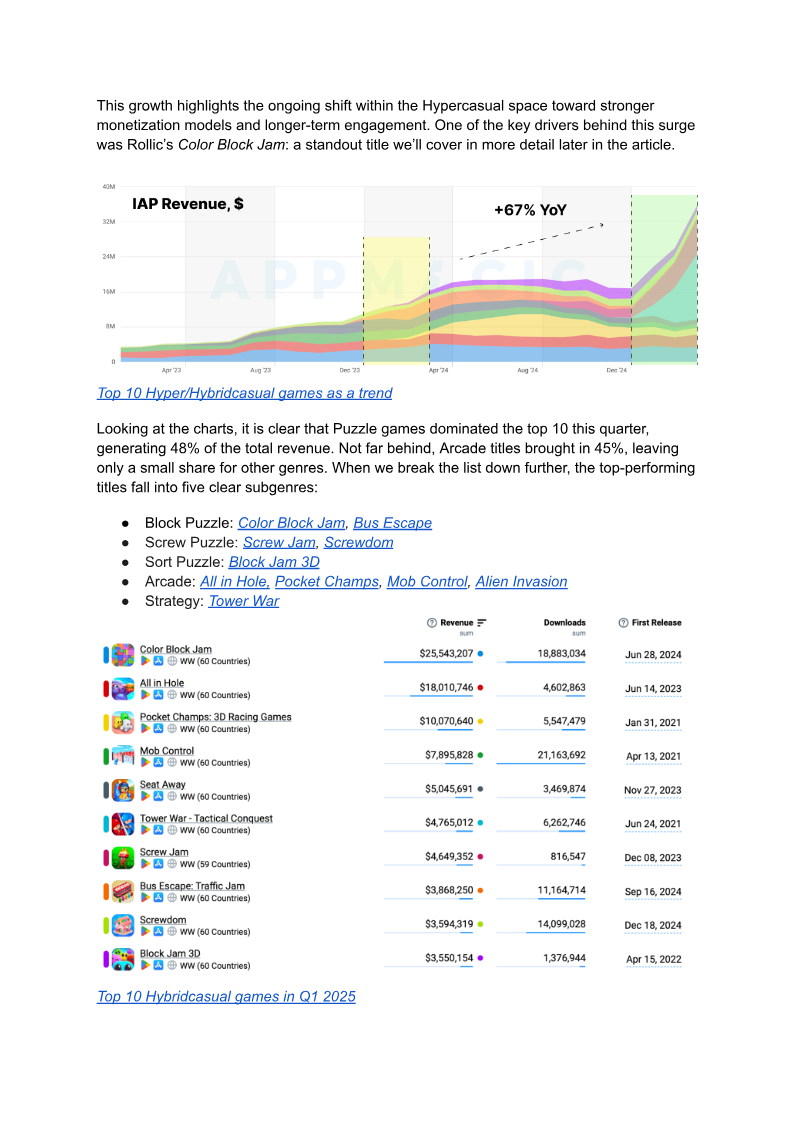
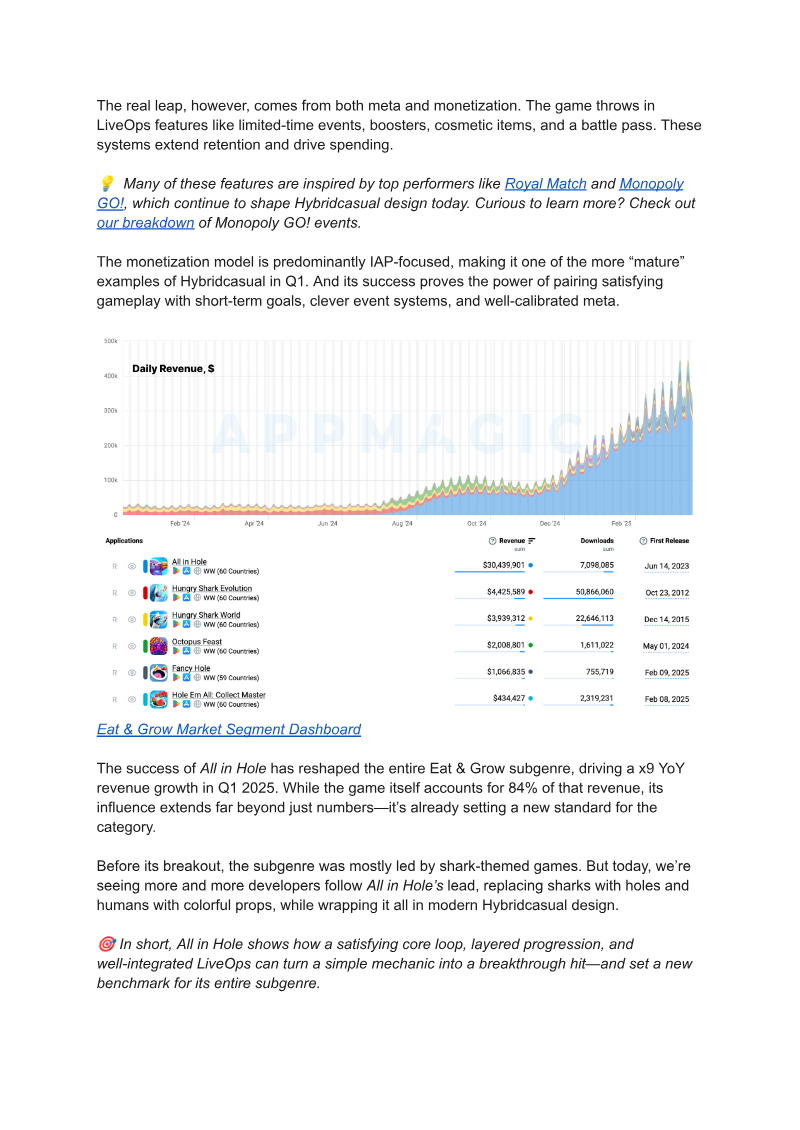
Hybridcasual, the evolution of Hypercasual games layered with Casual-style boosters, meta systems, LiveOps and refined monetization, is now strong enough that AppMagic has shifted its quarterly Hypercasual reporting to cover it.
- The top ten hybrid-casual games generated $87 million in net IAP revenue in Q1 2025, marking a 67 percent year-over-year increase.
- Puzzle and arcade titles dominate the hybrid-casual market, collectively accounting for over 90 percent of total earnings with a 48 percent and 45 percent revenue share, respectively.
- Block-puzzle games lead the puzzle category with 71 percent of revenue, while sort-puzzle titles experienced the fastest growth, increasing 5.6 times year-over-year.
Newzoo Puzzle Games Report: Mobile Game Genre Insights
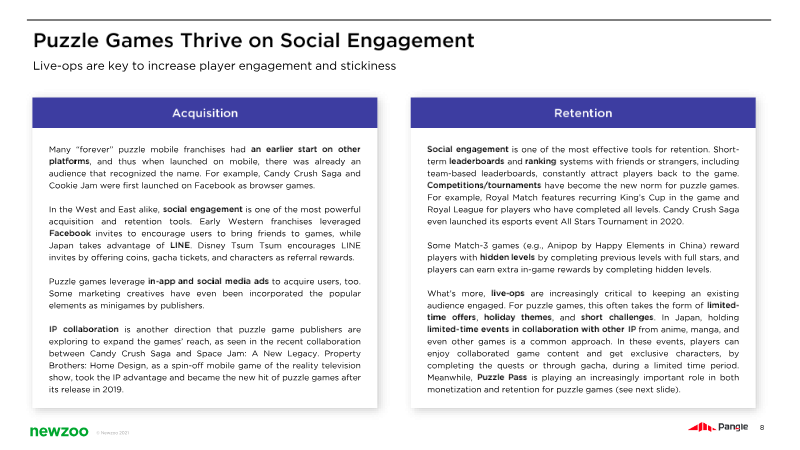
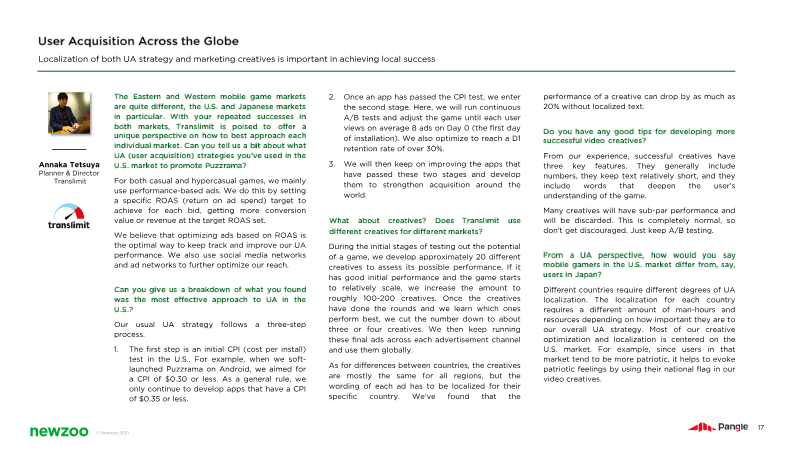
Newzoo and Pangle's joint genre report examines mobile puzzle games, comparing Western and Eastern markets (the U.S., UK, Japan, South Korea, and China) to help developers and publishers understand regional differences in monetization, marketing, and player demographics.
- The United States is the world's largest mobile puzzle market, followed by Japan and China.
- Western puzzle games rely heavily on in-app advertising (IAA) and simple economies, while Eastern titles—especially in Japan—prioritize deep character collection and gacha mechanics to drive higher in-app purchase (IAP) revenue.
- Western players demonstrate a higher tolerance for frequent ad breaks, whereas Japanese players prefer longer, uninterrupted sessions and show a greater willingness to pay for aesthetic enhancements and additional functions.

Growth of the Korean Emoticon Market: A New Distribution and Expansion Method for the K-Character Industry
Korea's emoticon industry has evolved from a digital self-expression tool into a character IP-driven content sector, and its growth offers a model for distributing and expanding K-characters.
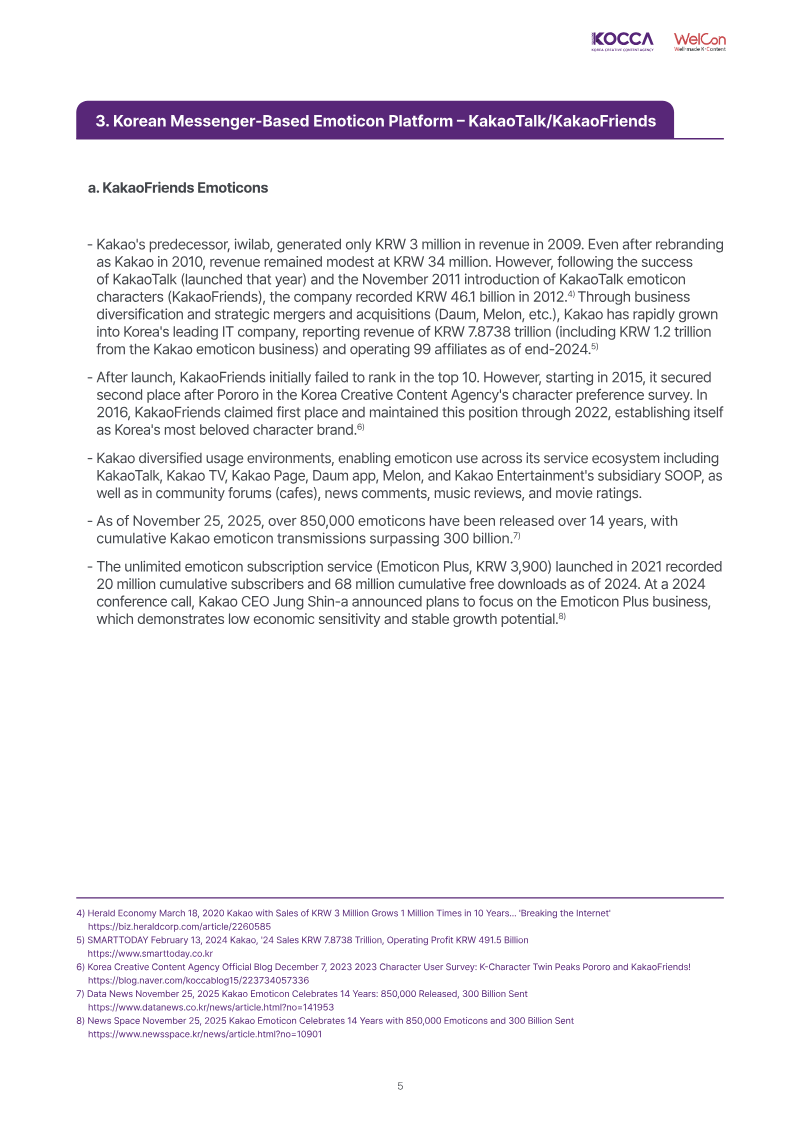
- The Korean emoticon market has grown into a KRW 1.5 trillion (≈US$1.2 trillion) industry, anchored by the KakaoTalk platform.
- Over the last 14 years, the market has seen the release of more than 850,000 distinct emoticons, resulting in over 300 billion individual sends.
- Emoticons have evolved from simple messaging features into high-value intellectual property (IP) assets, such as KakaoFriends and LINE Friends, that drive revenue across merchandise, mobile games, and animation.
Yearly Live Streaming Trends Report 2024
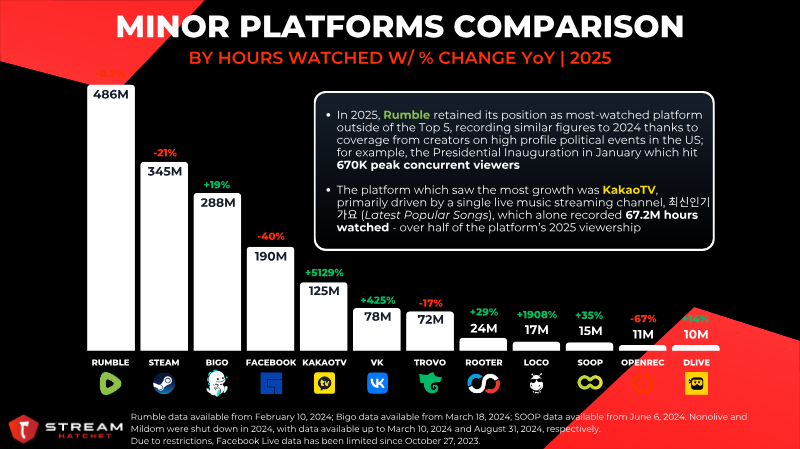
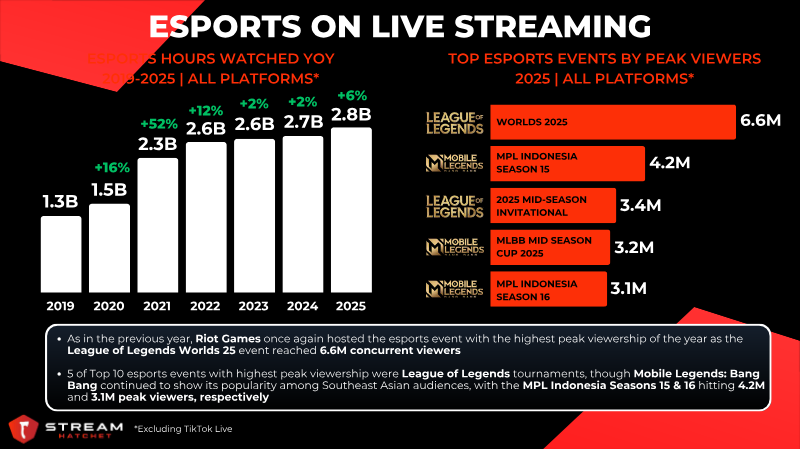
Live streaming viewership recovered in 2025, rising 6% to 36.4 billion hours watched and nearly matching the 2021 peak of 37.1 billion, though growth slowed from the prior year.
- The live streaming industry reached 35 billion hours watched in 2024, reflecting a stable 3% year-over-year growth rate as the market shifts toward long-term sustainability.
- Kick grew its viewership by 45% in 2024 by leveraging aggressive revenue-sharing models and non-exclusive contracts to challenge Twitch’s market leadership.
- The 'Just Chatting' category remains the dominant content type, accounting for nearly 15% of all platform activity across the industry.
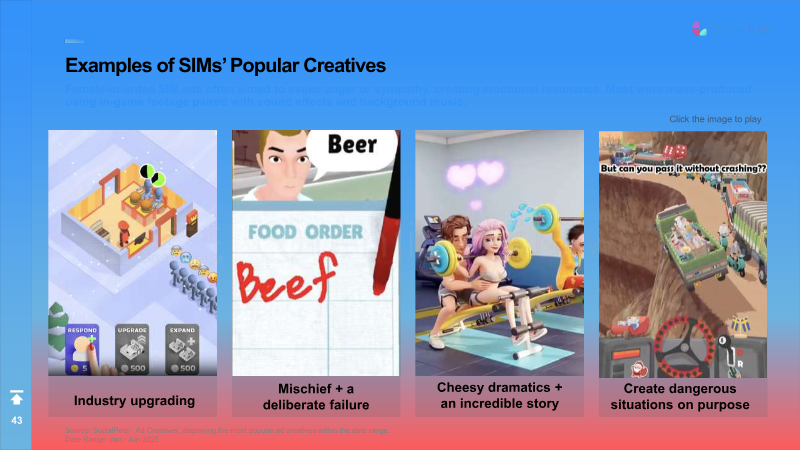

Insights into Global Mobile Game Marketing Trends for H1 2025
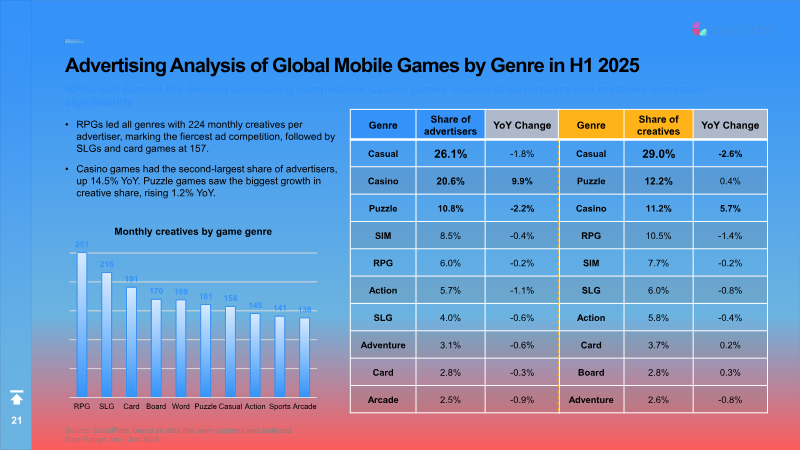
SocialPeta's H1 2025 white paper, sponsored by NewsBreak, examines global mobile game advertising from January to June 2025. It draws on more than 1.6 billion ad data points from over 80 channels and nearly 70 countries.
- AI-driven creative production has become the industry standard, with generative tools and AI-enhanced playable ads compressing development cycles to under one week.
- Europe leads in market participation with over 43,000 monthly advertisers, while North America maintains the highest creative density at approximately 119 assets per advertiser.
- Casino games have emerged as the second-largest spending category, recording a 14.5% year-over-year increase in market share.
Writers
Games and companies
Games