Market Analysis reports and market data
Documents



The Take-Two Diaspora: Why Alumni Win Big in Mobile, Not AAA
The analysis examines the investment trajectory of companies founded by former senior executives from Take-Two Interactive and its subsidiaries.
- Former Take-Two senior executives founded 23 startups between 2020 and 2025, securing $1.2 billion in capital across 43 deals.
- Dream Games, a prominent alumni-led studio, achieved a $2.5 billion exit in July 2025, highlighting the high valuation potential of these ventures.
- Alumni-led firms significantly outperform industry benchmarks, with a 60% rate of raising a second funding round within one year compared to the 20% industry average.
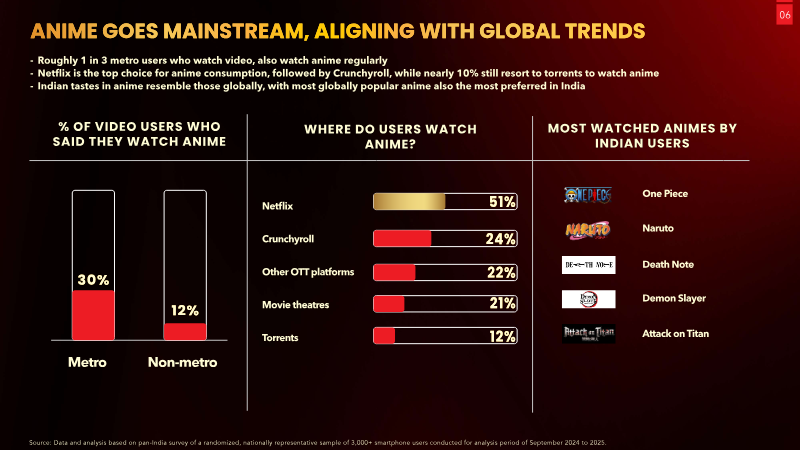

Swipe Before Type: India's Interactive Media Consumer Survey 2024–2025
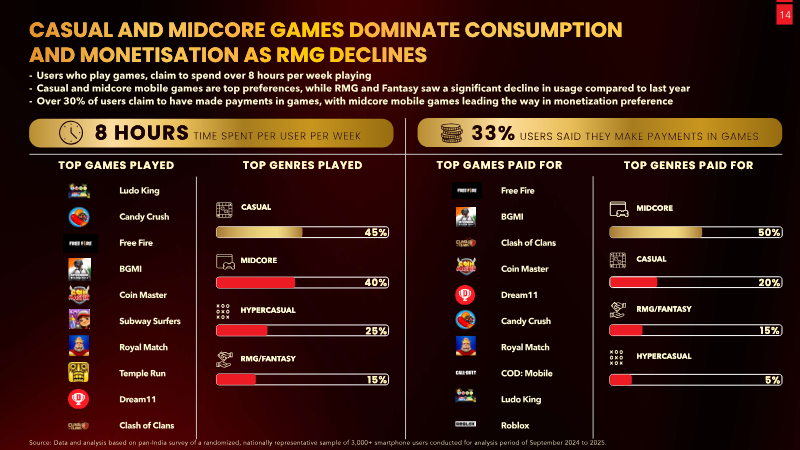
The survey, covering September 2024 to September 2025, examines India’s interactive media landscape across video, audio, social, gaming and emerging AI-driven content.
- Gaming dominates high-value consumer spending, capturing 70% of wallet share for transactions exceeding INR 1,000, while video and social media command 30% each at the INR 200–500 price point.
- Mobile-first gaming remains the primary format, but 30% of users now engage via PC and 22% via consoles, with casual and midcore titles driving 8 hours of weekly engagement.
- UPI is the near-universal payment method for digital content, accounting for 90% of all in-app purchases.


Beyond the Game: How Gamification is Becoming Mainstream
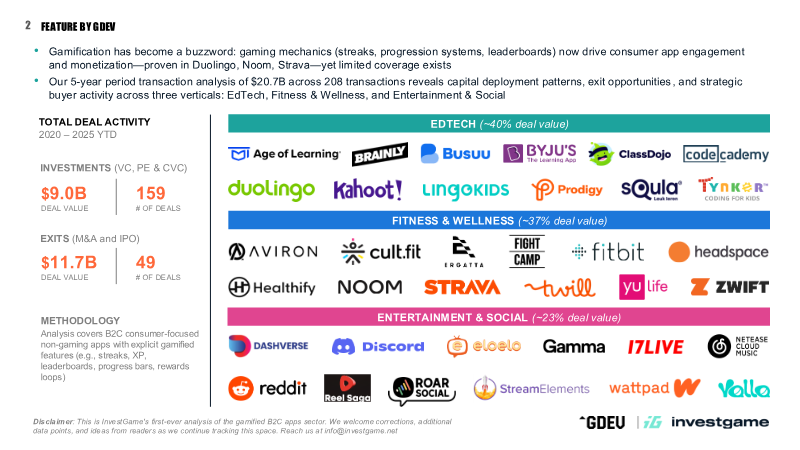
The analysis examines how gamification—applying game-like mechanics such as streaks, leaderboards, and reward loops—to non-gaming consumer apps has shifted the mobile app economy over a five-year period (2020-2025).
- Gamified non-gaming apps have surpassed mobile games in net revenue, generating $21.2 billion in Q2 2025 compared to $19.8 billion for games.
- Gamified apps are driving a 24% year-over-year growth in mobile consumer spending, while traditional mobile gaming revenue has stagnated.
- EdTech, Fitness & Wellness, and Entertainment & Social account for $20.7 billion in transaction value, with EdTech dominating deal volume (43%) and exit activity (45%).

Asia Pacific Market Report 2025: Creating Opportunities for Video Games in Asia
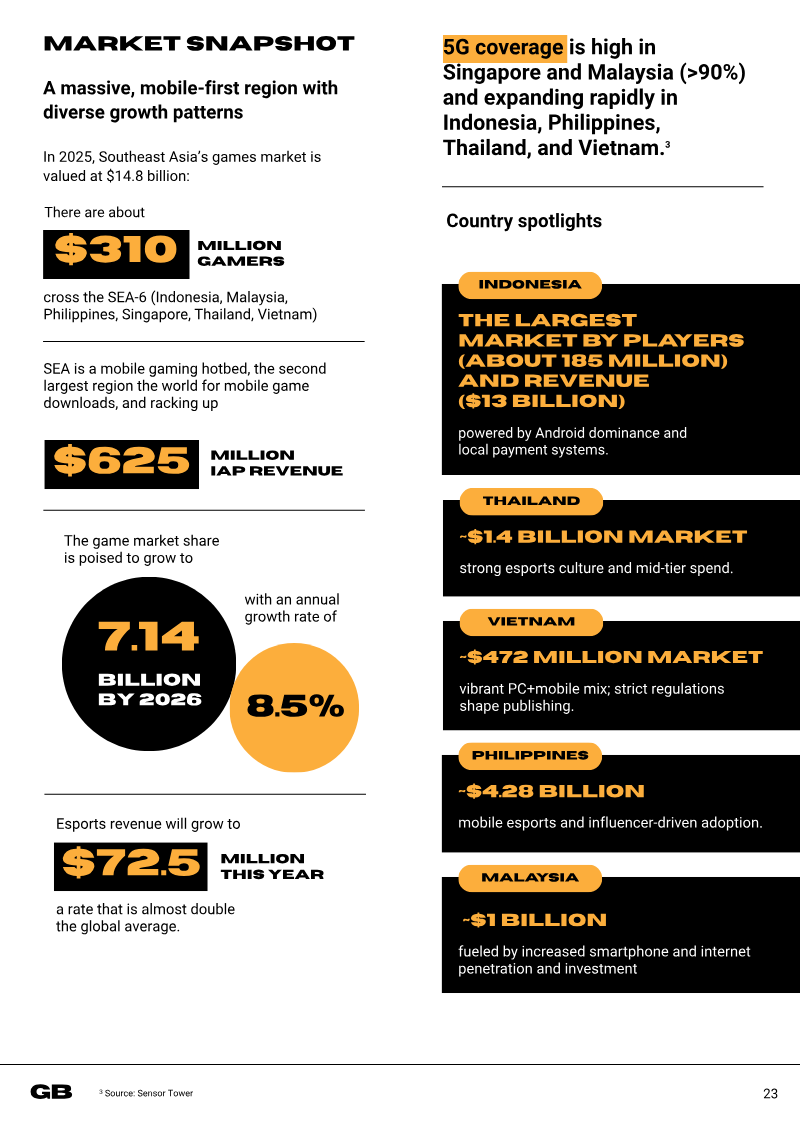
Asia’s gaming landscape in 2025 is dominated by a triad of regional strengths that together shape the global market.
- Southeast Asia is the region's fastest-growing mobile-centric market, currently valued at $14.8 billion and driven by a demographic of 680 million residents under the age of 30.
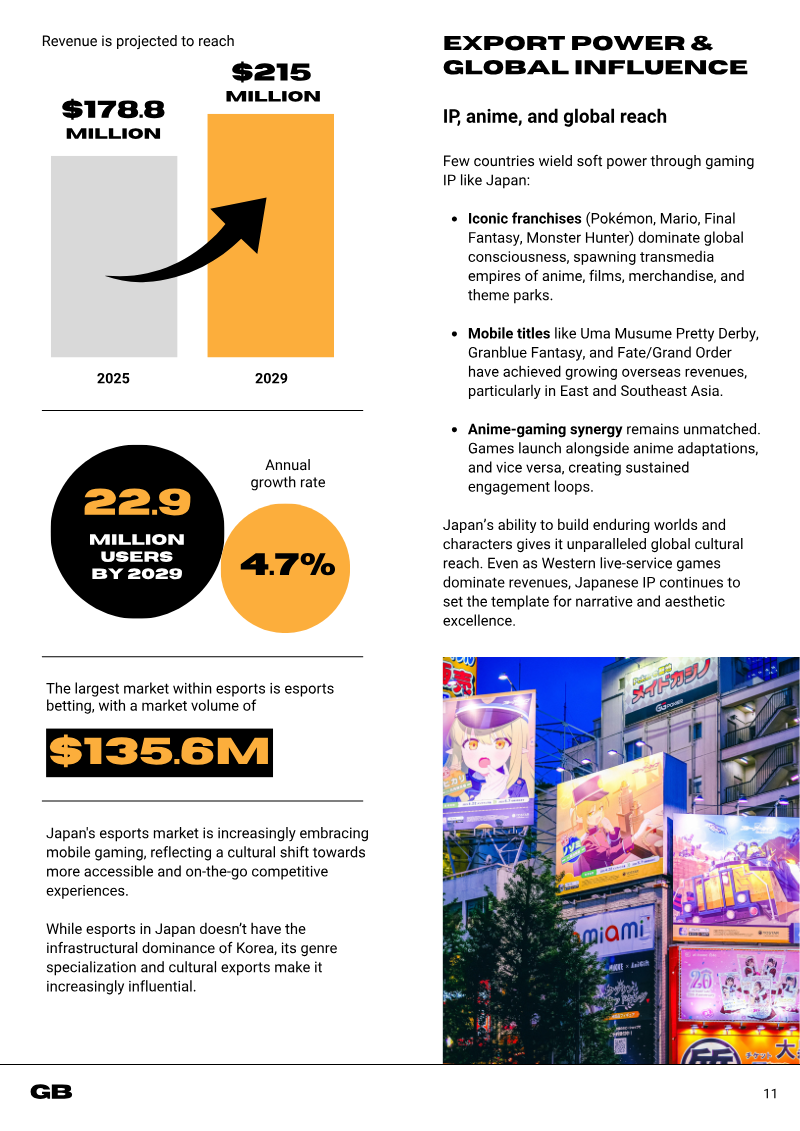
- Japan remains a global cultural powerhouse, with iconic franchises generating $215 billion in worldwide influence and $178.8 million in IP-specific revenue.
- Esports in Southeast Asia is a significant economic driver, with projected revenue between $350 million and $380 million.



AI Eats the World
Generative AI is positioned as the latest platform shift that will reshape value capture across the global tech ecosystem, with investment surging even as its ultimate impact remains uncertain.
- Hyperscaler capital expenditure is projected to reach $350 billion in 2025, nearly doubling 2024 levels as data-center investment outpaces office construction.
- Silicon supply constraints at Nvidia and TSMC, combined with power and permitting limitations, represent the primary bottlenecks threatening to throttle AI growth.
- Despite 800 million weekly active users, the paying-user base for AI models remains at approximately 5%, highlighting a significant gap in monetization.


Investing and Financial Management App Market and Advertising Trends 2025
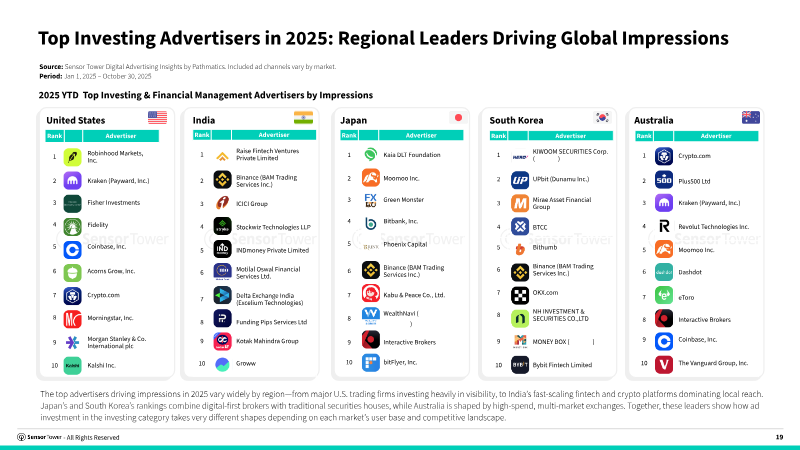
Investment-management and crypto trading applications have accelerated growth in 2025, with global downloads rising 12% to about five billion.
- Global downloads for investment and crypto trading apps rose 12% in 2025, reaching approximately five billion total downloads.
- User demographics are heavily male-skewed, with crypto apps reaching over 90% male users and emerging markets like India and Vietnam reporting only 13–17% female participation.
- Market preferences are geographically fragmented: U.S. and Japanese users favor established brokerages, while consumers in India and Southeast Asia prioritize local, mobile-centric platforms.


1H 2025 Amazon Retail Media: An Inside Look at How Brands Are Showing Up
Amazon Retail Media dominated the first half of 2025, capturing $618 million in ad spend—more than double Walmart’s $236 million and nearly six times Chewy’s $105 million—while attracting 9,542 unique advertisers, a figure nine times larger than Walmart’s 1,076.
- Amazon Retail Media dominated the market in 1H 2025 with $618 million in ad spend, significantly outpacing Walmart ($236 million) and Chewy ($105 million).
- Amazon’s advertiser base is nine times larger than Walmart’s, hosting 9,542 unique advertisers compared to Walmart’s 1,076.
- Samsung, Unilever, and L’Oréal were the top spenders in 1H 2025, contributing $7.1 million, $5.7 million, and $5.3 million respectively.

The Future of Ad Monetization: Insights from Industry Leaders
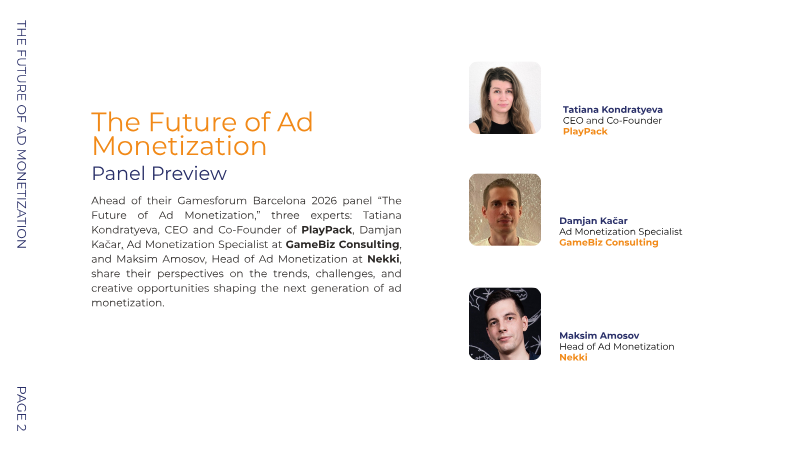
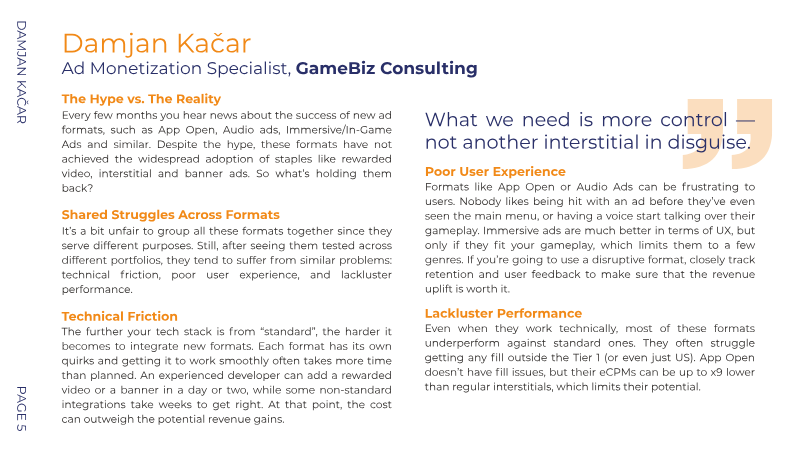
The panel “The Future of Ad Monetization” presented at Gamesforum Barcelona 2026 focuses on the evolving role of advertising within mobile game economies, arguing that ads are no longer ancillary revenue but integral to core gameplay loops.
- Hybrid monetization models that combine rewarded ads with in-app purchases are essential for profitability, but misaligned user cohorts can result in revenue losses of up to 30%.
- Ad monetization has evolved into a core gameplay component that requires real-time visibility into source performance and data-driven adaptivity to remain effective.
- Ad moments should be designed as optional, rewarding side quests rather than punitive blockers to maintain player retention and engagement.

State of Mobile 2025: Why Community Wins on Mobile
The State of Mobile 2025 report examines the current mobile ecosystem, emphasizing how community engagement—particularly on Reddit—drives sustained app growth.
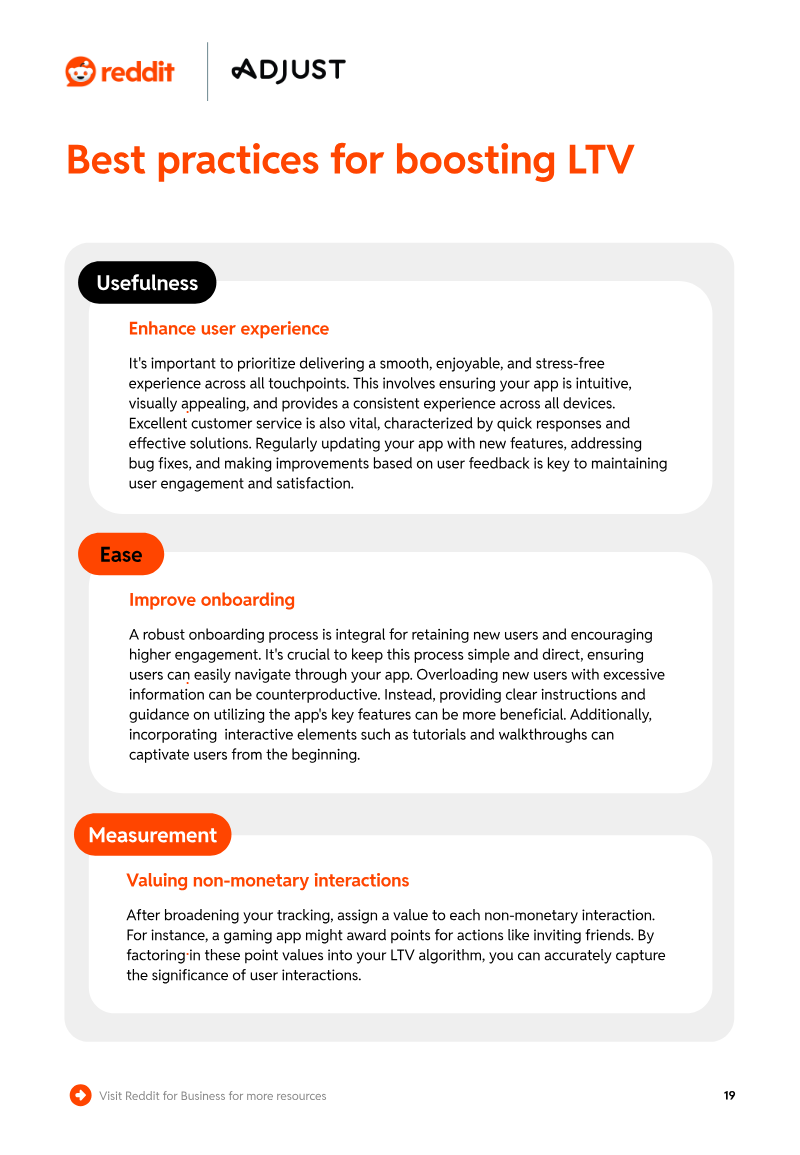
- Reddit-acquired users demonstrate significantly higher lifetime value, with 41% higher Day-1 spend than other social platforms and 159% higher than digital media.
- Reddit users exhibit superior long-term retention and engagement, spending 55% more time in-app on Day 1 and 103% more by Day 30 compared to other channels.
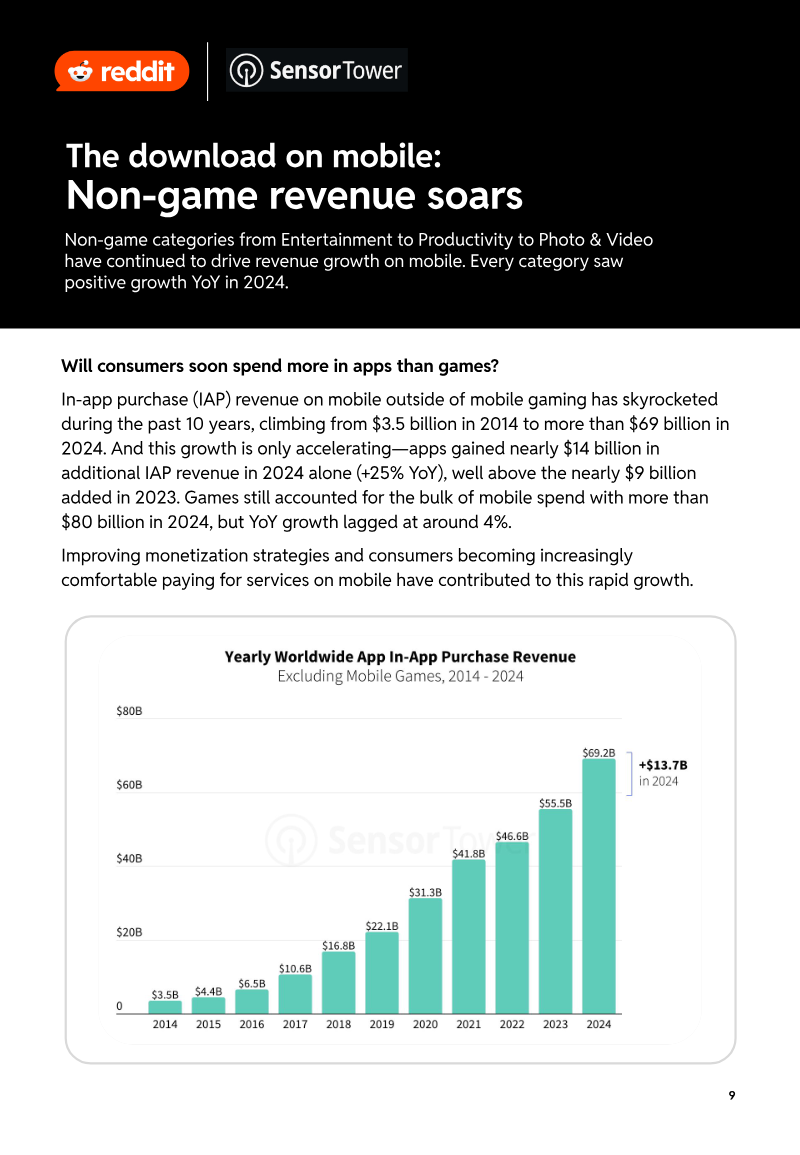
- Global mobile in-app purchase revenue reached $150 billion in 2024, representing a 13% year-over-year increase, while total usage hit 4.2 trillion hours.


Where the UGC Dollars Flow: Mapping $9B Investments in Creator Economy
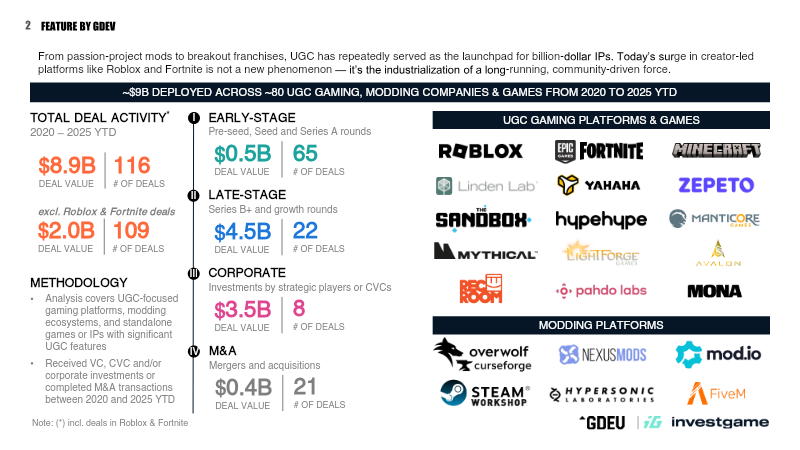
The analysis maps a $9 billion investment wave in user-generated content (UGC) gaming from 2020 to 2025, covering roughly 80 companies and titles.
- The UGC gaming sector attracted $9 billion in total investment between 2020 and 2025, with $8.9 billion concentrated in late-stage and corporate deals.
- Strategic investment from industry incumbents is a primary driver, highlighted by Sony/Kirkbi’s $2 billion commitment in 2022 and Disney’s $1.5 billion investment in 2024.
- Creator monetization is scaling rapidly, with Roblox and Fortnite collectively disbursing approximately $1.5 billion to developers in 2024 and reporting a 38% quarterly earnings increase between Q2 and Q3 2023.



Gaming in Africa 2024
Gaming in Africa 2024 reveals a market that is overwhelmingly mobile-centric, with 92% of respondents playing on phones and 81% using smartphones.
- The African gaming market is overwhelmingly mobile-centric, with 92% of users playing on phones and Android devices accounting for 92% of all downloads.
- Monetization is driven by microtransactions, utilized by 63% of players, with Kenya serving as a key market where mobile money accounts for over 60% of payment methods.
- Player engagement is high, as 78% of respondents played within the last day and one-third of gamers spend three or more hours per session.

Game Data: Building vs Buying
The document evaluates the trade-offs between building an in-house data pipeline and purchasing a third-party solution for game analytics, using GameAnalytics’ PipelineIQ Pro as the primary example.
- Building an in-house data pipeline for a studio with 5 million MAU costs approximately $50,000 per month, compared to $5,900 per month for a third-party solution like GameAnalytics’ PipelineIQ Pro.
- Human capital is the primary cost driver for both approaches, accounting for 89% of the budget for in-house builds and 78% for vendor-managed pipelines.
- Third-party solutions offer significantly faster deployment timelines, ranging from hours to days, whereas custom in-house pipelines typically require months to implement.