
The analysis examines how gamification—applying game‑like mechanics such as streaks, leaderboards, and reward loops—to non‑gaming consumer apps has shifted the mobile app economy over a five‑year period (2020‑2025). Data from 208 transactions totaling $20.7 billion reveal that EdTech, Fitness & Wellness, and Entertainment & Social are the primary verticals, with deal value shares of roughly 40 %, 37 %, and 23 % respectively. EdTech dominates both deal volume (43 %) and exit activity, accounting for 45 % of exits and 34 % of exit value, indicating a mature market attractive to strategic buyers. Fitness & Wellness shows concentrated exits in two mega‑deals (Headspace $3 billion, Fitbit $2.1 billion) but a broader spread of capital across many platforms, suggesting growth potential beyond the top brands. Entertainment & Social receives steady, diversified investment; its exits lean toward IPOs (e.g., Reddit, NetEase Cloud Music) rather than M&A, reflecting limited strategic buyer appetite.
Capital flows peaked during the 2020‑21 COVID boom but recovered quickly for gamified apps, with 2024 stabilizing and 2025 YTD already surpassing full‑year 2024 figures. Seed and Series A rounds remain active, while late‑stage activity accelerated in 2025 following earlier Series A momentum. Early‑stage capital is evenly split between Fitness & Wellness and Entertainment & Social, highlighting a white‑space opportunity, whereas EdTech shows limited early‑stage activity due to market consolidation.
The report underscores that non‑gaming apps have overtaken mobile games in net revenue (Q2 '25: $21.2 billion vs. $19.8 billion) and are driving 24 % YoY mobile spend growth, while games stagnated. This structural shift signals that institutional capital increasingly targets gamified consumer apps across these three verticals, with strategic buyers actively consolidating the EdTech segment and exploring IPO pathways in Entertainment & Social.
GDev · 2026
InvestGame · 2026
InvestGame · 2026

InvestGame · 2026

InvestGame · 2026

InvestGame · 2026

InvestGame · 2026

InvestGame · 2026
InvestGame · 2026
InvestGame · 2026

InvestGame · 2025

InvestGame · 2025

Modern Times Group · 2026
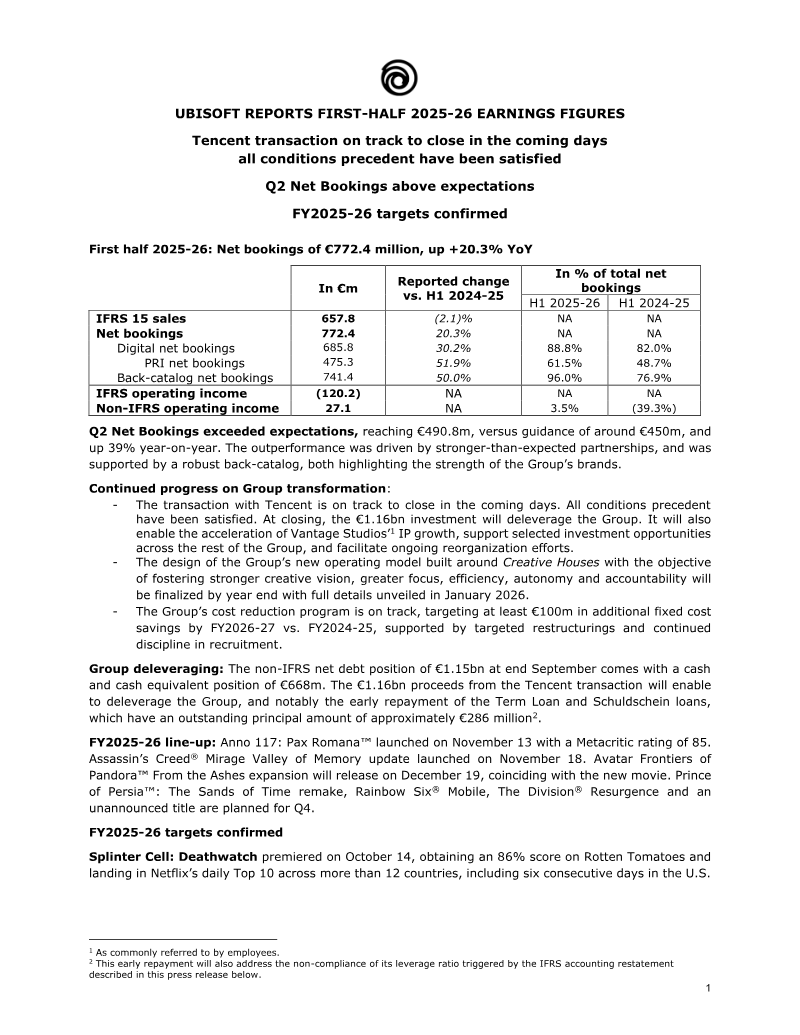
Ubisoft
Drake Star Partners · 2026

Aream & Co · 2026
Drake Star Partners · 2025
Drake Star Partners · 2025
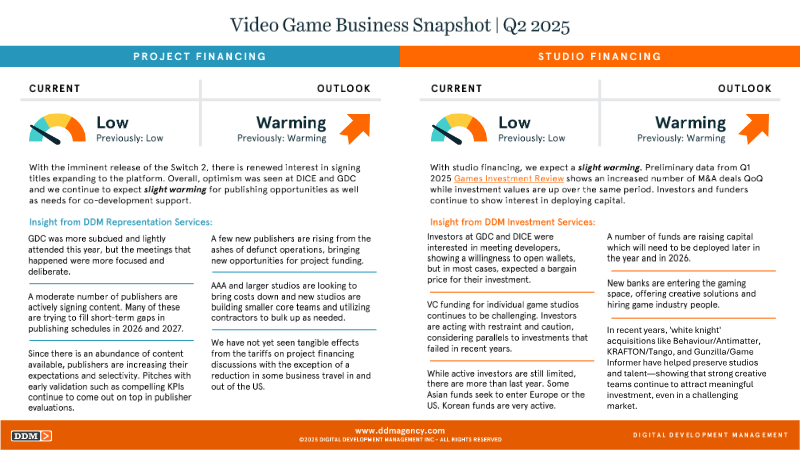
DDM · 2025
Modern Times Group · 2025
Drake Star Partners · 2025
Digital Development Management · 2025
DDM · 2025

Thunderful · 2025