2015
Company
Documents about 2015
Defining the Global Ludo Polychotomy
This paper, presented at DiGRA 2015, examines whether the established East-West dichotomy, originally theorised by S. Meštrovic (1994) and applied to cultural and psychological studies, accurately describes the global video game industry.
- The paper proposes replacing the East-West dichotomy (Meštrovic, 1994) with a "Global Ludo Polychotomy," arguing that regional differences in game design are real but too simplistic to explain market patterns.
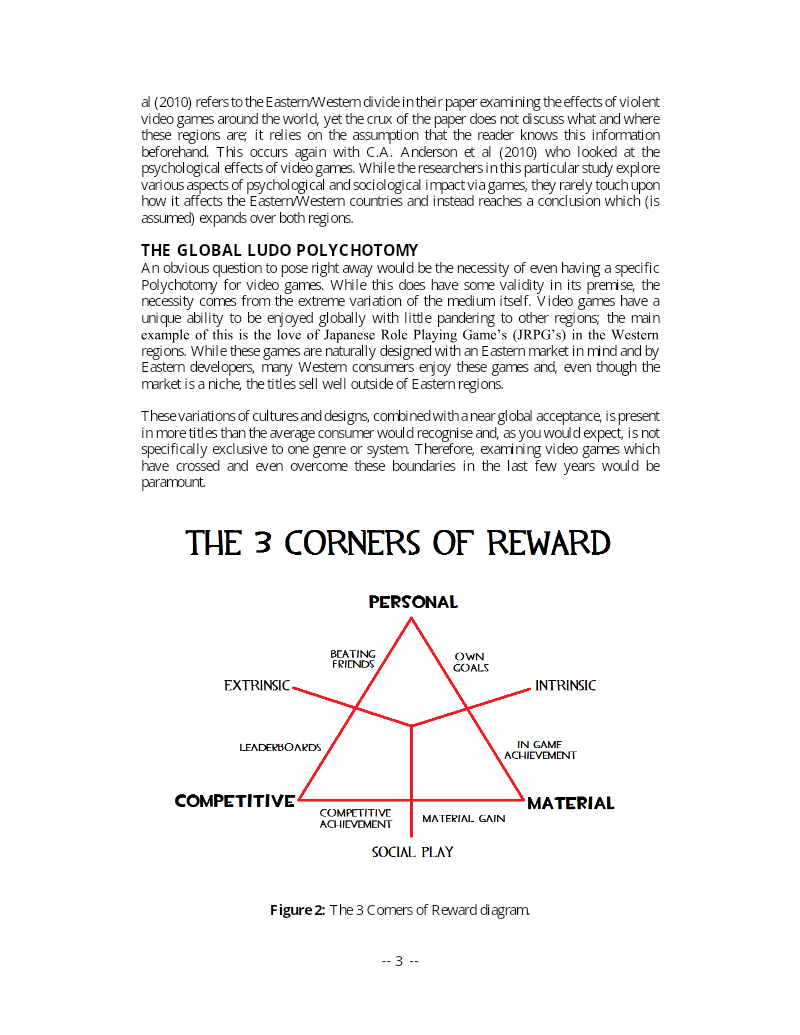
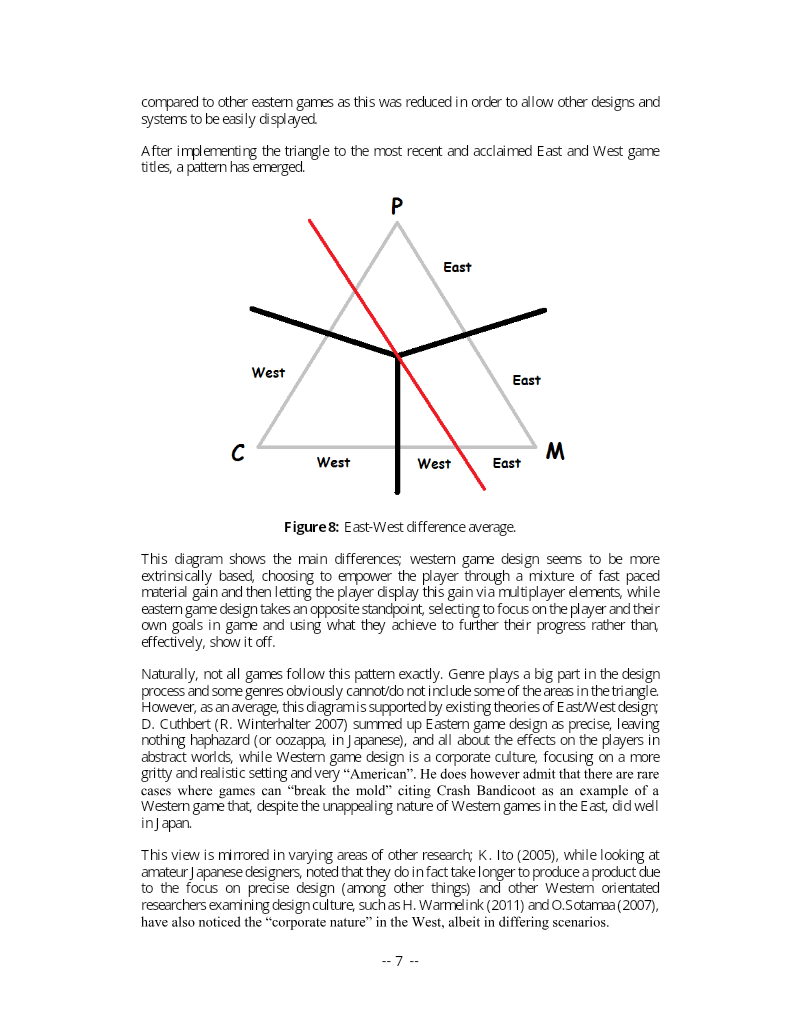
- Using the "Three Corners of Reward" model (James et al., 2013), the authors find Western design tends toward fast-paced extrinsic, material rewards displayed through competitive online play, while Eastern design favours personal goals and intrinsic progression with less emphasis on showing achievements to others.
- The analysis covers only six titles released 2007–2013: Call of Duty: Ghosts, Assassin's Creed IV: Black Flag, Pokémon X and Y, Super Mario 3D World, Grand Theft Auto V, Battlefield 4 and Lego Marvel Super Heroes, selected for popularity and seminal status.
Taking a Look at the Player's Gaze: The Effects of Gaze Visualizations on the Perceived Presence in Games
This DiGRA 2015 study by Lankes and Wagner examines how visualizing a player's gaze in game interfaces affects spatial presence, addressing a gap in research on the aesthetic and interface design of gaze feedback.
- Genre had a more consequential effect on presence than the visualization choice: the 2D platformer produced markedly higher perceived possible actions than the 3D exploration variants.
- Scenario significantly affected the self-location dimension of spatial presence, with the first-person variant lacking a gaze rectangle scoring highest, though pairwise differences were limited.
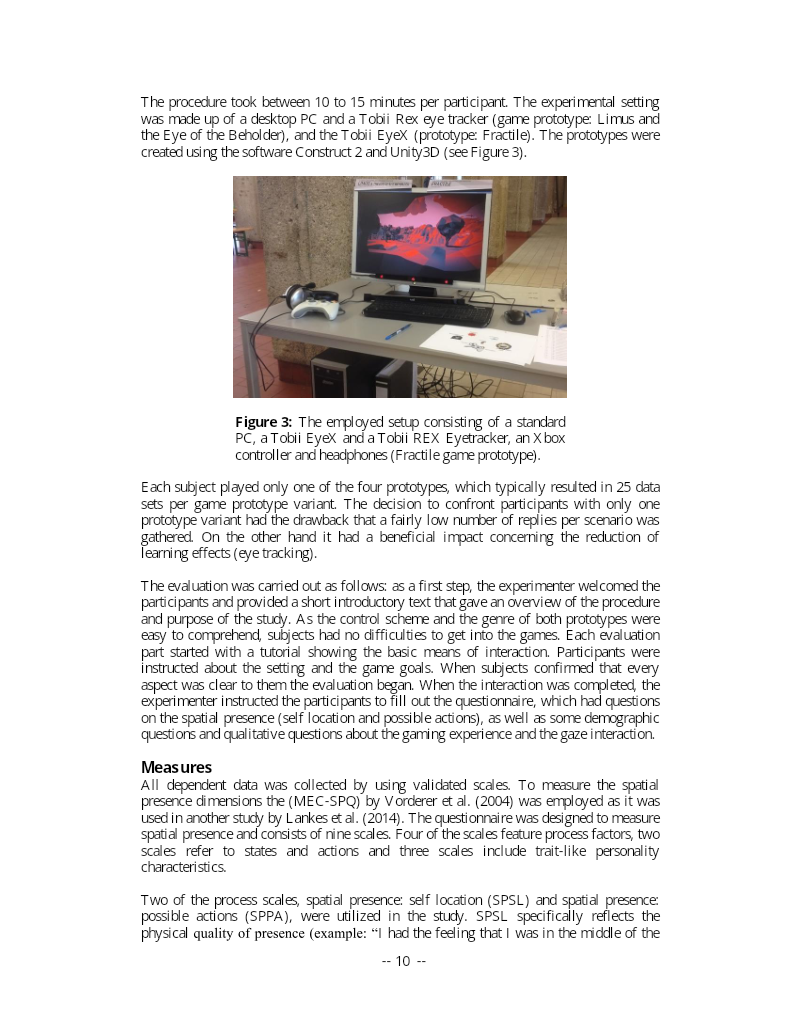
- A visible white gaze-position rectangle initially reduced spatial presence, but players adapted to it over time, suggesting a learning effect.
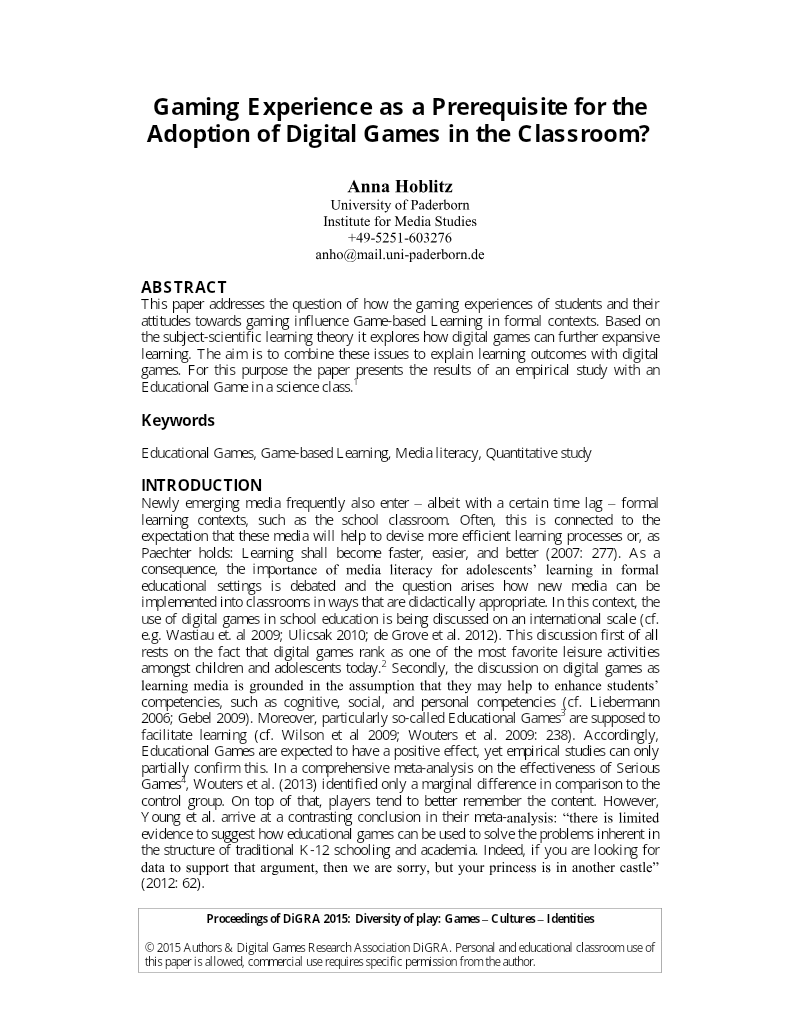
Gaming Experience as a Prerequisite for the Adoption of Digital Games in the Classroom?
This study, presented as a 2015 DiGRA paper by Anna Hoblitz, asks whether students' prior gaming experience and their attitudes toward educational games shape how well they learn from them.
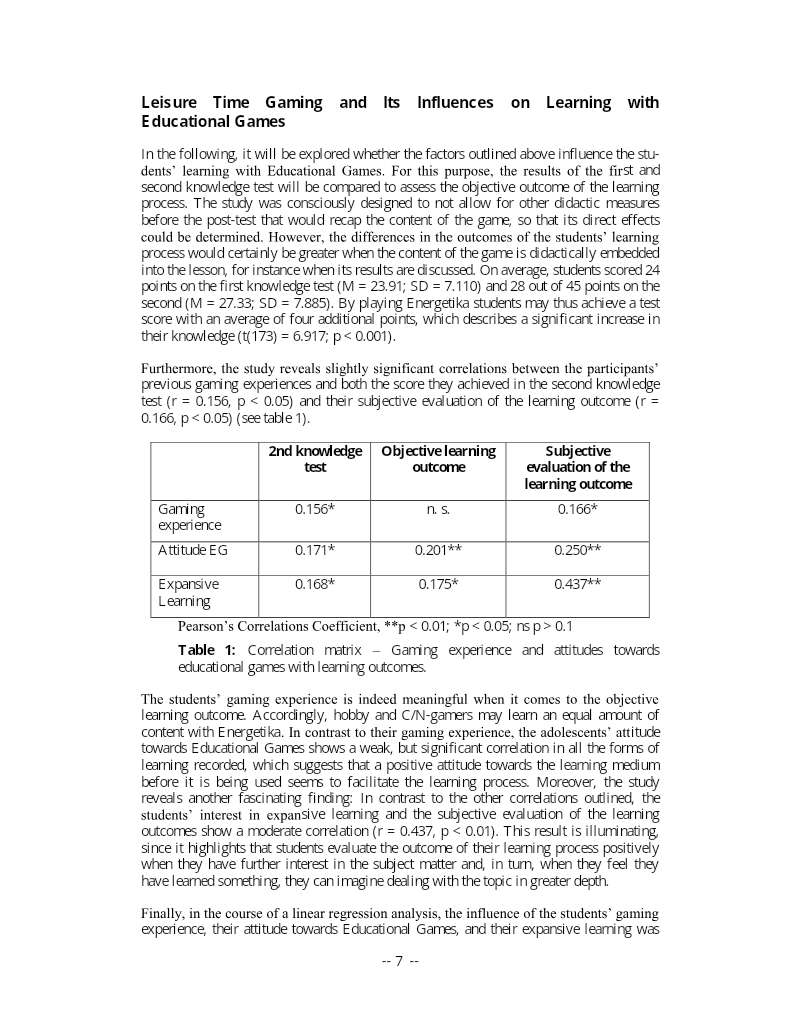
- Gaming experience did not significantly predict objective learning outcomes; prior experience showed only weak correlations with the second knowledge test (r = 0.156) and with subjective learning evaluations (r = 0.166).
- Disposition mattered more than familiarity: attitudes toward educational games correlated weakly but significantly with all learning measures, and sustained interest in the topic (expansive learning) correlated moderately with subjective learning evaluations (r = 0.437).
- Hobby gamers were more critical of educational games than casual players despite their greater gaming experience.
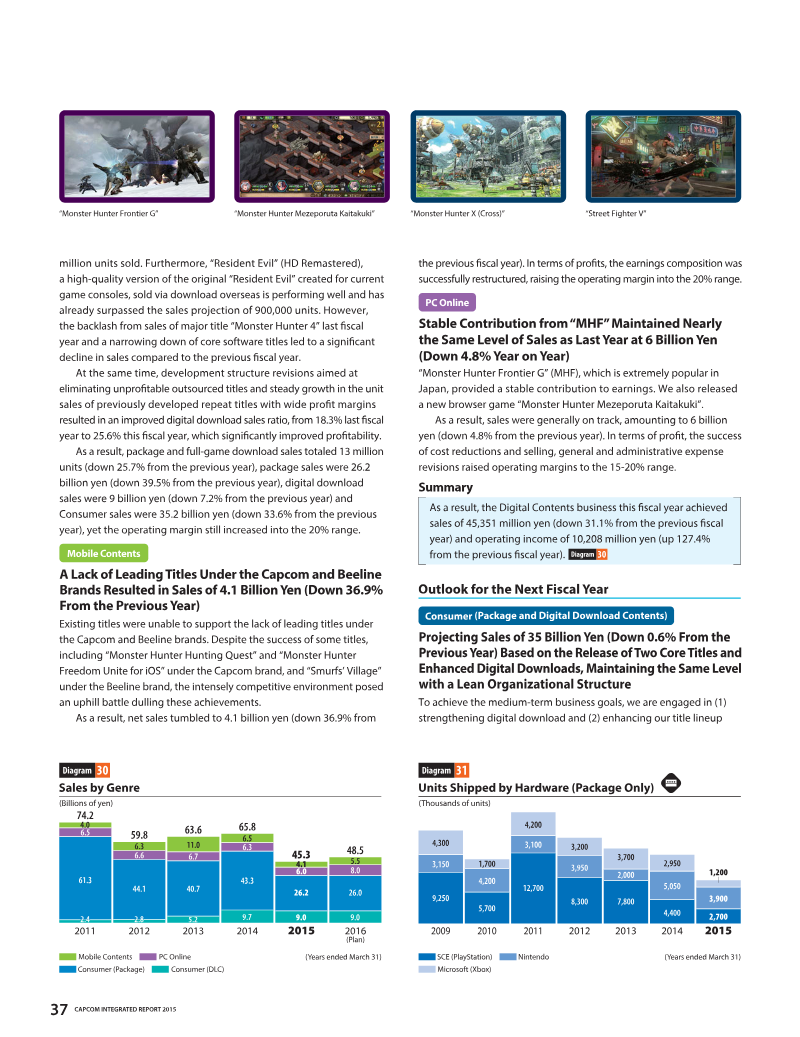
Capcom Integrated Report 2015
The 2015 Capcom Integrated Report details a strategic pivot toward long-term sustainability and profitability through the "Single Content Multiple Usage" model.
- Capcom targeted a 20% operating margin by 2018 by shifting toward a 'Single Content Multiple Usage' strategy that leverages in-house IP across console, mobile, and PC platforms.
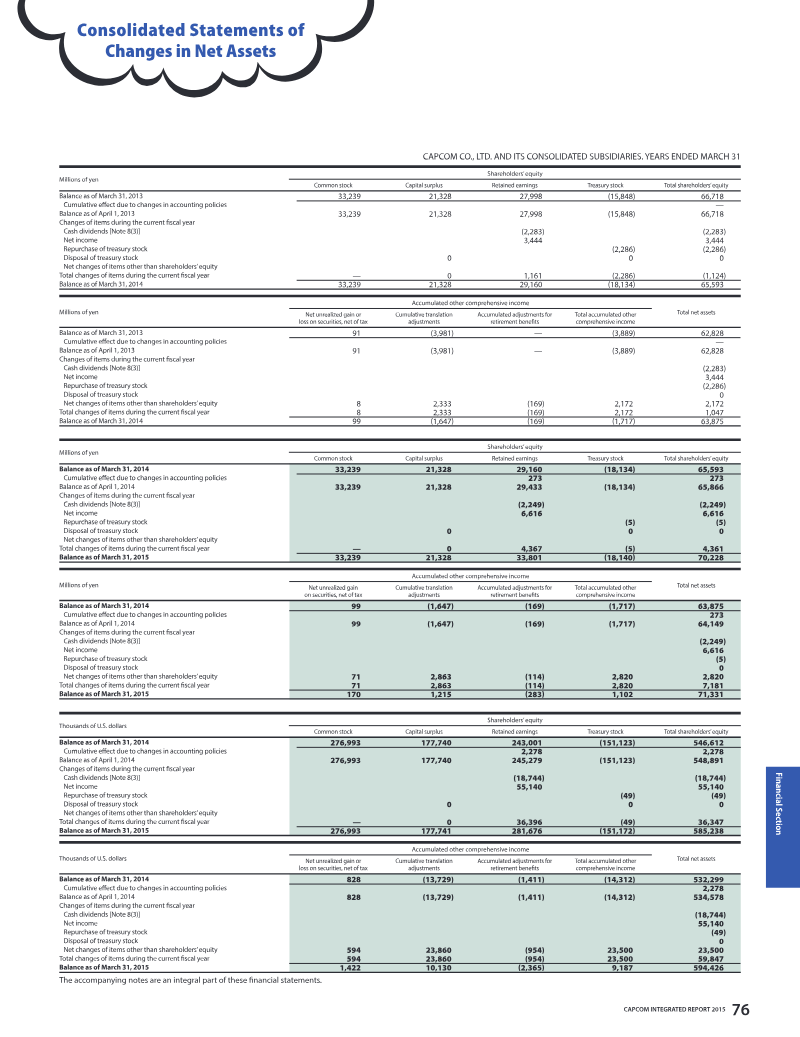
- Despite a 37.1% decline in net sales to 64,277 million yen in fiscal 2015, net income nearly doubled to 6,616 million yen due to organizational restructuring and reduced R&D costs.
- The company achieved a 16.5% operating margin in 2015 by prioritizing high-margin digital downloads and improving overall cost management.
Casual Games Sector Report: Southeast Asia 2015
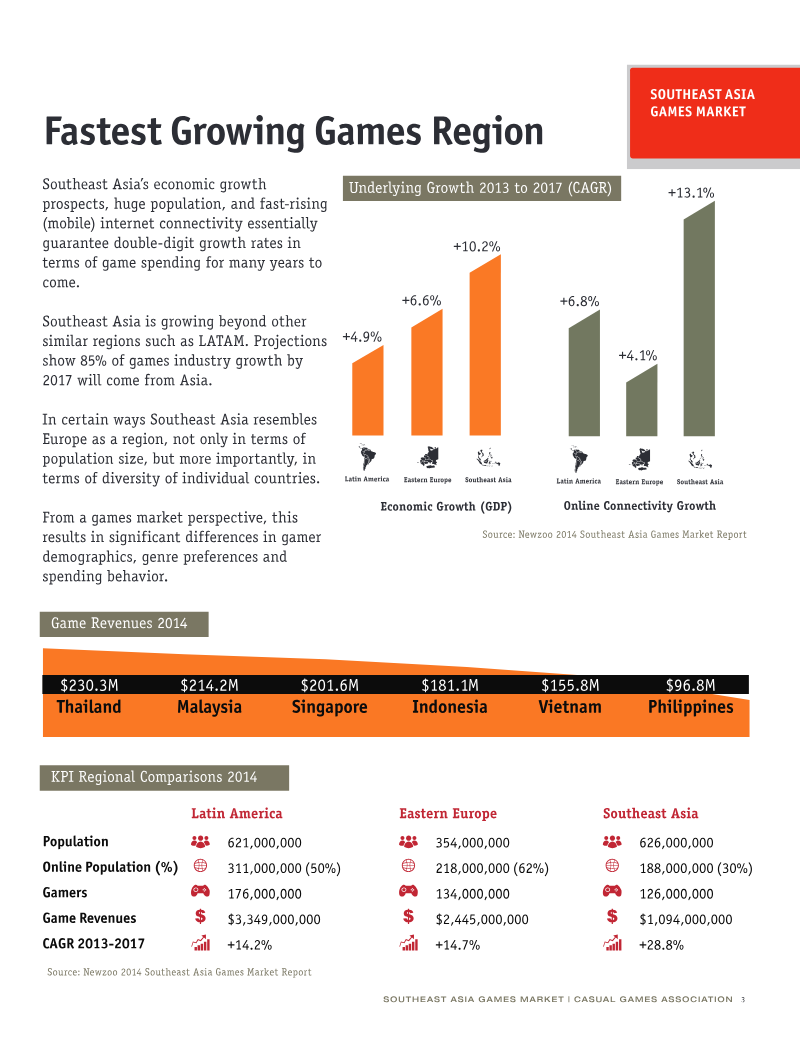
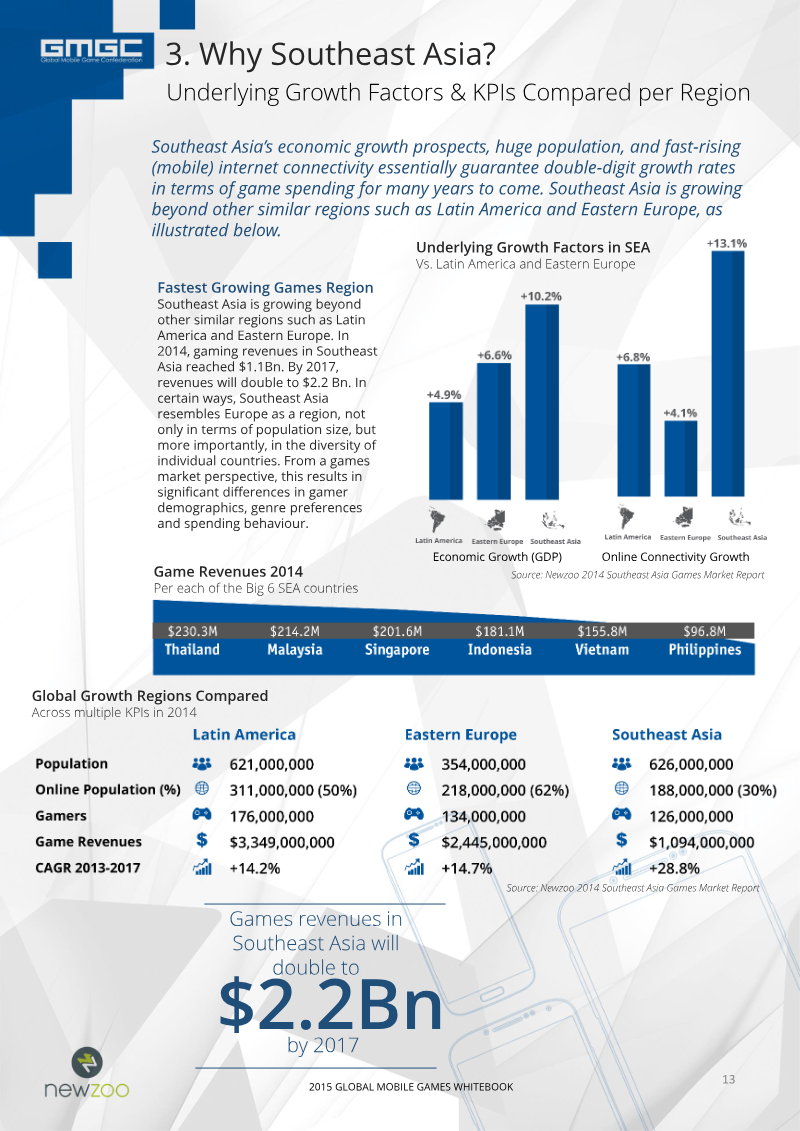
The Southeast Asia games market is positioned as a primary growth engine for the global industry, with total regional revenues projected to double to $2.2 billion by 2017.
- The Southeast Asia games market is projected to reach $2.2 billion in revenue by 2017, growing at a compound annual rate of 28.8%.
- Mobile gaming is the dominant sector across the region, with Western titles from publishers like King and Supercell consistently ranking among the top-grossing applications.
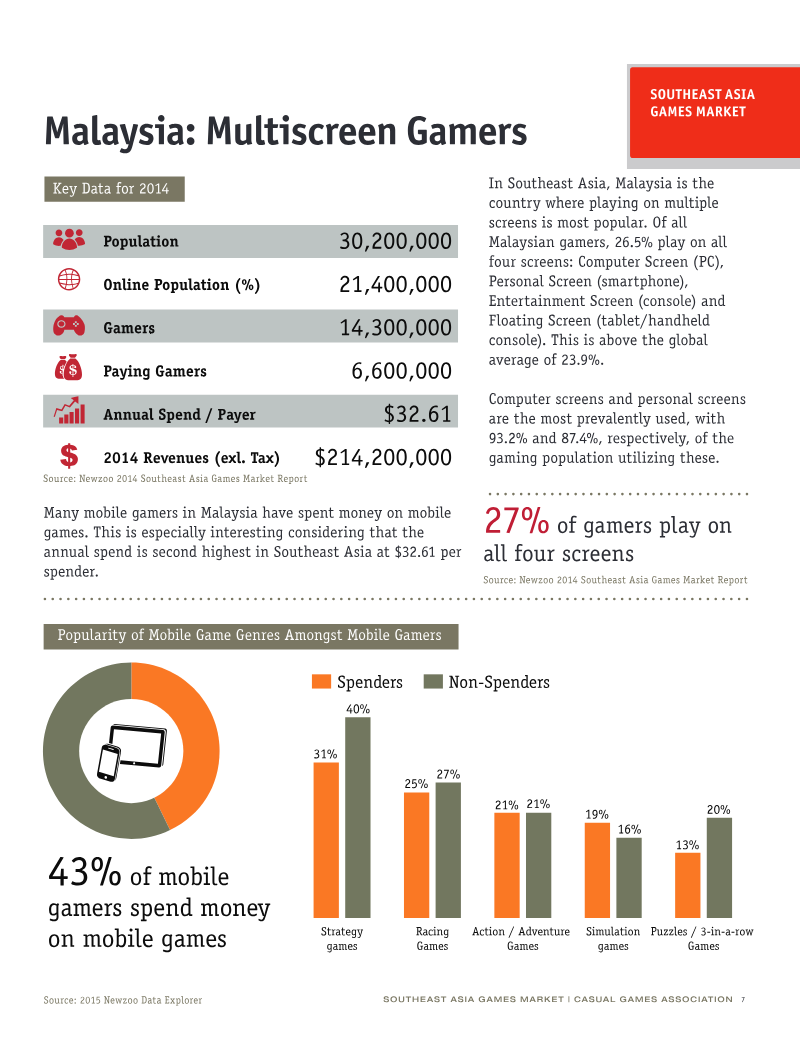
- Thailand currently generates the highest total game revenue in the region, while Singapore leads in monetization with an average annual spend of $189.30 per payer.

The Mobile Gaming Landscape 2015
The global mobile gaming market underwent a transformative expansion in 2015, surpassing $30 billion in total revenue as the industry transitioned from isolated platform silos toward a unified, cross-platform consumption model.
- The global mobile gaming market surpassed $30 billion in revenue in 2015, driven by a transition toward unified, cross-platform ecosystems.
- High-profile industry consolidation, such as Activision Blizzard’s acquisition of King, marks a shift toward integrated gaming business models.
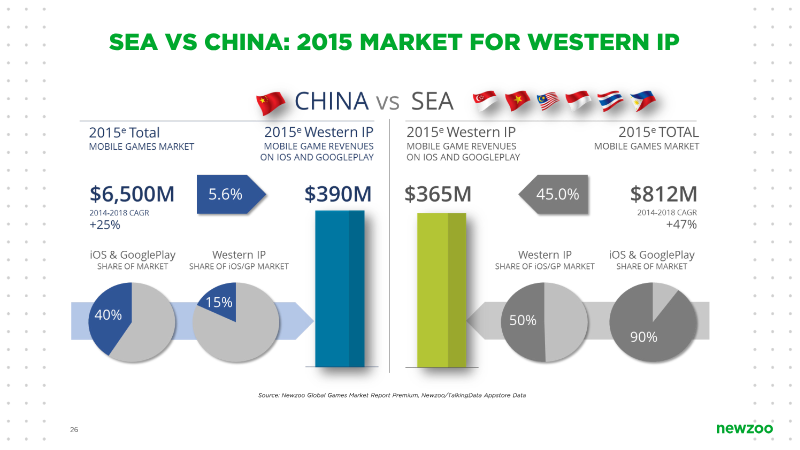
- The Chinese market remains distinct and highly competitive, requiring developers to navigate a fragmented Android ecosystem and numerous local app stores dominated by Tencent and NetEase.

Global Mobile Game Industry White Book: 2015
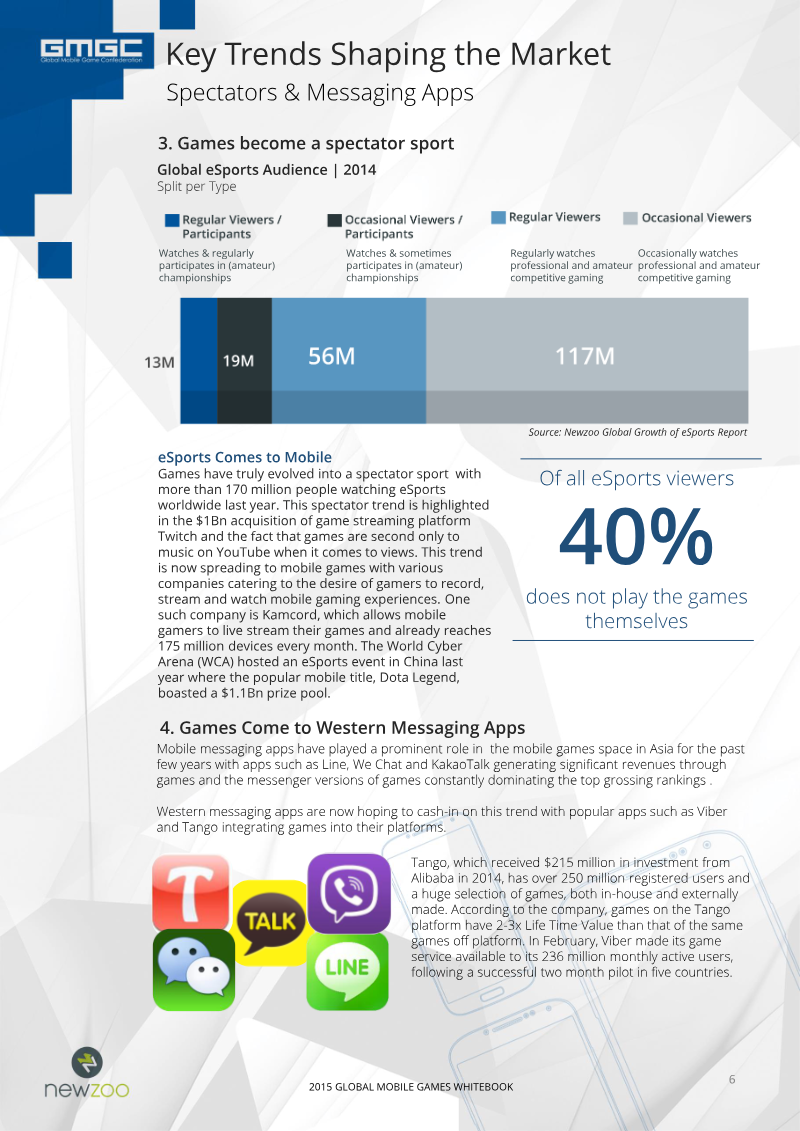
The global mobile gaming industry is undergoing a transformative shift, positioning itself as the dominant force within the broader interactive entertainment sector.
- The global mobile gaming market is projected to reach $30.1 billion in revenue in 2015, establishing itself as the dominant sector in interactive entertainment.
- China serves as a high-engagement market where users spend an average of 35 minutes daily on mobile games, primarily favoring card and role-playing genres.
- Southeast Asia is a rapidly maturing market expected to double its revenue by 2017, providing a strategic entry point for Western publishers due to standardized app store infrastructure.
Casual Games Sector Report 2015: World's Top Games Markets
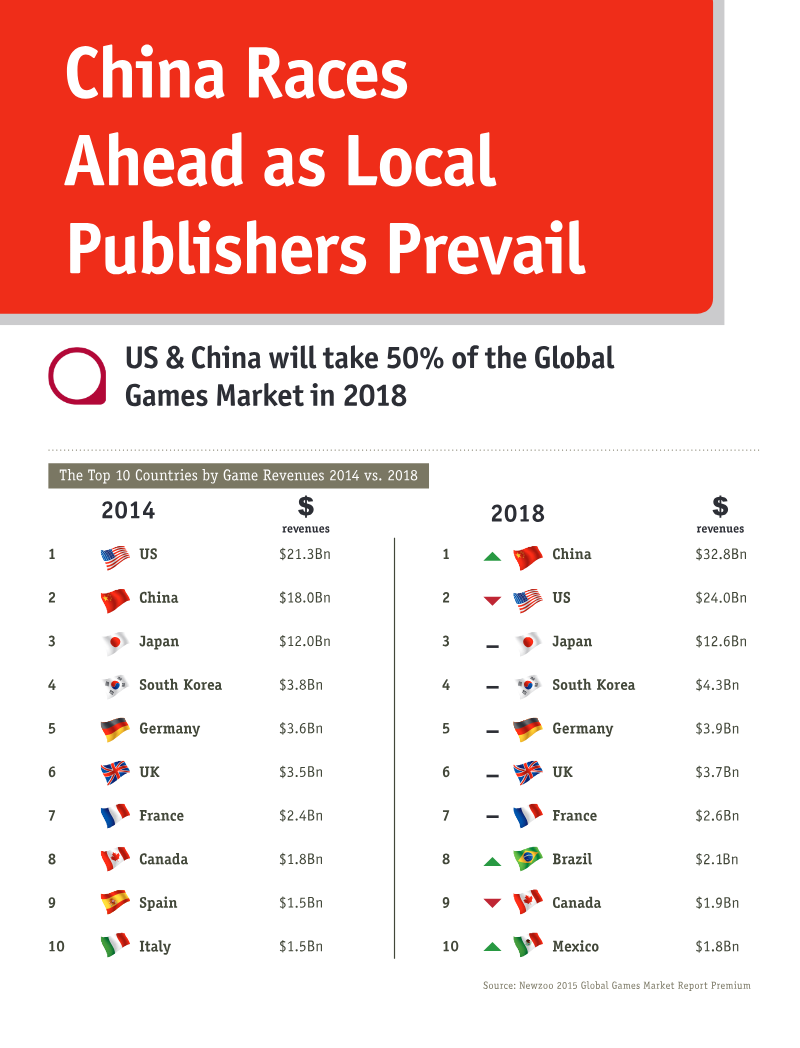
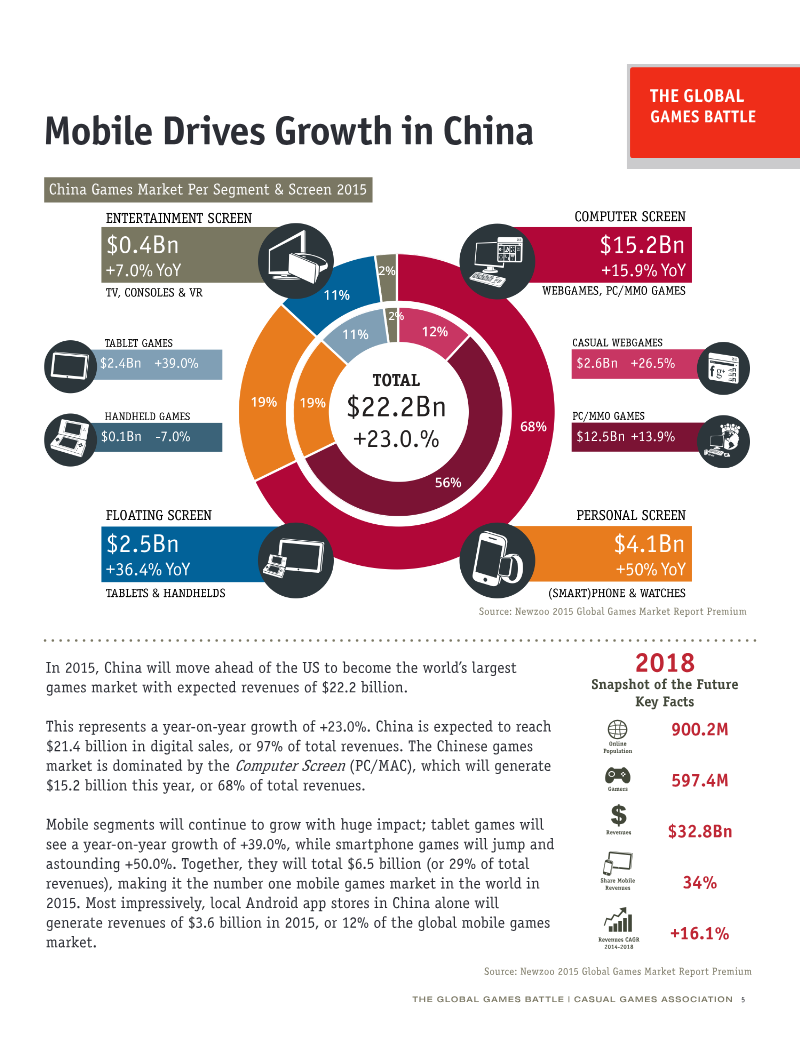
The 2015 Casual Games Sector Report provides a comprehensive analysis of the global games market, focusing on the shifting dominance between the United States and China.
- As of 2015, China surpassed the United States as the world's largest games market, with the two nations projected to account for 50% of global revenue by 2018.
- China’s games market reached $22.2 billion in 2015, marking a 23% year-on-year increase driven by a 50% growth rate in the smartphone gaming segment.
- The US market generated $22.0 billion in 2015, with 45% of its total revenue derived from TV, console, and VR platforms.

Kondycja Polskiej Branży Gierwideo Raport 2015
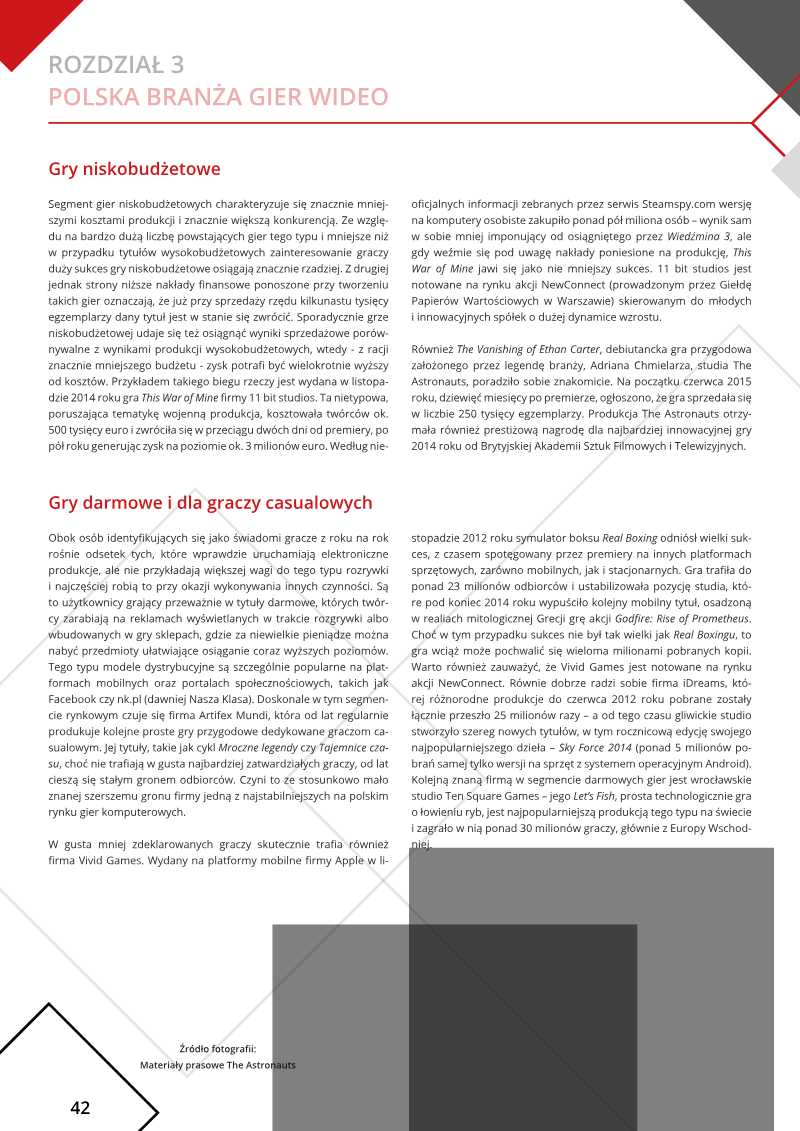
The 2015 analysis of the Polish video game industry provides a comprehensive overview of a sector undergoing rapid structural transformation.
- The global games market in 2015 was valued at $74.2 billion, with mobile games ($22.3 billion) and retail sales ($19.7 billion) being the largest segments.
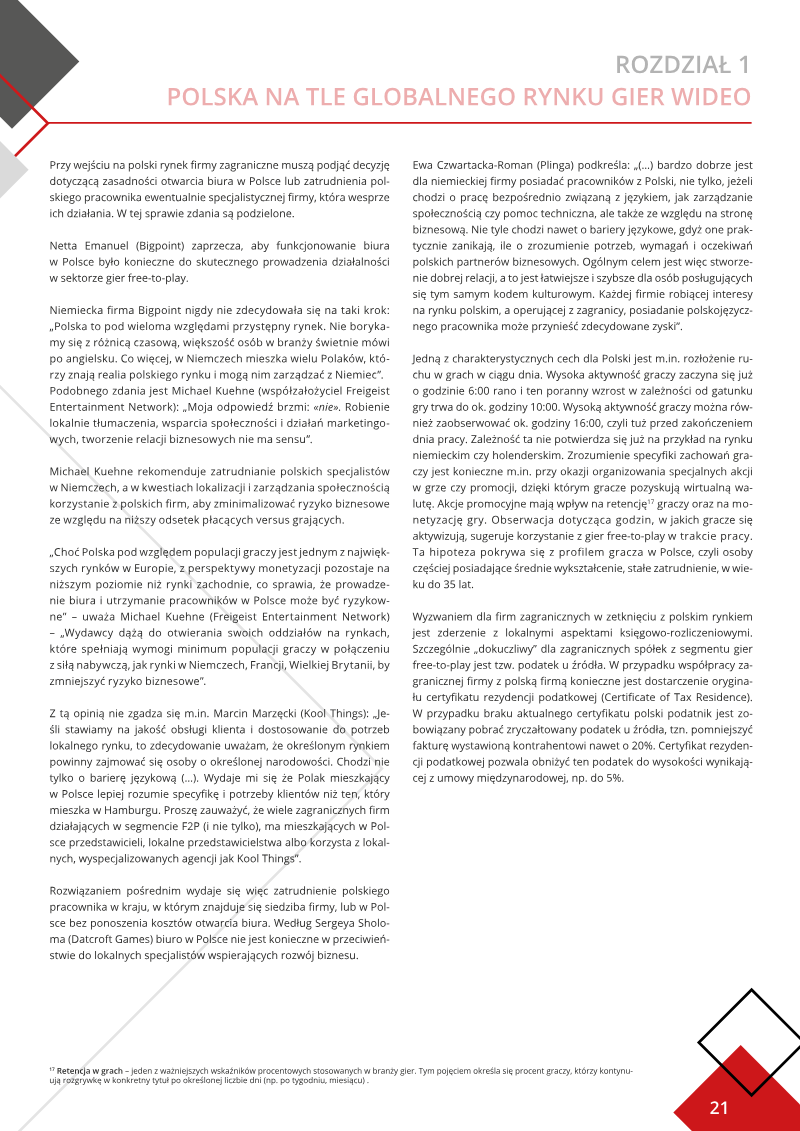
- In Poland, 72% of internet users play games. 42% play games installed on computers, 40% play on smartphones/tablets, and 38% play browser games.
- Action games are the most popular genre among Polish players, accounting for 35% of page views on GRY-OnLine.pl in the first half of 2015.
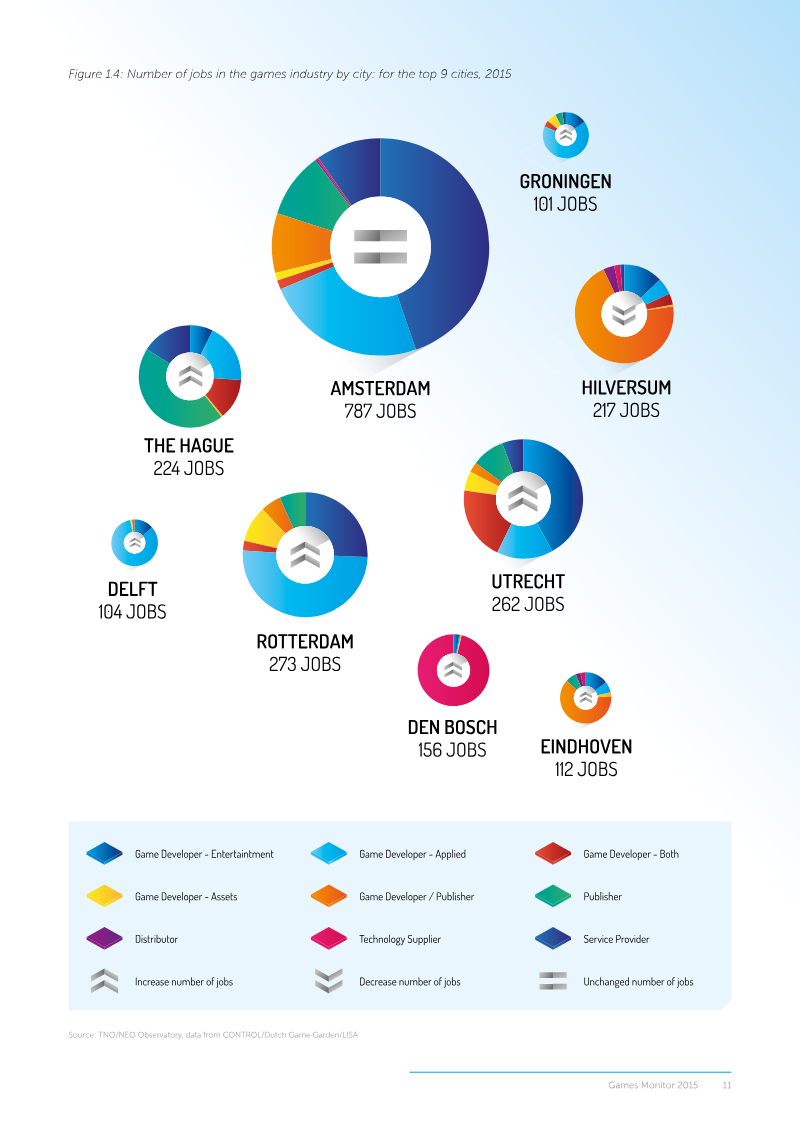
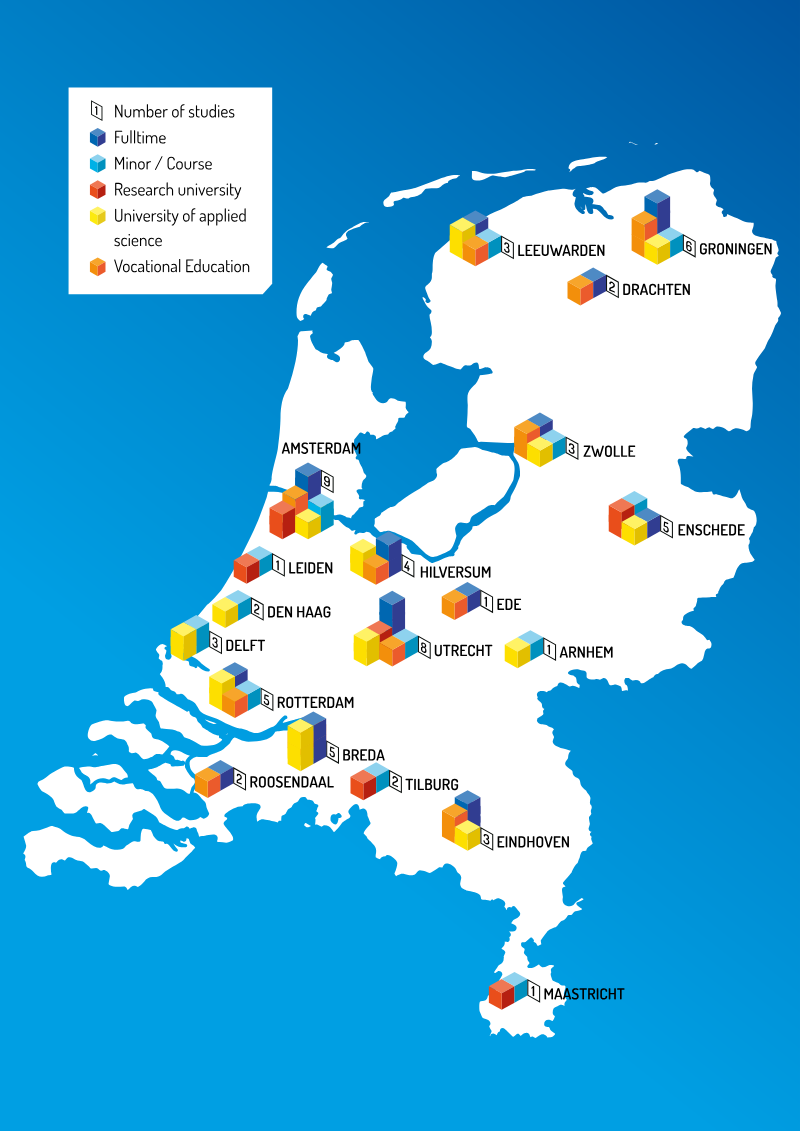

Dutch Games Monitor: The Netherlands 2015
The Dutch games industry underwent a period of rapid expansion between 2011 and 2015, characterized by a 42 percent increase in the number of firms to 455 companies.
- The Dutch games industry saw its number of professionals grow from 2730 in 2011 to 3030 in 2015, an annual job growth of 2.6%, which is above the national average of -0.4% for the same period.
- Over half of Dutch game companies are less than 5 years old, and the average company size is 7 employees, indicating a young industry dominated by small studios.
- Access to funding, availability of qualified staff, and sales are the top three challenges for Dutch game companies, with over 40% reporting issues in obtaining funds.
Dutch Games Monitor: Main Facts & Figures 2015
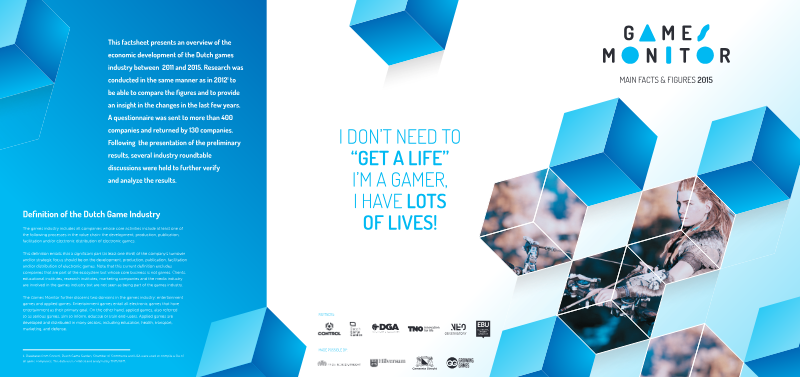
The Dutch Games Monitor 2015 factsheet charts the economic development of the Dutch games industry from 2011 to 2015, using the same method as the 2012 edition so the figures can be compared.
- The Dutch games industry grew by 42% between 2011 and 2015, increasing from 320 to 455 companies, though the sector remains dominated by micro-enterprises with an average of only seven employees.
- Total industry employment grew from 2,730 to 3,030 professionals, a slower rate of expansion than company formation, highlighting the difficulty studios face in scaling operations.
- Financial performance across the industry is modest, with the majority of companies reporting annual profits of less than €100,000.

MTG Corporate Responsibility Report 2015
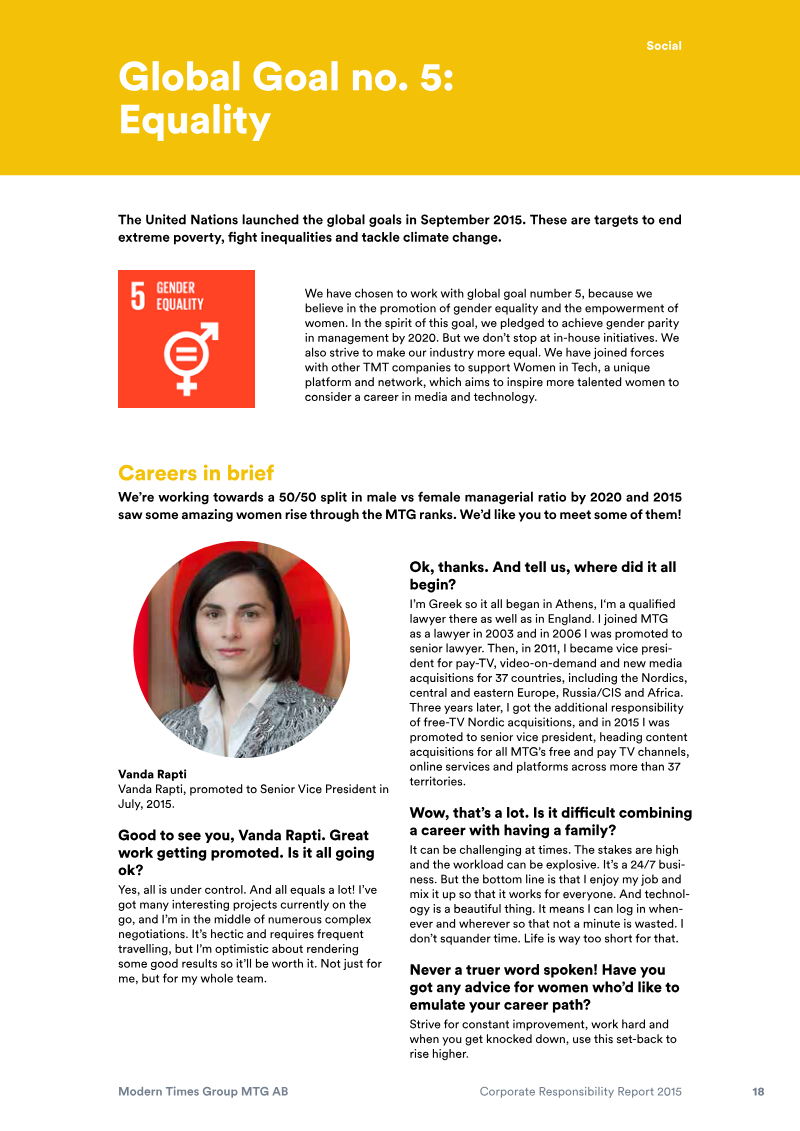
In 2015 the media group placed corporate responsibility at the core of its strategy, integrating ethical governance, sustainability and gender-parity objectives across a global operation that spans 165 countries and includes broadcast, content localisation and e-sports segments.
- MTG achieved a 96% compliance rate among 514 new hires across 38 nationalities regarding its unified code of conduct, anti-bribery, and whistle-blower policies.
- Total carbon emissions increased by 13% since 2010, with business travel accounting for 61% of the company's total emissions footprint.
- The company maintained a 95C rating on the Dow Jones Sustainability Index and a 95C CDP disclosure score for the third consecutive year.