Skip to main content
Game Industry
Library
Library
Search
Ask AI
News
Connect your AI
Browse
The Catch Up
Topics
Collections
Writers
Help
Subscribe
Game Industry
Library
Library
Search
Ask AI
Saved
Library
15 reports matching your filters
All Types
Reports
Articles
Presentations
Whitepapers
Financial
Legal
Other
Search
Casual
Mobile
Global
Market Analysis
Monetization
User Acquisition
Marketing
Advertising
Retention
Game Design
Player Behavior
Live Ops
Midcore
Creative Ads
Game Development
Germany
PC
USA
Clear
Filters
1
Casual
Recently added
Newest first
Oldest first
Title A–Z
Title Z–A
Report
26 pages
Mobile Gaming: Casual
Casual mobile gaming is shifting toward higher revenue per user, with IAP revenue projected to grow from $16.8 billion to $22.9 billion by the end of 2025 despite a fluctuating download volume.
Market leaders demonstrate divergent monetization strategies: Royal Match ($540M) and Monopoly Go! ($431M) rely exclusively on IAPs, while Candy Crush Saga ($421M) successfully integrates advertising.
Playrix’s portfolio approach, utilizing a suite of titles like Township and Gardenscapes, generated a combined $554 million, proving the effectiveness of hybrid monetization and established franchise management.
Market Analysis
Monetization
Marketing
+3
Gamesforum
Report
2 pages
Game no Yakusoku Communication Book
Modern gaming requires a shift from rigid, top-down restrictions to a collaborative rule-setting process that evolves alongside a child’s developmental maturity.
The transition from localized, offline play to global, interconnected online environments has increased the complexity of social dynamics and safety risks for children.
Effective family gaming agreements must be flexible enough to account for the realities of real-time online events and social gaming commitments.
Player Behavior
Japan
Social Metaverse
+1
CESA – Computer Entertainment Supplier's Association
Report
10 pages
Q4 2025 Investor Presentation
The company achieved Q4 2025 net sales of SEK 3,123 million, marking 8% organic growth and a 108% year-over-year increase in constant currency.
Adjusted EBITDA for Q4 2025 reached SEK 717 million with a 23% margin, supported by an unlevered free cash flow of SEK 878 million.
User acquisition spending surged to 38% of revenue in Q4, representing a 98% year-over-year increase driven by the integration of Plarium and scaling of casual and racing franchises.
Market Analysis
Monetization
User Acquisition
+5
Modern Times Group
Report
12 pages
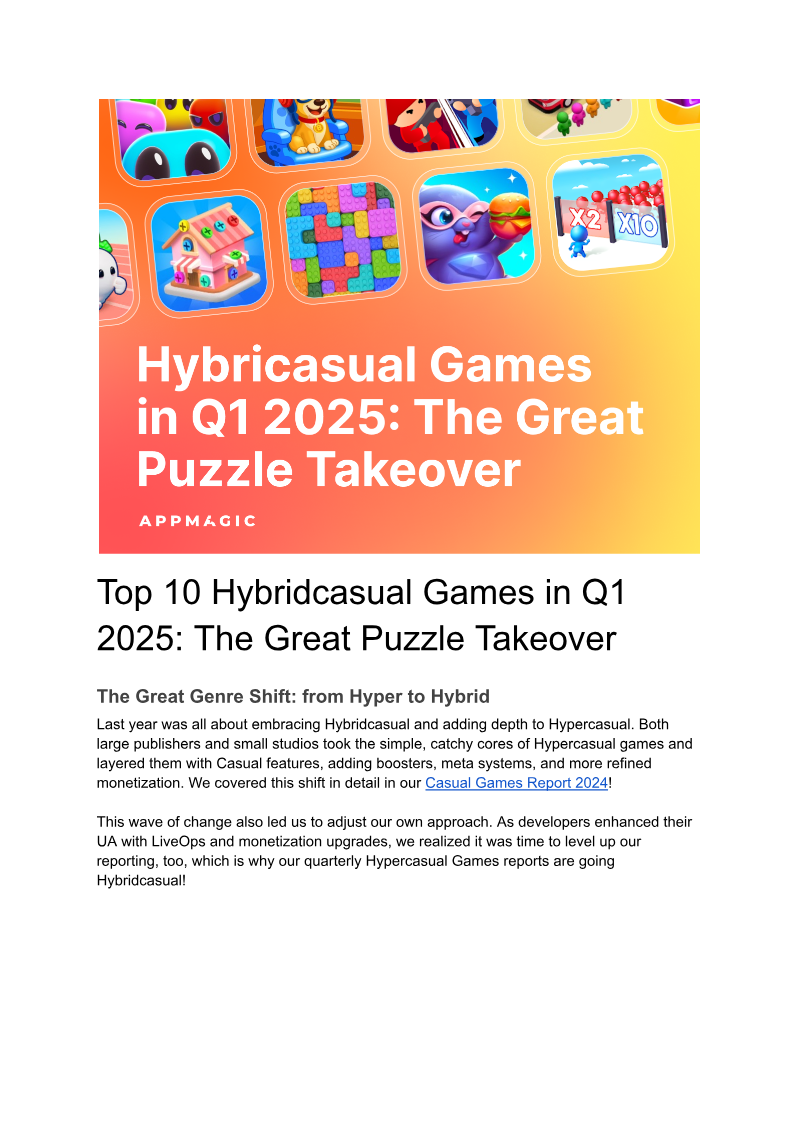
Top 10 Hybridcasual Games in Q1 2025: The Great Puzzle Takeover
The top ten hybrid-casual games generated $87 million in net IAP revenue in Q1 2025, marking a 67 percent year-over-year increase.
Puzzle and arcade titles dominate the hybrid-casual market, collectively accounting for over 90 percent of total earnings with a 48 percent and 45 percent revenue share, respectively.
Block-puzzle games lead the puzzle category with 71 percent of revenue, while sort-puzzle titles experienced the fastest growth, increasing 5.6 times year-over-year.
Market Analysis
Monetization
Mobile
+2
AppMagic
Jan 2025
Report
25 pages
Mobile Casual Benchmarks Report 2025
Hybrid casual games are significantly more profitable than hypercasual models, with top subgenres like Merge 3, Luck Battle, and Life Simulator achieving ARPU figures between $11.08 and $14.83.
Pure hypercasual and simulation games suffer from poor long-term sustainability, characterized by low 30-day retention rates of approximately 3% and an ARPU of only $0.79.
Merge 3 games demonstrate high player engagement, leading all subgenres with an average session duration of 656 seconds.
Market Analysis
Player Behavior
Retention
+2
Appodeal
Jan 2025
Report
40 pages
2024 Casual Gaming Apps Report
The casual gaming market is shifting from hyper-casual titles toward hybrid-casual and 3D match models, with 3D Match category market share on US iOS increasing fivefold between April 2023 and April 2024.
Developers are increasingly bypassing app store fees by adopting proprietary web stores and engagement-linked offers, a strategy now utilized by 70% of top-performing US casual games.
User acquisition costs are highly bifurcated, with iOS installs averaging $4.83 compared to $0.65 on Android, though iOS maintains a superior Day 7 return on ad spend.
Market Analysis
Monetization
Live Ops
+3
Liftoff
Apr 2024
Report
25 pages
The State of Mobile Gaming in India: 2023
India’s mobile gaming market is projected to reach a value of $8.6 billion by 2027, supported by a user base of over 600 million active players.
In-app purchase revenue in the Indian mobile gaming sector is forecasted to reach $284 billion by 2026.
Retention is critical for profitability, as acquiring new customers is five times more expensive than retaining existing ones.
Market Analysis
Mobile
Casual
+5
AppsFlyer
Jan 2023
Report
36 pages
2023 Casual Gaming Apps Report
Casual gaming now accounts for 74% of all mobile game installs and drives nearly 75% of mid-core game installations.
Developers are shifting from volume-based user acquisition to hybrid models that blend ad-based revenue with in-app purchases to extend player lifecycles.
North America remains the most expensive market with a $3.59 cost per install, yet it maintains a high 8.1% return on ad spend.
Market Analysis
User Acquisition
Monetization
+3
Liftoff
Jan 2023
Report
16 pages
The Highest-Grossing Mobile Games on iOS & Android: Q2 2022 Report & Infographics
Mid-core games emerged as the highest-grossing genre in Q2 2022, underscoring the sector's dominance in mobile revenue generation.
King was the top-earning publisher for the quarter with over $264 million in aggregate revenue, followed by Lilith Games at $254.6 million and Playrix at $182.8 million.
Rise of Kingdoms by Lilith Games led iOS revenue with over $179.5 million, while Candy Crush Saga topped Android charts with more than $122 million.
Market Analysis
Mobile
Global
+2
Apptica
Jun 2022
Report
33 pages
Casual Gaming Trends Snapshot Report
Every top-100 casual game released in the last two years now incorporates renovation elements to drive visual progression and player satisfaction.
The integration of construction mechanics in top Match3 games has surged from 7% to 49% over the past six years.
70% of top-grossing Match3 titles currently utilize hybrid designs that blend core puzzle mechanics with complex meta-layers like RPG elements or collectibles.
Market Analysis
Global
Casual
+1
GameRefinery
Mar 2022
Report
33 pages
Casual Gaming Trends Snapshot Report March 2022
By early 2022, 70% of top-100 grossing Match3 games incorporated meta-elements, a massive increase from less than 10% six years prior.
Renovation and construction mechanics have become industry standard, appearing in every top-100 grossing casual game released between 2020 and 2022.
The integration of construction features in top Match3 games surged to 49% in 2022, up from just 7% in 2016.
Market Analysis
Mobile
Casual
+2
GameRefinery
Mar 2022
Report
34 pages
Casual Gaming Apps Report 2022
Mobile gaming maintains over 60% of the total industry market share despite experiencing its first year-over-year global spending decline in Q1 2022.
Android is significantly more cost-effective for user acquisition than iOS, with an average CPI of $0.75 compared to $2.27, while both platforms deliver comparable Day 30 ROAS.
Lifestyle games are the most lucrative segment for developers, yielding the highest returns despite carrying higher-than-average acquisition costs.
Market Analysis
Global
Mobile
+1
GameRefinery
Jan 2022
Report
20 pages
Match3 Genre Snapshot: US iOS (May 2021)
As of May 2021, the Match3 subgenre accounts for approximately 16% of total US iOS mobile gaming revenue.
No new Match3 titles entering the top 500 grossing rankings over the last 18 months utilize standard swapping mechanics, indicating a shift toward gameplay diversification.
Modern Match3 success is increasingly driven by meta-layers, specifically decoration and customization features seen in titles like Royal Match and Project Makeover.
Market Analysis
Monetization
Live Ops
+5
GameRefinery
May 2021
Report
28 pages
Casual Gaming Apps Report: The State of Play in 2021
Casual gaming user acquisition costs rose significantly between March 2020 and February 2021, with the average cost-per-install (CPI) increasing 45.2% year-over-year to $1.96.
Return-on-ad-spend (ROAS) for casual games declined by 7.5 percentage points to 29.6% by Day 30, signaling a tightening market for profitability.
Android CPIs surged 120% as marketers shifted strategies ahead of iOS privacy changes, though iOS remains more expensive with an average CPI of $4.30 compared to $1.15 on Android.
Market Analysis
Global
Mobile
+2
Liftoff
Jan 2021
Report
20 pages
Match3 Genre Snapshot Report May 2021 (2021)
As of mid-2021, the Match3 subgenre is the largest segment of the US iOS mobile gaming market, generating approximately 16% of total revenue.
Every new Match3 title that entered the top 500 grossing rankings between late 2019 and early 2021 retained traditional swapping mechanics, confirming that core gameplay innovation is less critical than secondary feature integration.
Success in the modern market is driven by meta-layers like customization and decoration, as evidenced by the performance of titles such as Royal Match and Project Makeover.
Market Analysis
Mobile
Puzzle
+2
GameRefinery
Jan 2021