Square
Company
Documents about Square
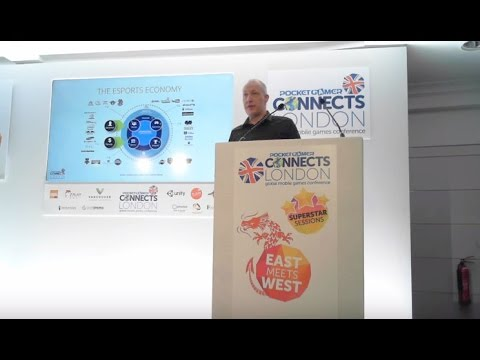
How big will eSports and mobile eSports be in 2016?
The global eSports market is experiencing rapid expansion, driven by a shift in consumer behavior where gaming has evolved from a solitary activity into a spectator-led entertainment ecosystem.
- The eSports market is projected to reach a billion-dollar valuation by 2019, growing from a current economic value of approximately $3.50 per fan.
- The industry is professionalizing through significant capital investment from traditional sports and media entities, including Turner and Madison Square Garden.
- Mobile eSports is a primary growth driver, as it facilitates seamless transitions between playing and spectating by integrating video content directly into game design.
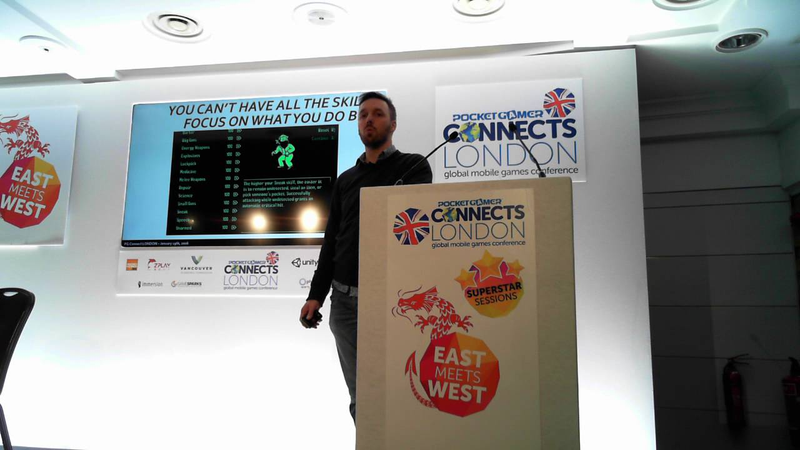
Square Enix Montreal on the hard learnings going from console to mobile success
Square Enix Montreal’s transition from a large-scale console developer to a successful mobile publisher serves as a case study in the necessity of organizational agility and strategic focus.
- Platform store discovery drives over 50 percent of user acquisition, significantly outperforming traditional media and social channels.
- Securing 'Editor’s Choice' or 'Game of the Year' status on app stores can triple revenue compared to standard featuring while generating millions of additional impressions.
- Transitioning from console to mobile requires hiring for a mobile-first mindset, as console-hardened developers often struggle with the leaner, iterative development cycles required for mobile.
2016 Annual Report
Square Enix achieved record financial performance for the fiscal year ended March 31, 2016, characterized by a 27.5% increase in net sales to ¥214,101 million and a 102.3% surge in profit attributable to owners of the parent.
- Net sales for the fiscal year ended March 31, 2016, exceeded ¥200 billion for the first time, reaching ¥214,101 million, a 27.5% increase from the prior fiscal year, and operating income increased by 58.4% to ¥26,018 million.
- The MMO domain, specifically "DRAGON QUEST X" and "FINAL FANTASY XIV," generated stable earnings, with new content and expansion packs released in the fiscal year ended March 2016 successfully retaining and attracting players.
- The Amusement Business Segment saw brisk performance with year-on-year existing revenue topping 100%, driven by strong demand from foreign tourists, especially from Asia, and the successful rollout of an e-money system.
Square Enix Holdings Financial Results Briefing: Six-Month Period Ended September 30, 2015
Square Enix Holdings reported strong financial growth for the six-month period ending September 30, 2015, characterized by increased net sales and improved operating margins.
- Square Enix reported consolidated net sales of ¥86.4 billion for the six-month period ending September 30, 2015, a year-over-year increase of ¥13.2 billion.
- Operating income rose by ¥4.1 billion to ¥12.6 billion, with the operating margin improving by 3 percentage points to 15%.
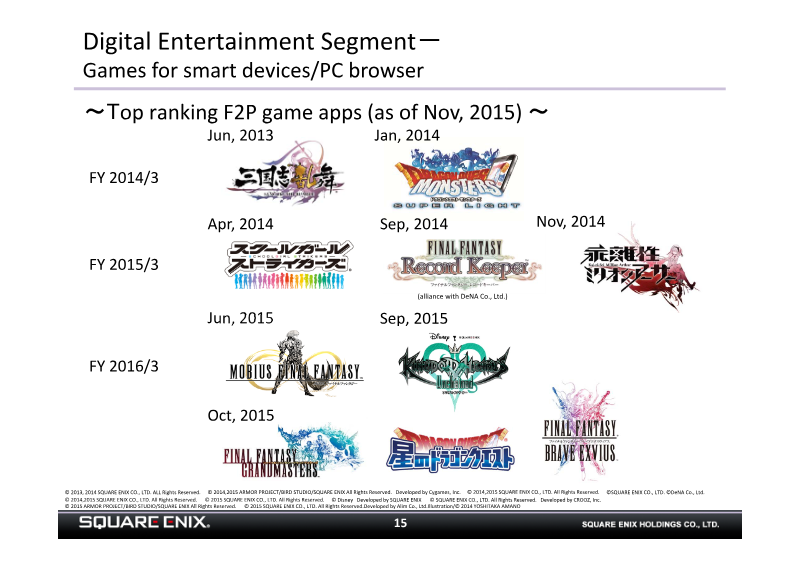
- The Digital Entertainment segment served as the primary earnings driver, generating ¥60.2 billion in net sales through strong performance in MMO expansion packs and smart device/PC browser games.
Square Enix Holdings Financial Results: Six-Month Period Ended September 30, 2015
Square Enix Holdings reported strong financial growth for the six-month period ending September 30, 2015, driven primarily by the performance of its Digital Entertainment segment.
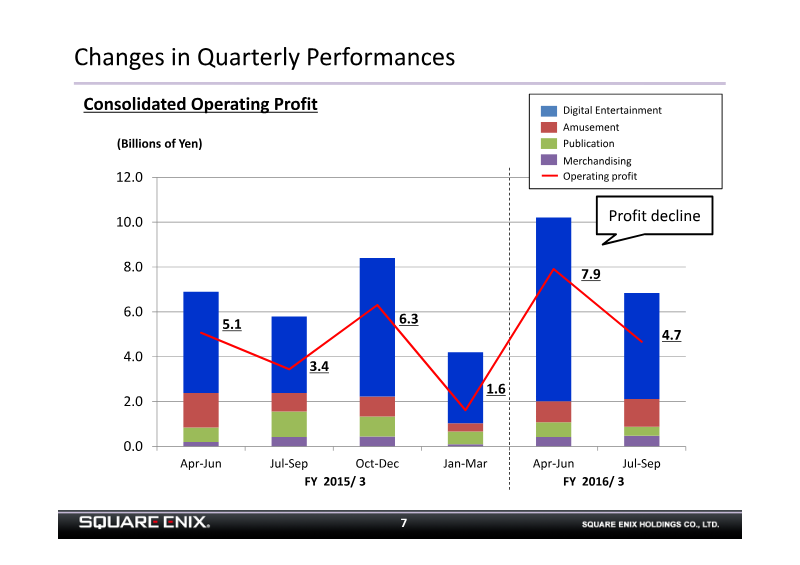
- Square Enix reported consolidated net sales of 86.4 billion yen and an operating income of 12.6 billion yen for the six-month period ended September 30, 2015, representing a year-over-year increase of 13.2 billion yen in sales and 4.1 billion yen in operating income.
- The Digital Entertainment segment remains the primary revenue driver, contributing 60.2 billion yen in net sales and 12.9 billion yen in operating income, with an operating margin of 21.5%.
- Quarter-over-quarter operating profit declined due to a reactionary drop in MMO expansion disc sales, losses on the evaluation of smart device and PC browser game content, and increased advertising expenses for HD games.
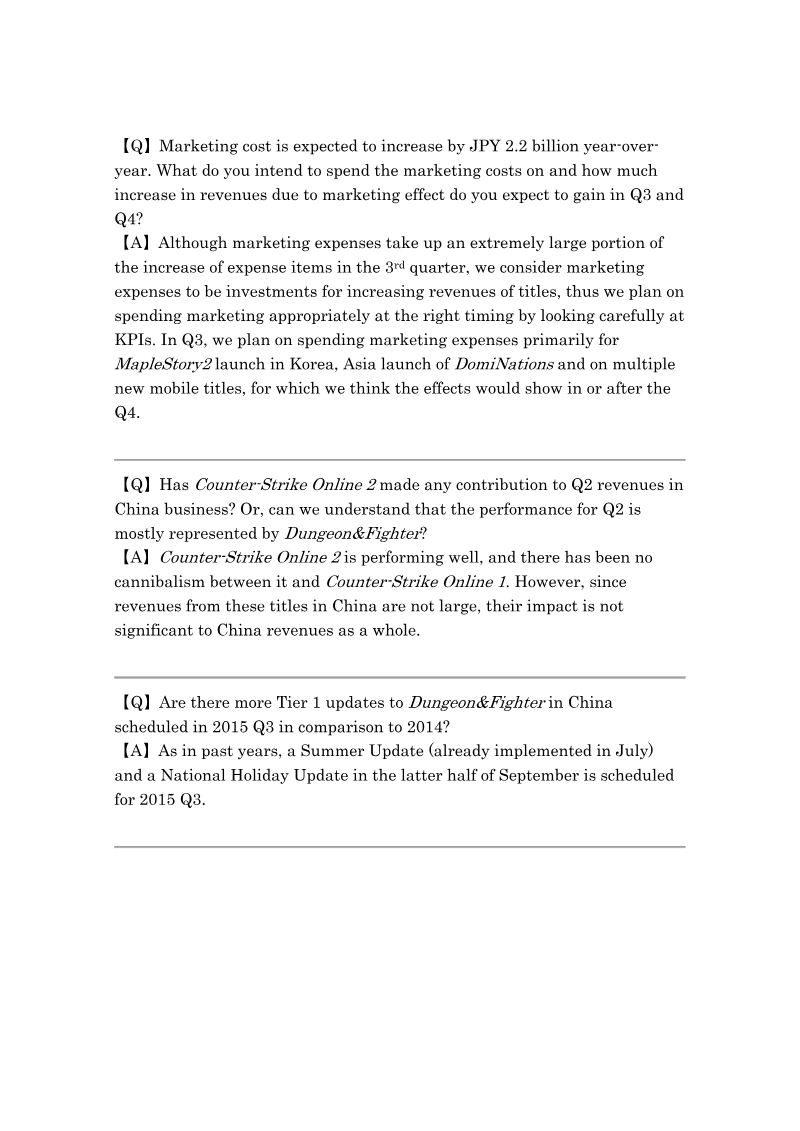
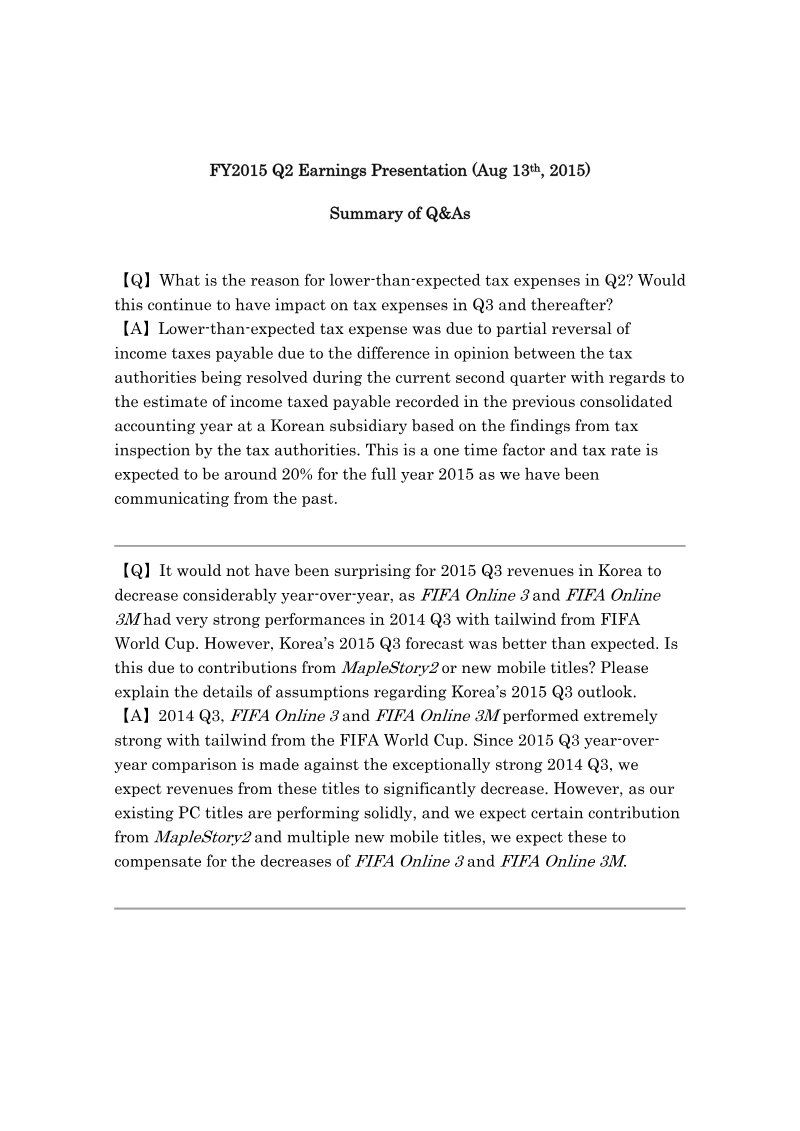
NEXON FY2015 Q2 Earnings Presentation: Summary of Q&As
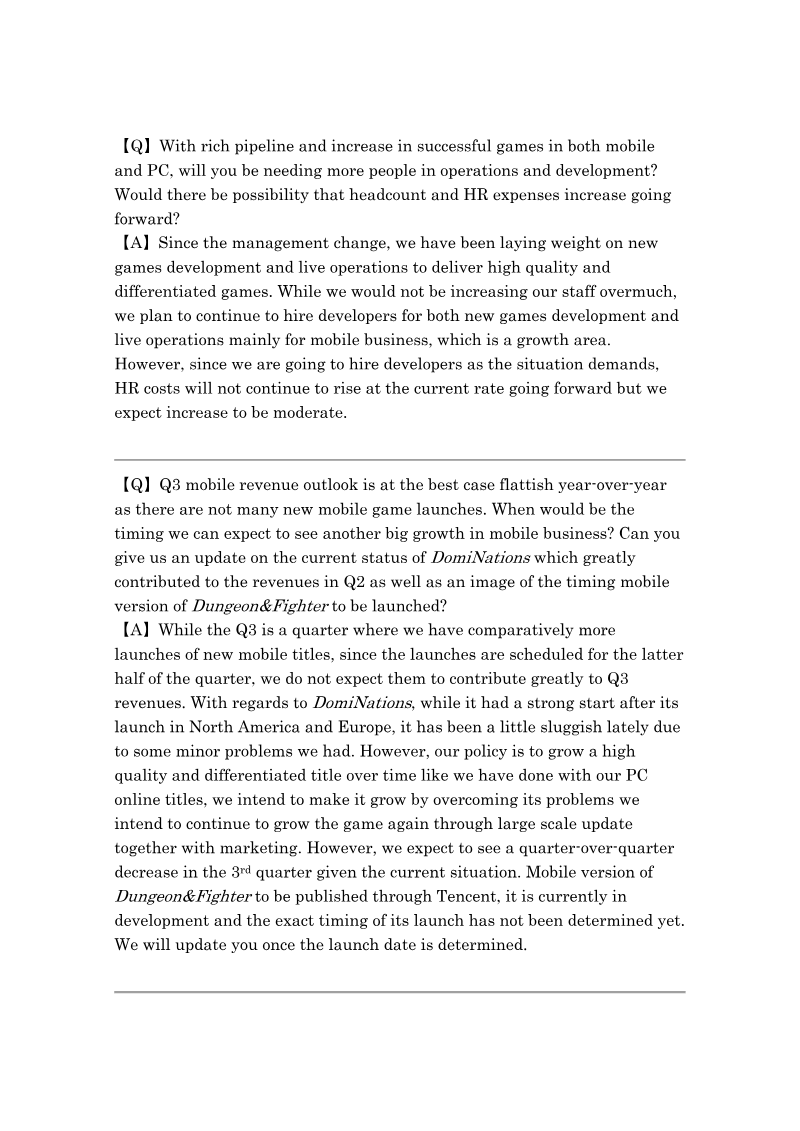
This summary of the Nexon FY2015 Q2 earnings question-and-answer session outlines the company’s strategic outlook, operational performance, and financial expectations.
Nexon Q2 2015 Earnings Call
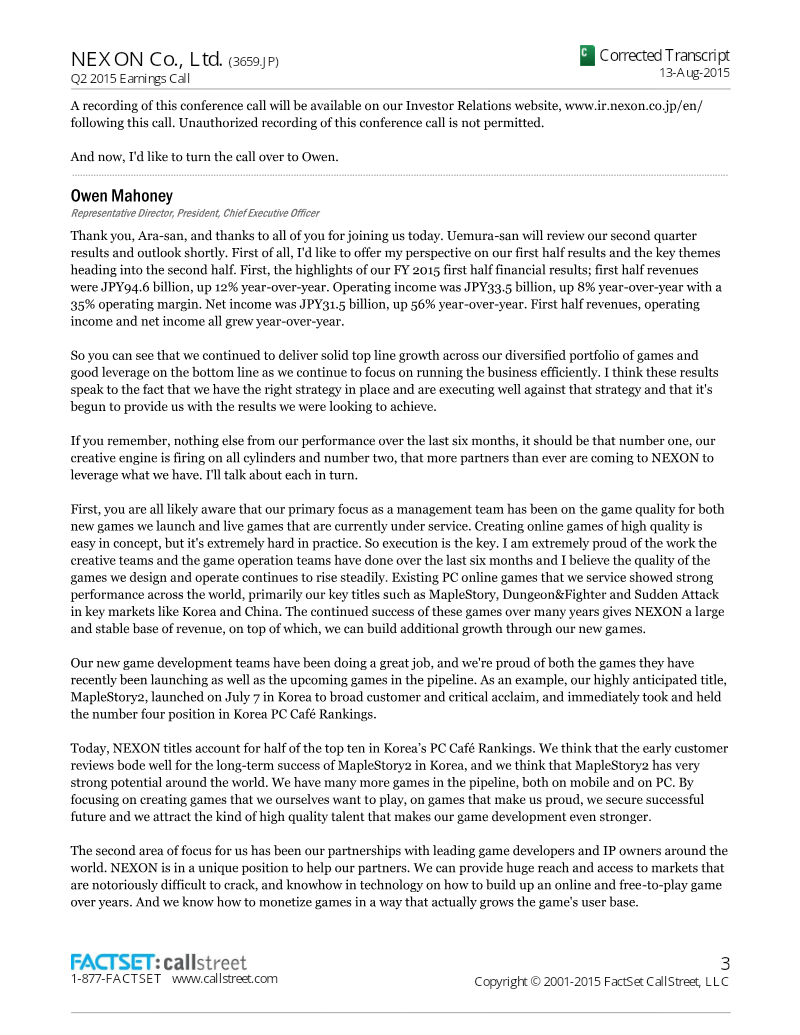
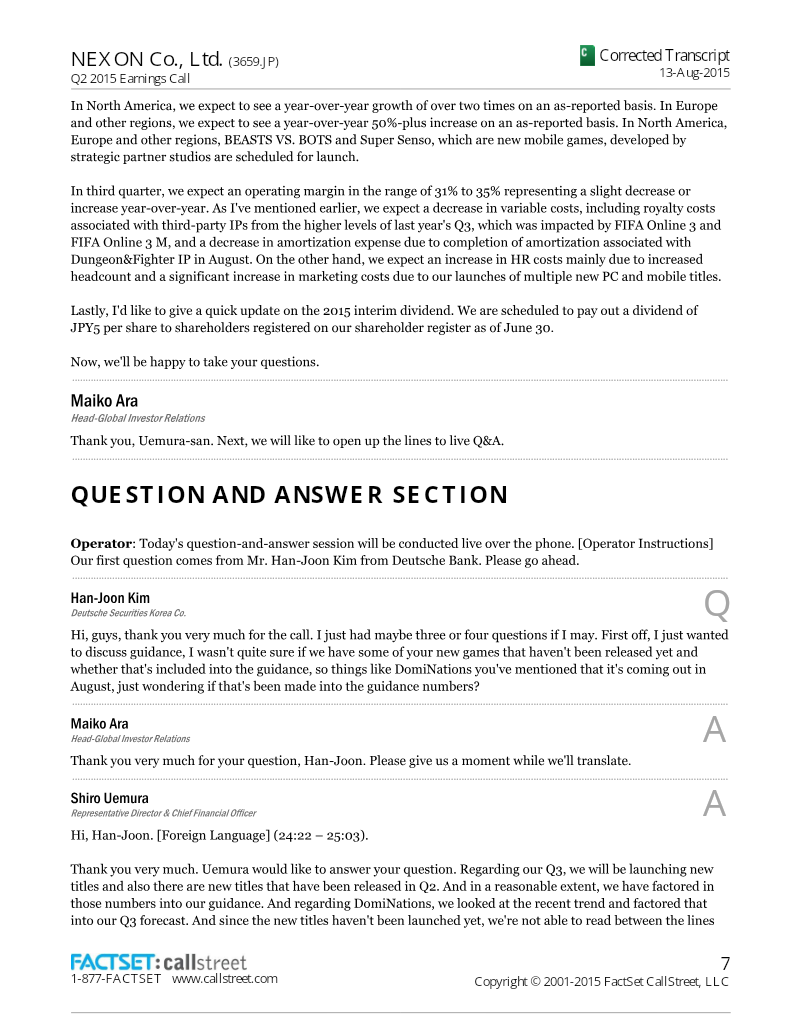
Nexon achieved robust financial growth during the first half of 2015, characterized by a 12 percent year-over-year revenue increase to JPY 94.6 billion and a substantial 56 percent rise in net income.
- Nexon reported a 12 percent year-over-year revenue increase to JPY 94.6 billion and a 56 percent rise in net income for the first half of 2015.
- The company successfully shifted its mobile revenue mix, with native mobile applications now accounting for approximately two-thirds of total mobile earnings.
- Core PC franchises, specifically Dungeon&Fighter and MapleStory, remain the primary drivers of the company's financial performance.
Reference Materials: Three-Month Period Ended June 30, 2015
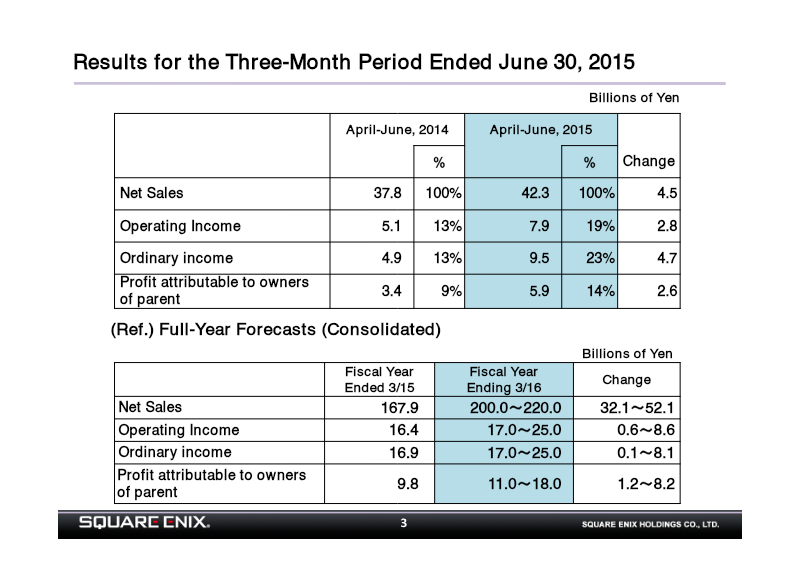
Square Enix Holdings Co., Ltd. reported strong financial growth for the three-month period ending June 30, 2015, characterized by significant increases in both net sales and operating income compared to the same period in the previous year.
- Square Enix reported a strong start to the fiscal year ending March 31, 2016, with net sales increasing to 42.3 billion yen and operating income rising to 7.9 billion yen for the quarter ended June 30, 2015.
- The Digital Entertainment segment was the primary growth driver, with net sales increasing by 6.8 billion yen and operating income nearly doubling to 8.2 billion yen compared to the same period in 2014.
- Operating margins for the Digital Entertainment segment improved significantly, rising from 19.2% in the April-June 2014 quarter to 27.0% in the April-June 2015 quarter.
Consolidated Financial Results for the Three-Month Period Ended June 30, 2015: Square Enix Holdings
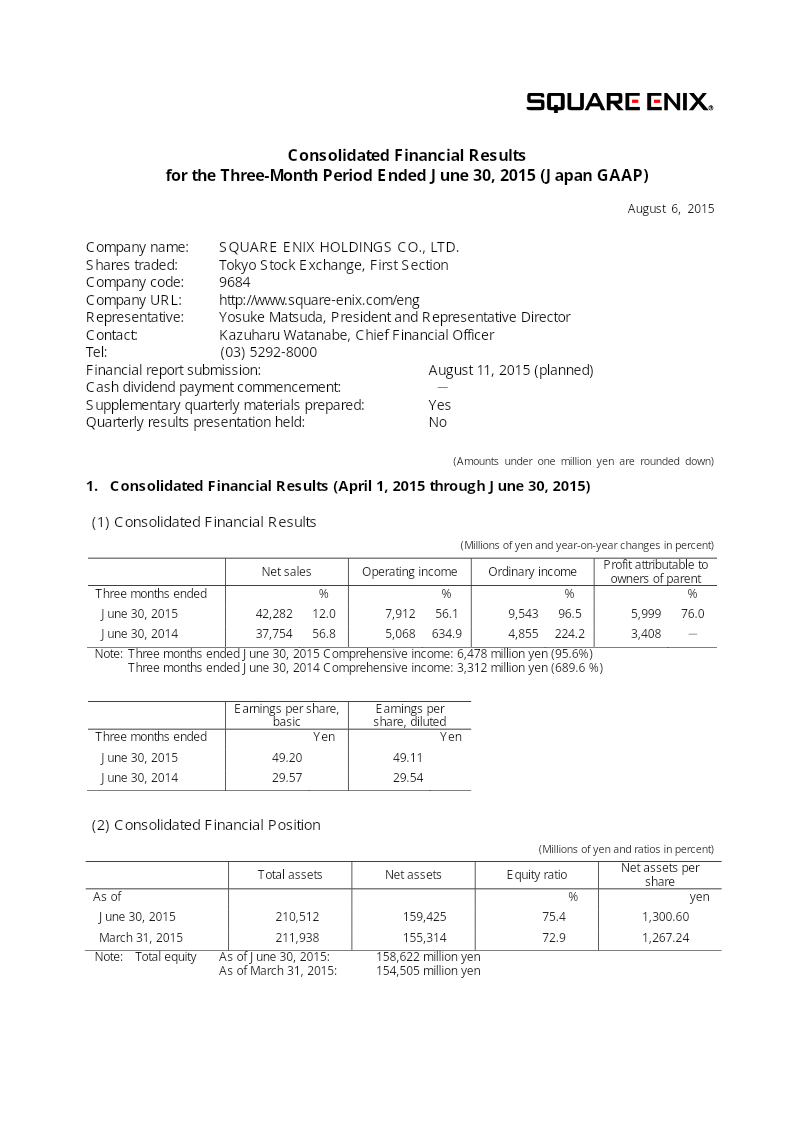
Square Enix Holdings reported strong financial growth for the three-month period ending June 30, 2015, driven primarily by the robust performance of its Digital Entertainment segment.
- Square Enix reported strong Q1 growth for the period ending June 30, 2015, with net sales reaching ¥42,282 million (up 12.0% YoY) and operating income rising 56.1% to ¥7,912 million.
- The Digital Entertainment segment, the company's primary revenue driver, saw net sales increase 29.2% to ¥30,297 million and operating income jump 81.6% to ¥8,191 million.
- Digital Entertainment growth was fueled by strong performance in smartphone and PC browser titles like 'DRAGON QUEST MONSTERS SUPER LIGHT' and 'FINAL FANTASY RECORD KEEPER,' alongside steady results from 'FINAL FANTASY XIV' and 'DRAGON QUEST X'.
Square Enix Holdings Financial Results Briefing: FY2015/3
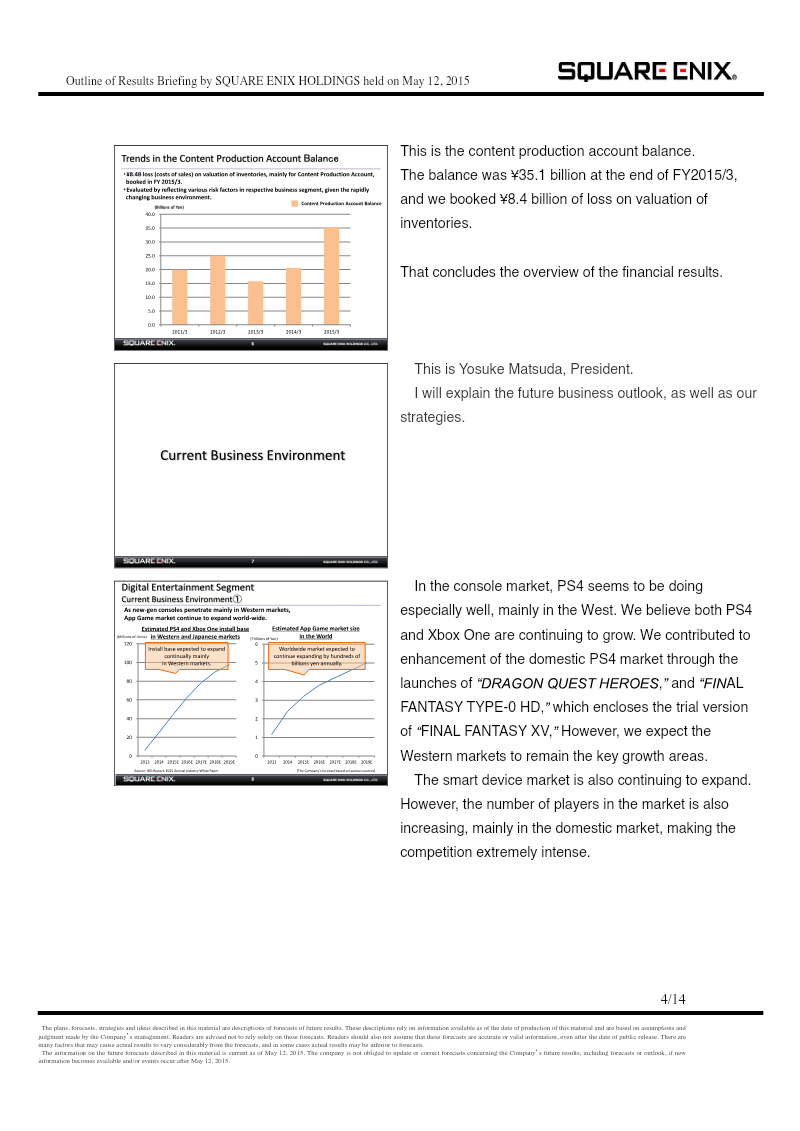
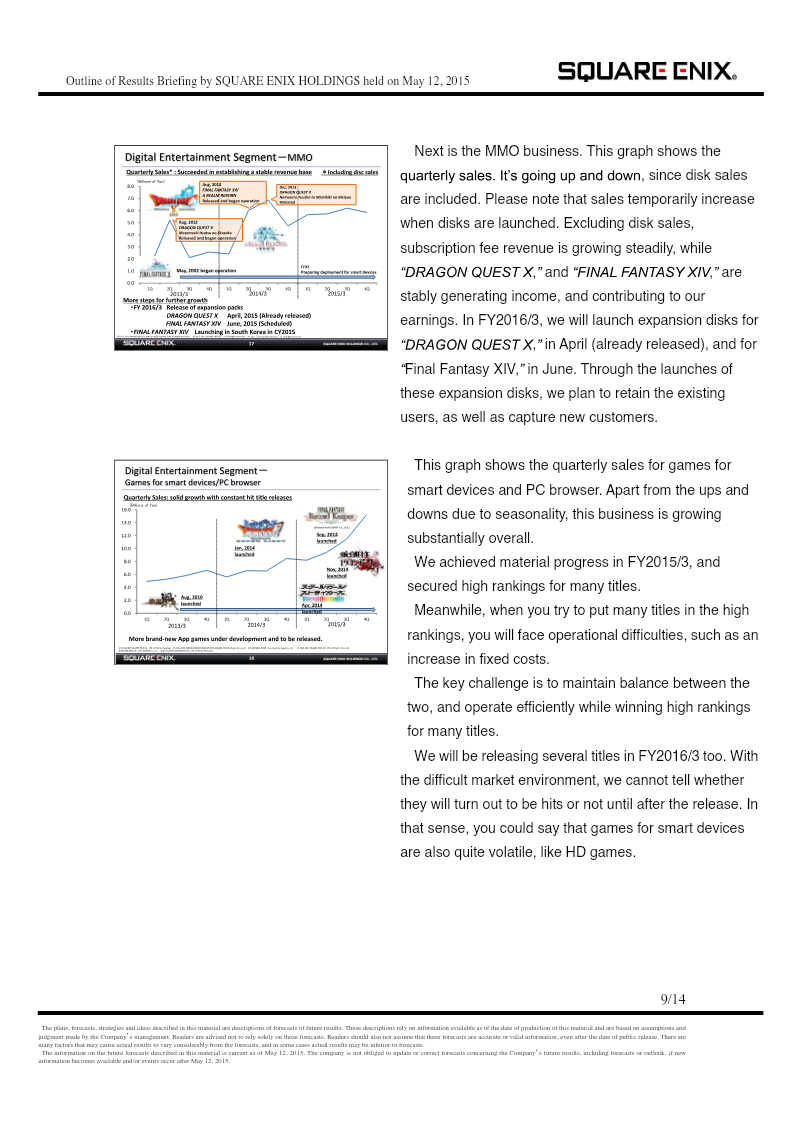
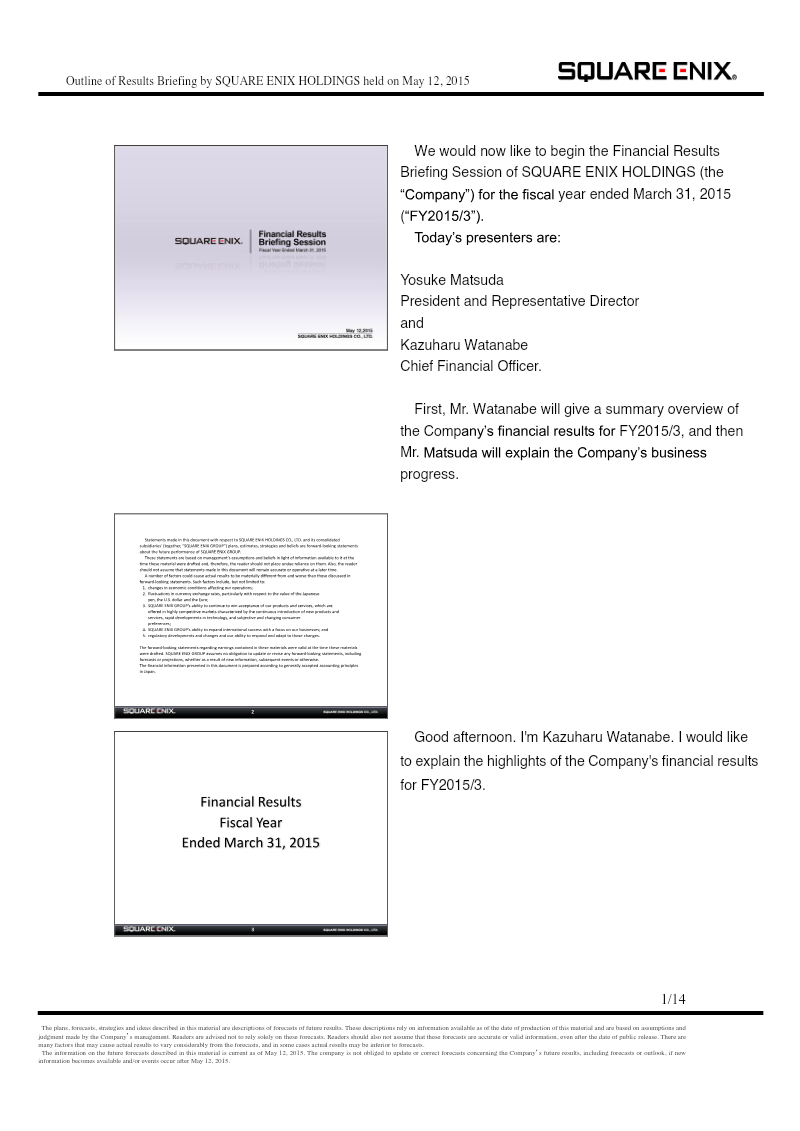
Square Enix achieved significant financial growth during the 2015 fiscal year, characterized by an 8.3 percent increase in net sales to 167.9 billion yen and a substantial 55.8 percent rise in operating income to 16.4 billion yen.
- Square Enix reported strong FY2015/3 growth with net sales rising 8.3% to 167.9 billion yen and operating income surging 55.8% to 16.4 billion yen.
- Management projects FY2016 net sales of 200–220 billion yen and operating income of 17–25 billion yen, aiming to surpass the 200 billion yen revenue milestone for the first time.
- Financial performance was driven by mid-sized console titles, sustained profitability in massively multiplayer online games, and growth in the smart device segment.

Nordic Game 2015 Diary: Day 1
Nordic Game 2015 serves as a primary venue for industry professionals to discuss emerging trends in game development, marketing strategies, and the evolving landscape of multi-platform distribution.
- Developers are shifting away from platform-exclusive strategies toward unified, cross-platform experiences that integrate mobile, PC, console, and virtual reality hardware.
- Crowdfunding success, as evidenced by Square Enix Collective, relies on synchronized launch strategies and professional support rather than independent, uncoordinated efforts.
- Market saturation necessitates that developers clearly define and communicate their unique selling points to remain competitive in indie publishing and ad network sectors.
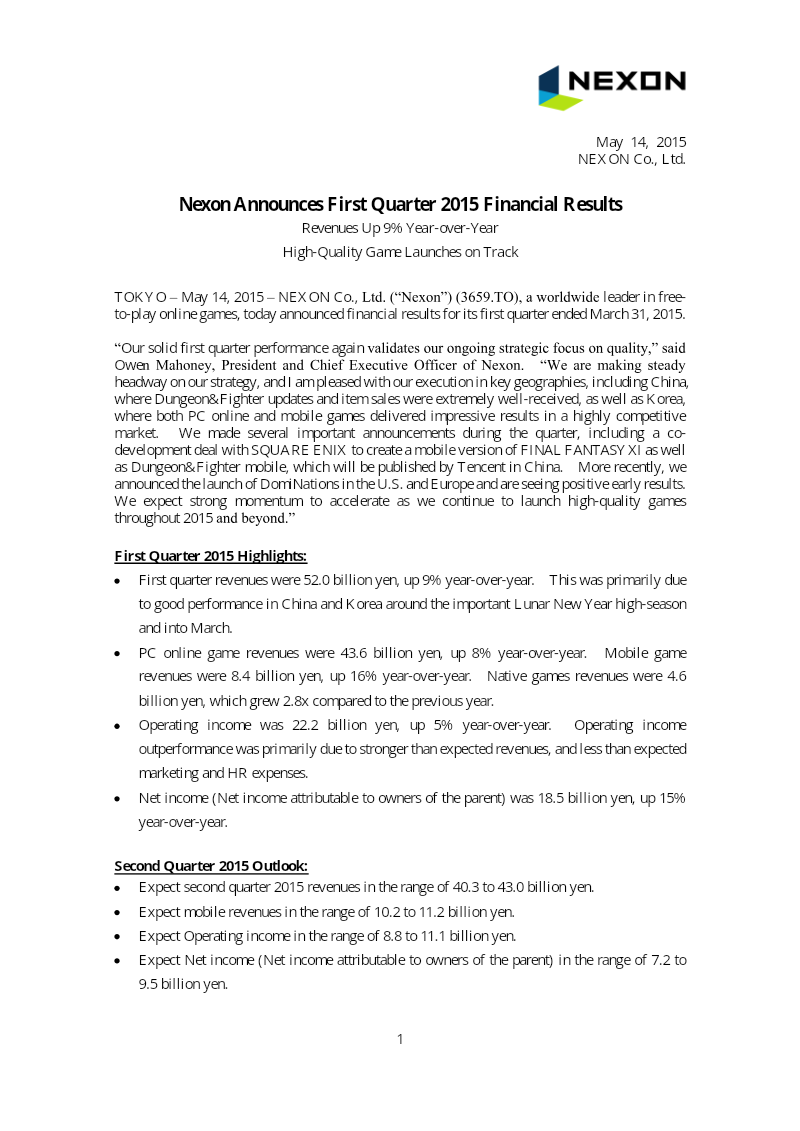
Nexon First Quarter 2015 Financial Results
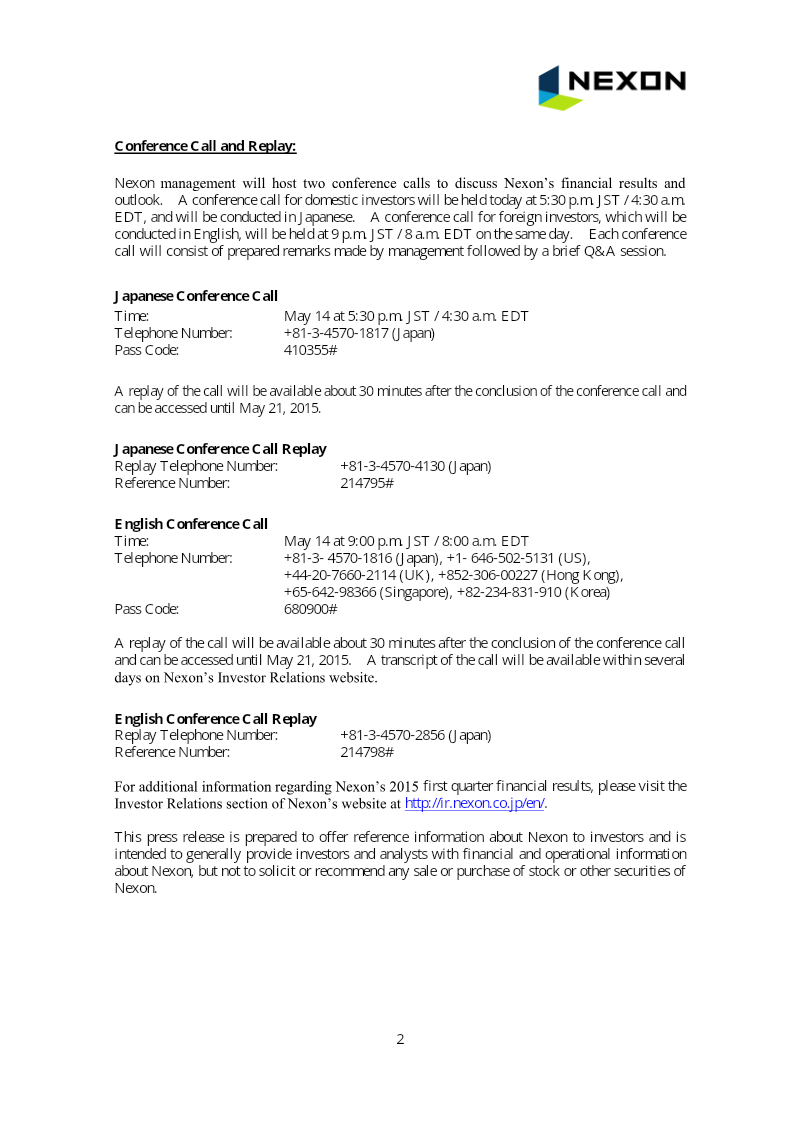
Nexon’s financial performance for the first quarter of 2015 demonstrates a successful execution of its strategic focus on high-quality game development and expansion within the free-to-play market.
- Nexon reported Q1 2015 total revenues of 52.0 billion yen, a 9% year-over-year increase driven by strong performance in China and Korea.
- Net income attributable to owners of the parent grew 15% to 18.5 billion yen, while operating income rose 5% to 22.2 billion yen.
- Mobile game revenues reached 8.4 billion yen, marking a 16% increase, while native game revenues grew 2.8 times compared to Q1 2014.
