2015
Company
Documents about 2015
GameStop Quarterly Report: Q3 2016
GameStop’s financial performance for the third quarter of 2016 reflects a period of strategic transition as the company navigates a maturing console cycle.
- GameStop's Technology Brands segment, which includes Spring Mobile (AT&T/Cricket) and Simply Mac, saw significant growth with gross profit rising to $380.0 million for the 39 weeks ended October 29, 2016, up from $195.8 million in the prior year period.
- Total gross profit for the 39 weeks ended October 29, 2016, reached $2,001.4 million (36.0% margin), compared to $1,875.1 million (32.1% margin) for the same period in 2015.
- Interest expense increased by $21.7 million for the 39-week period due to the March 2016 issuance of $475.0 million in 6.75% senior notes due in 2021.
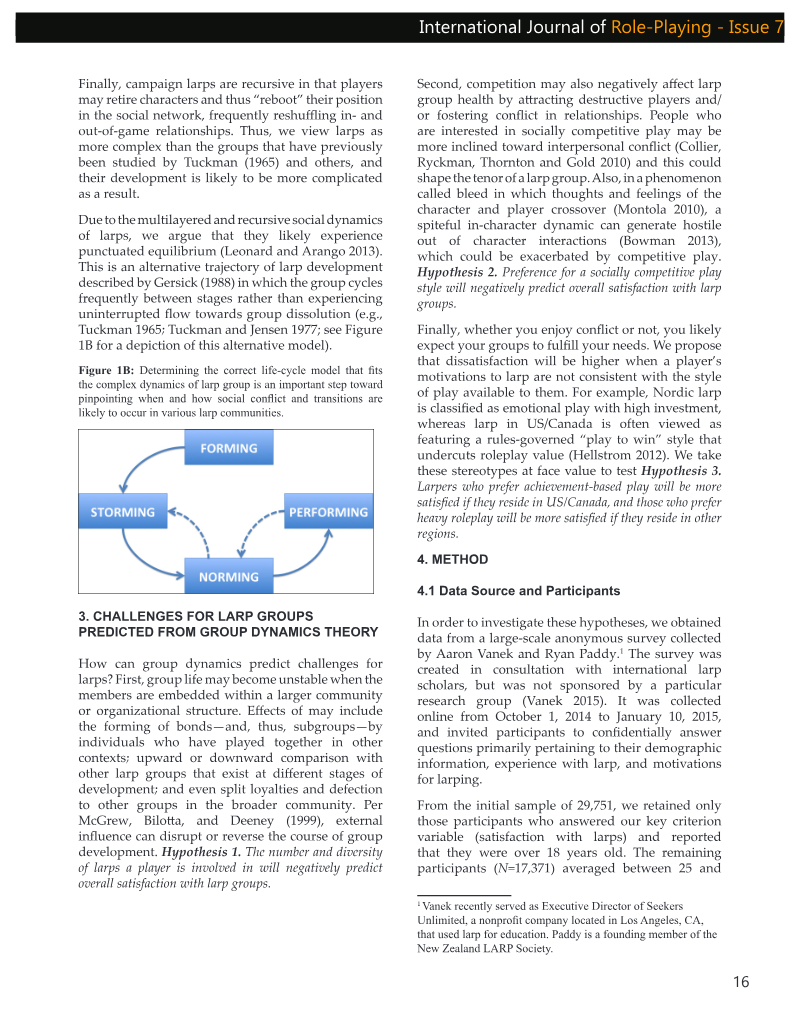
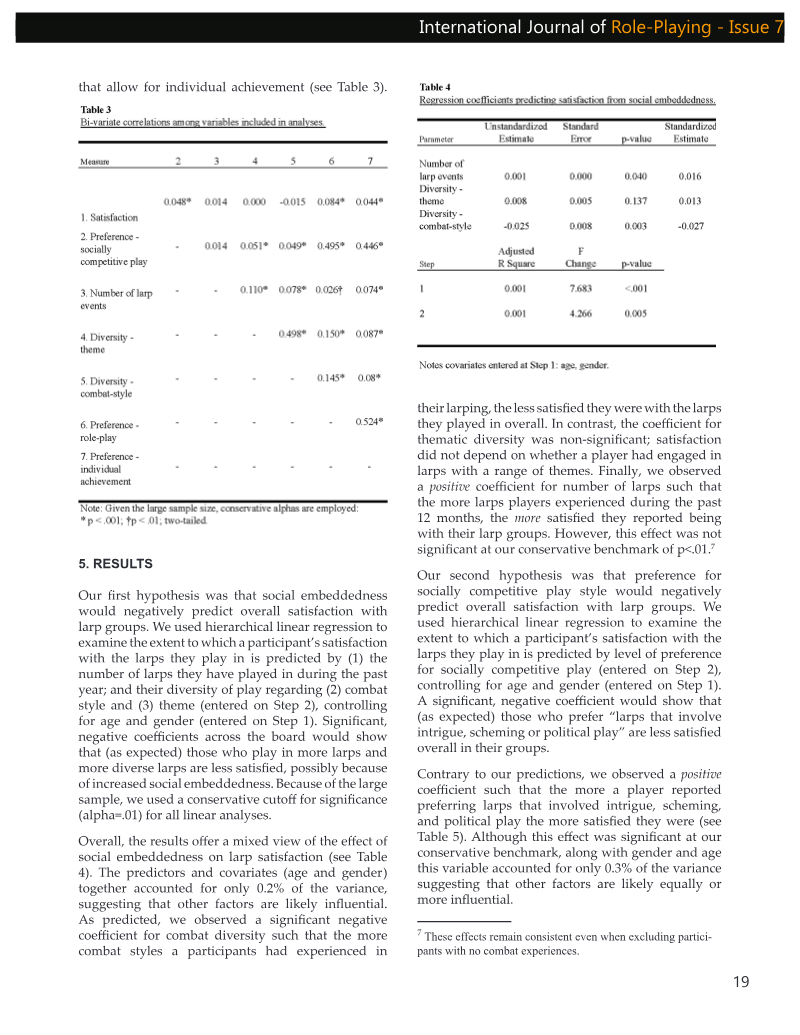
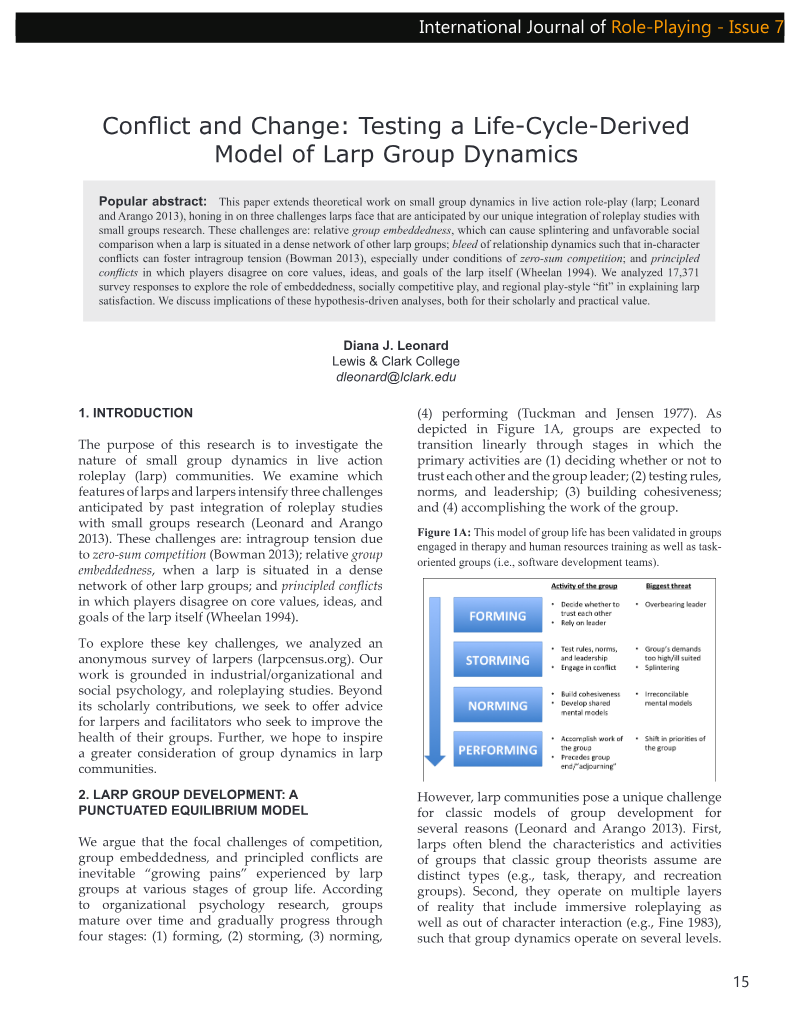
Conflict and Change: Testing a Life-Cycle-Derived Model of Larp Group Dynamics
This study tests a life-cycle-derived model of small group dynamics applied to live action role-play (larp) communities, examining three challenges that larp groups face: embeddedness within dense networks of other larp groups, intragroup tension arising from zero-sum competitive play, and principled conflicts over the values…
- The study proposes that larp groups follow a punctuated equilibrium trajectory rather than the linear stages of classic group development theory, because they blend task, therapy, and recreational characteristics and operate across in-character and out-of-character layers.
- Analysis of an anonymous online survey of 17,371 adult larpers (October 2014 to January 2015) used hierarchical regression and two-way ANCOVA, finding only mixed support for the hypotheses.
- The strongest finding was regional: achievement-oriented players reported greater satisfaction when living in the United States or Canada, while the expected regional advantage for role-play-oriented players did not appear.
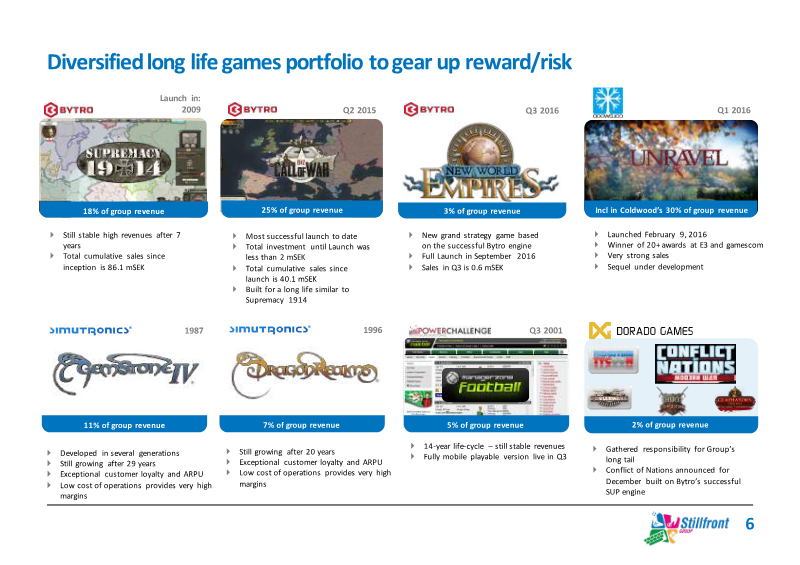
Stillfront Group Q3 Report Presentation 2016
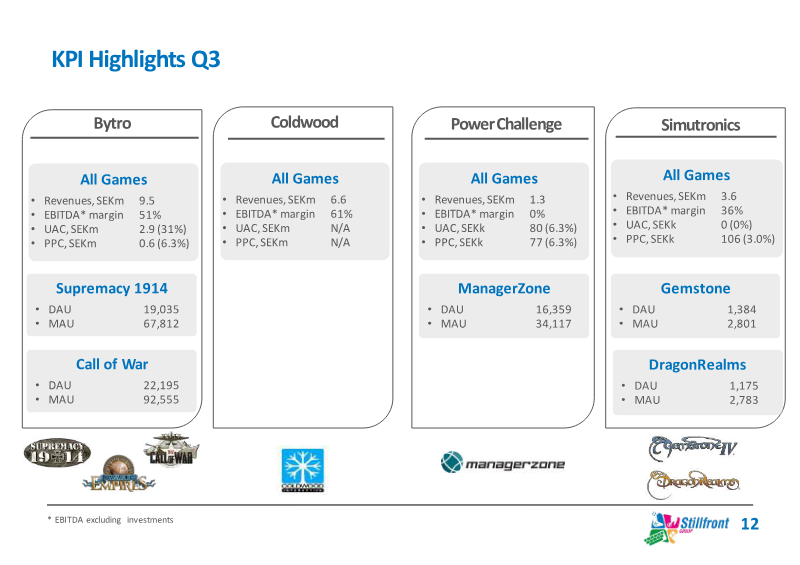
Stillfront Group’s 2016 third-quarter report outlines a strategy focused on consolidating the fragmented gaming market by acquiring indie studios while maintaining their operational agility.
- Stillfront Group achieved significant financial growth in 2016, reporting a 56% increase in net revenue over the previous 12 months and an 85% year-to-date growth rate compared to 2015.
- The company maintained high operational efficiency with a 37% EBITDA margin in the third quarter of 2016.
- Over 70% of the group's revenue is generated from self-published, owned brands, reducing reliance on third-party publishers.
Game Developer Index: Sweden 2016
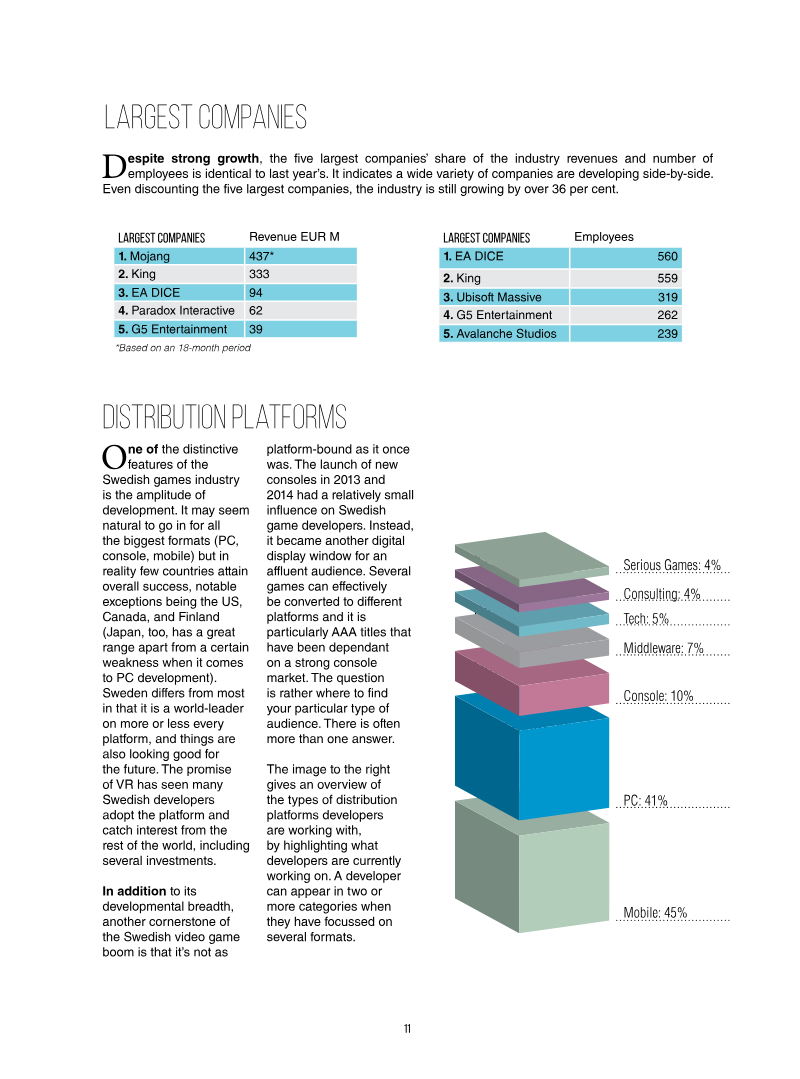
The "Game Developer Index: Sweden 2016" provides a comprehensive overview of the Swedish game development industry, asserting its position as a rapidly expanding and globally competitive sector.
- The Swedish video game industry generated EUR 1.3 billion in revenue in 2015, marking a 41 percent increase over the previous year.
- The sector has maintained a compound annual growth rate of 39 percent since 2006, with the workforce expanding by 19 percent to 3,709 full-time positions in 2015.
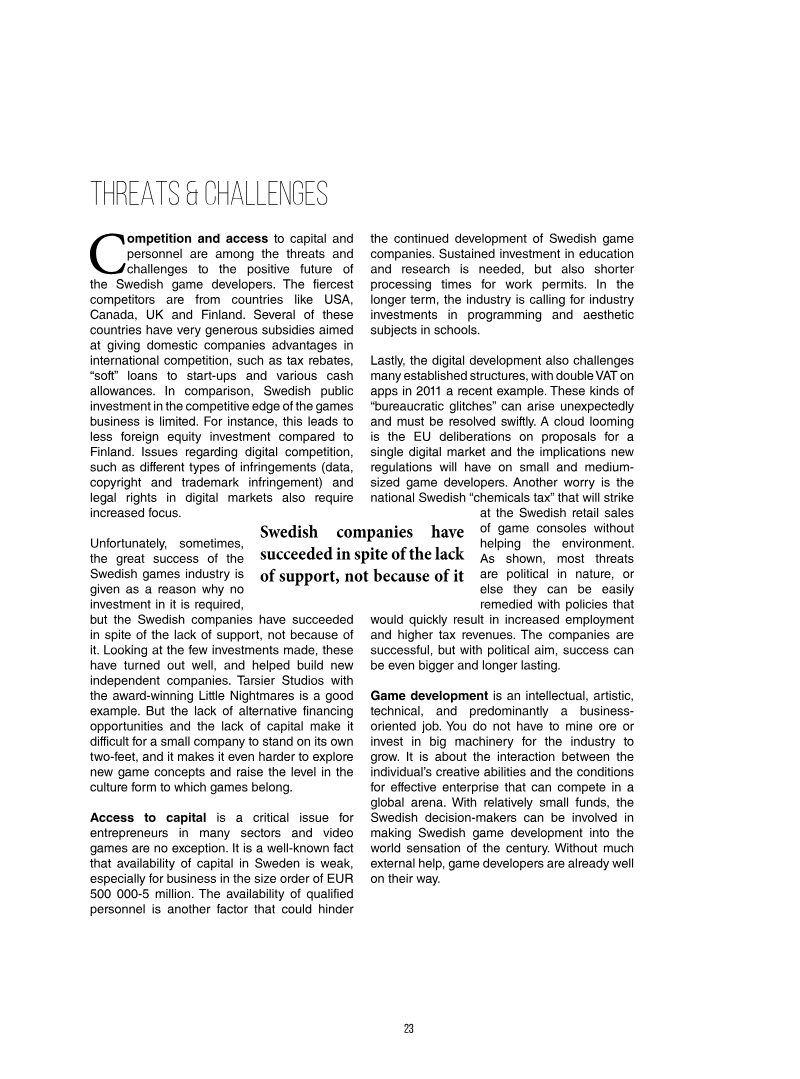
- Industry growth is hindered by a persistent shortage of qualified personnel, restricted access to capital, and a regulatory environment that lacks competitive government support.
CD Projekt Group Results in 3Q 2016
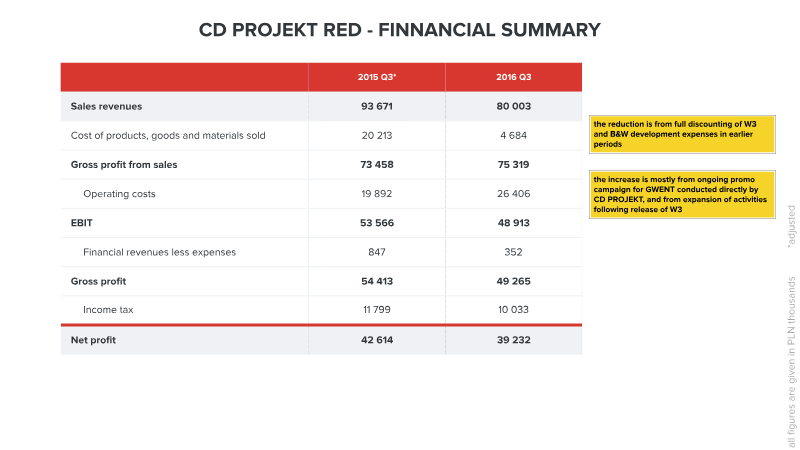
The CD Projekt Group’s financial results for the third quarter of 2016 reflect a period of strategic transition and continued investment following the successful release of The Witcher 3.
- CD Projekt Group reported 100.9 million PLN in sales revenue for 3Q 2016, an 11% decrease year-over-year, and a 9% decline in net profit to 36.6 million PLN.
- The company maintained a strong financial position with 552.2 million PLN in cash and cash equivalents and a total equity base of 691.8 million PLN.
- Development expenditures reached 46.5 million PLN in fixed assets as the company prioritized long-term investment in Cyberpunk 2077 and the Gwent card game.
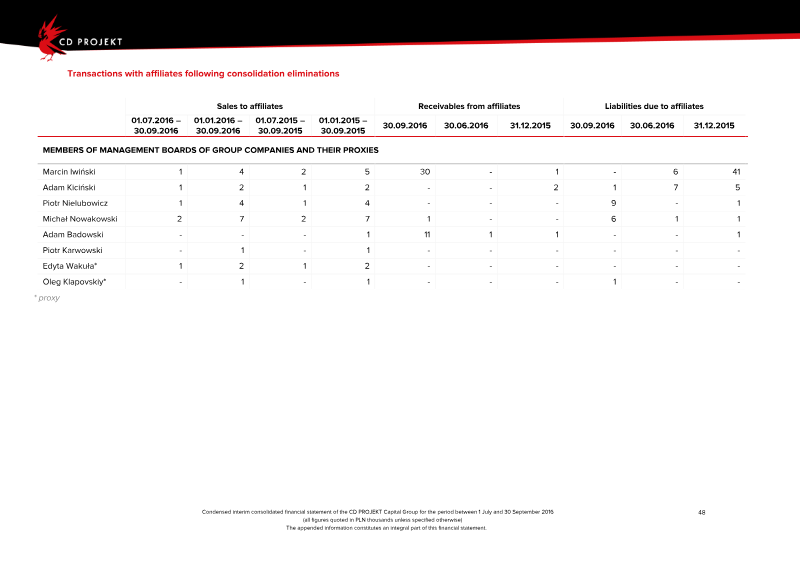
CD PROJEKT Capital Group Condensed Interim Consolidated Financial Statement: Q3 2016
The CD PROJEKT Capital Group maintained a robust financial position throughout the first nine months of 2016, characterized by a net profit of 171.2 million PLN and total equity rising to 691.8 million PLN by the end of the third quarter.
- CD PROJEKT recorded a net profit of 171.2 million PLN for the first nine months of 2016, maintaining a 36% net margin in the third quarter.
- Total equity for the group reached 691.8 million PLN by September 30, 2016, supported by a strong liquidity position of 552.2 million PLN in cash and cash equivalents.
- Financial performance was driven by the continued commercial success of The Witcher 3: Wild Hunt and the growth of the GOG.com digital distribution platform.

The Simplest AI Trick in the Book
This presentation from the 2015 Game Developers Conference features five industry experts sharing practical, low-complexity artificial intelligence techniques designed to enhance player immersion and streamline development.
- Optimize AI reaction times by using psychological benchmarks: 0.2 seconds for simple responses and 0.4 seconds for complex 'go/no-go' decisions to simulate human-like behavior.
- Reduce CPU overhead and pathfinding errors by using environmental markup to automatically identify and prune disconnected navigation mesh islands.
- Leverage player telemetry data to dynamically generate navigation links for NPCs, allowing the player base to effectively 'teach' AI how to traverse complex procedurally generated geometry.
Swedish Game Education: 2001-2016
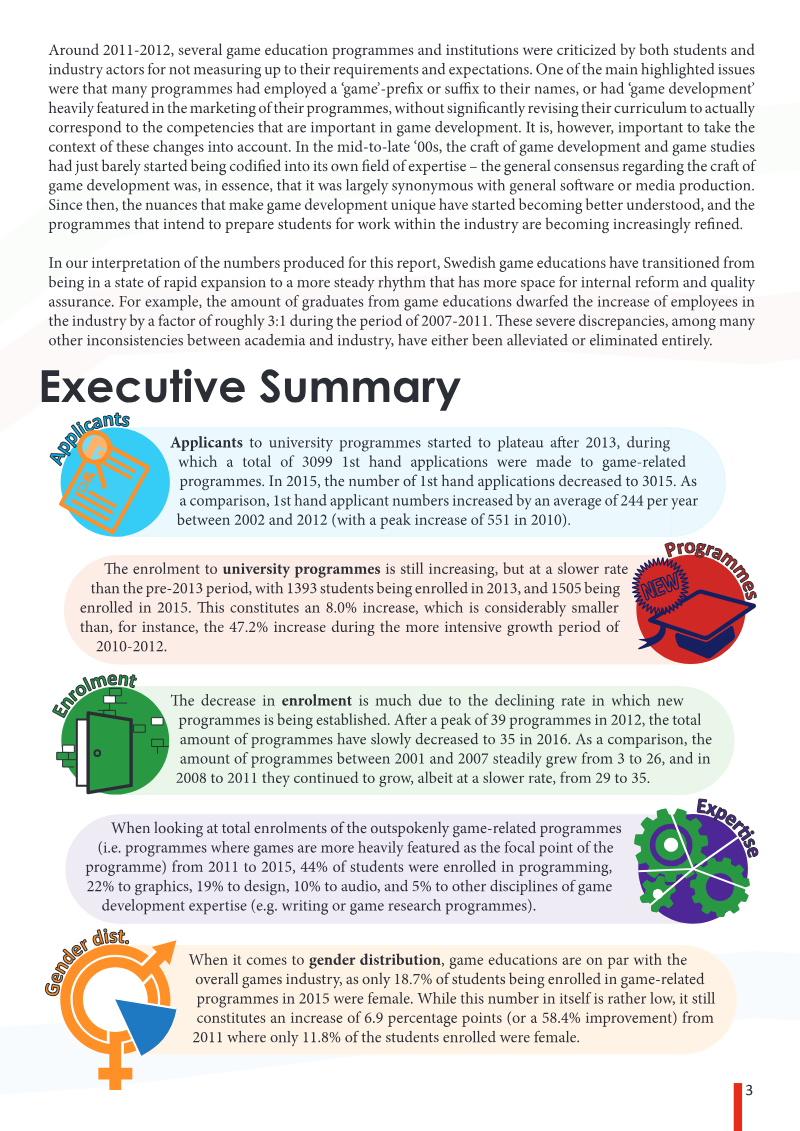
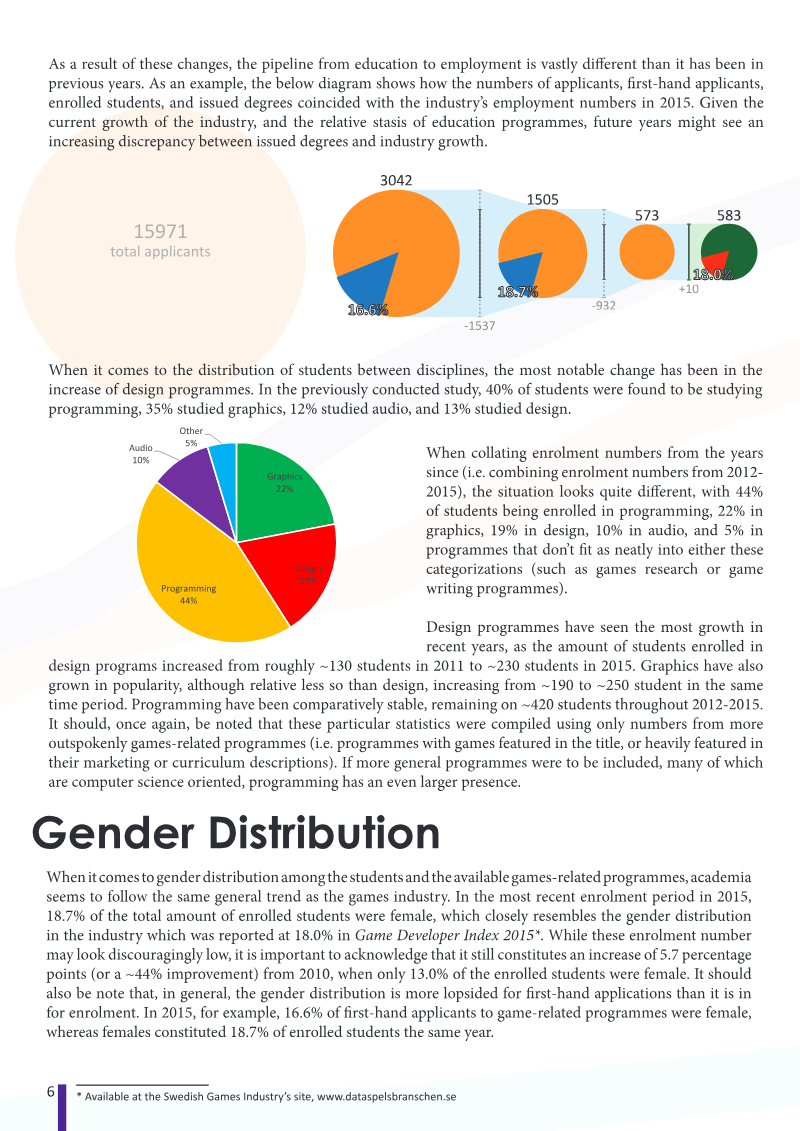
This report, "Swedish Game Education: 2001-2016," provides an overview of academic game-related education in Sweden, analyzing its evolution from rapid expansion in the 2000s to a more stable, plateaued state in the 2010s.
- Swedish game education reached a peak of 41 programs in 2012 before stabilizing at 35 programs by 2016, signaling a shift from rapid proliferation to a mature phase.
- Despite the expansion of academic and vocational training, the Swedish game industry continues to face persistent labor shortages that limit its growth potential.
- Programming remains the dominant discipline with 44% of total enrollment, followed by graphics (22%), design (19%), audio (10%), and other fields (5%).
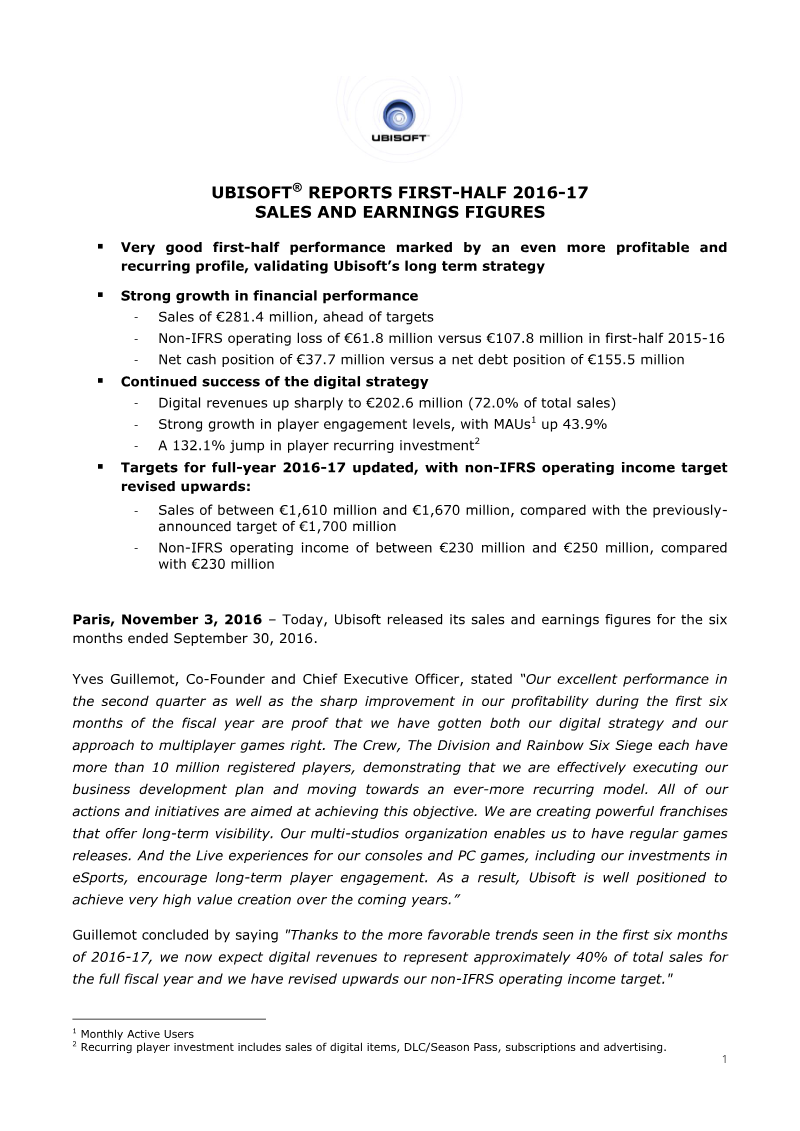
Ubisoft First-Half 2016-17 Sales and Earnings Figures
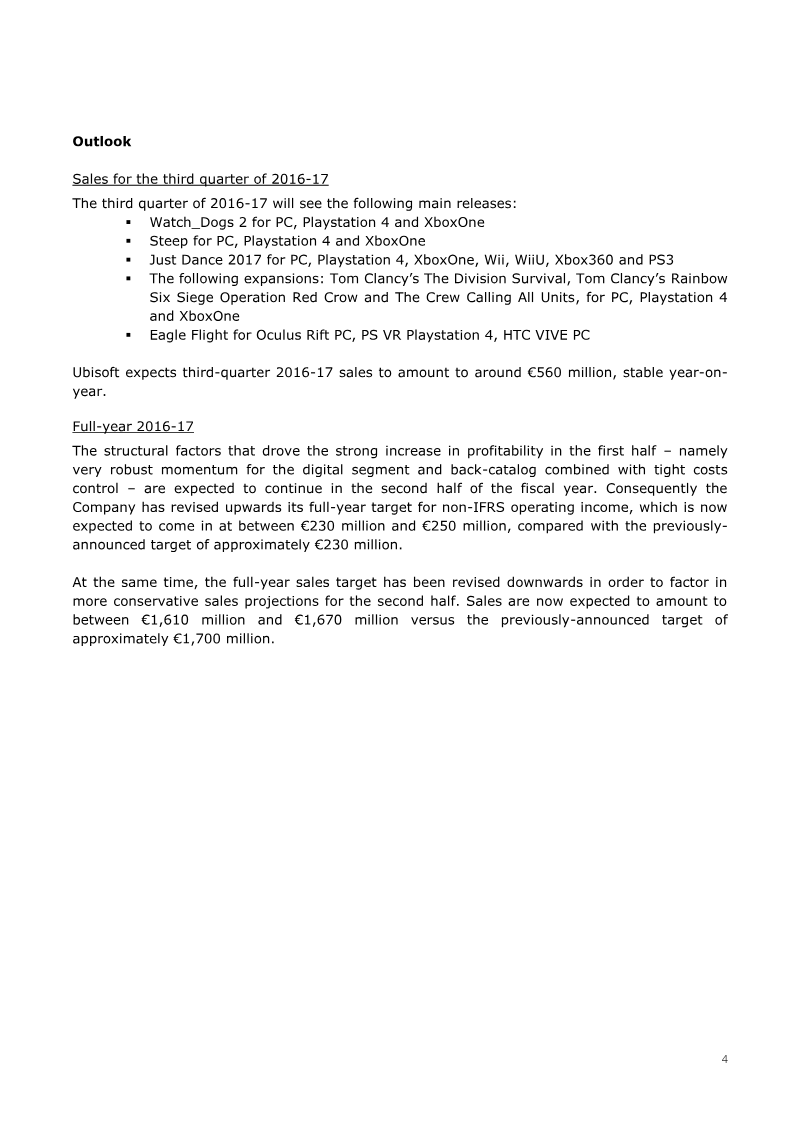
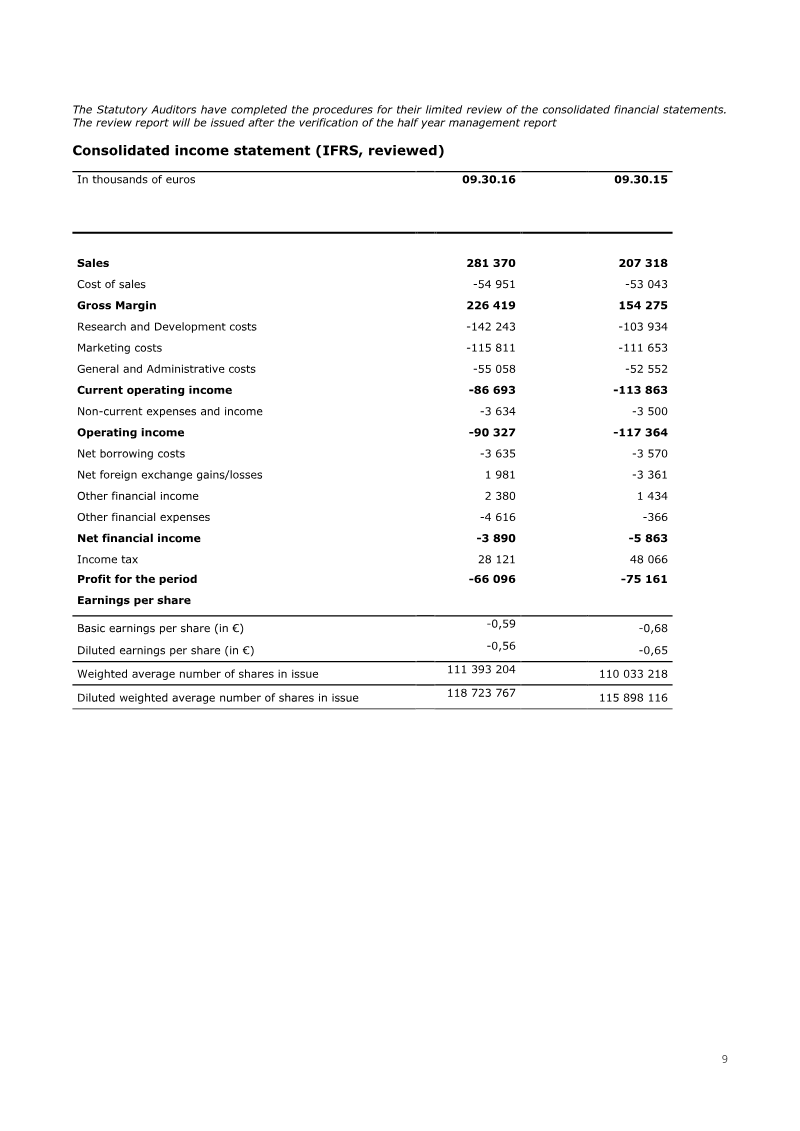
Ubisoft’s financial results for the first half of the 2016-17 fiscal year demonstrate a successful transition toward a more profitable, recurring business model driven by digital growth and multiplayer engagement.
- Digital revenue surged 102.6% to €202.6 million, now accounting for 72% of Ubisoft's total sales for the first half of fiscal 2016-17.
- Ubisoft improved its non-IFRS operating loss to €61.8 million, down from the €107.8 million loss recorded in the same period of the previous fiscal year.
- The company transitioned from a net debt position of €155.5 million in the prior year to a net cash position of €37.7 million as of September 30, 2016.
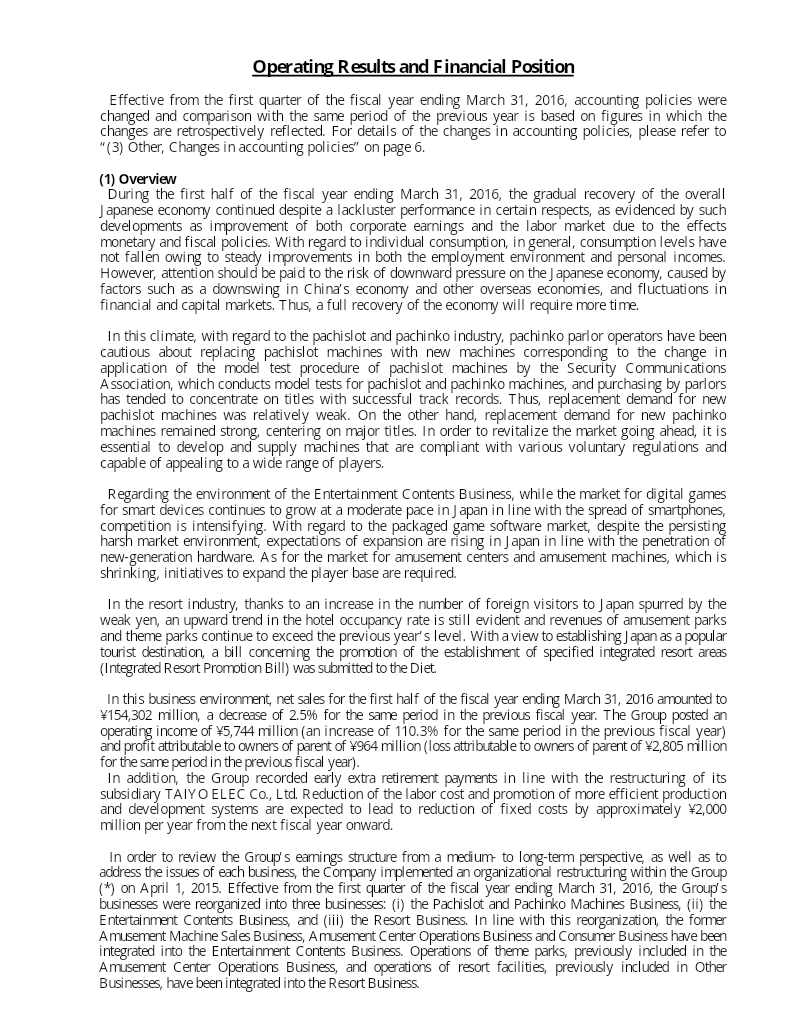
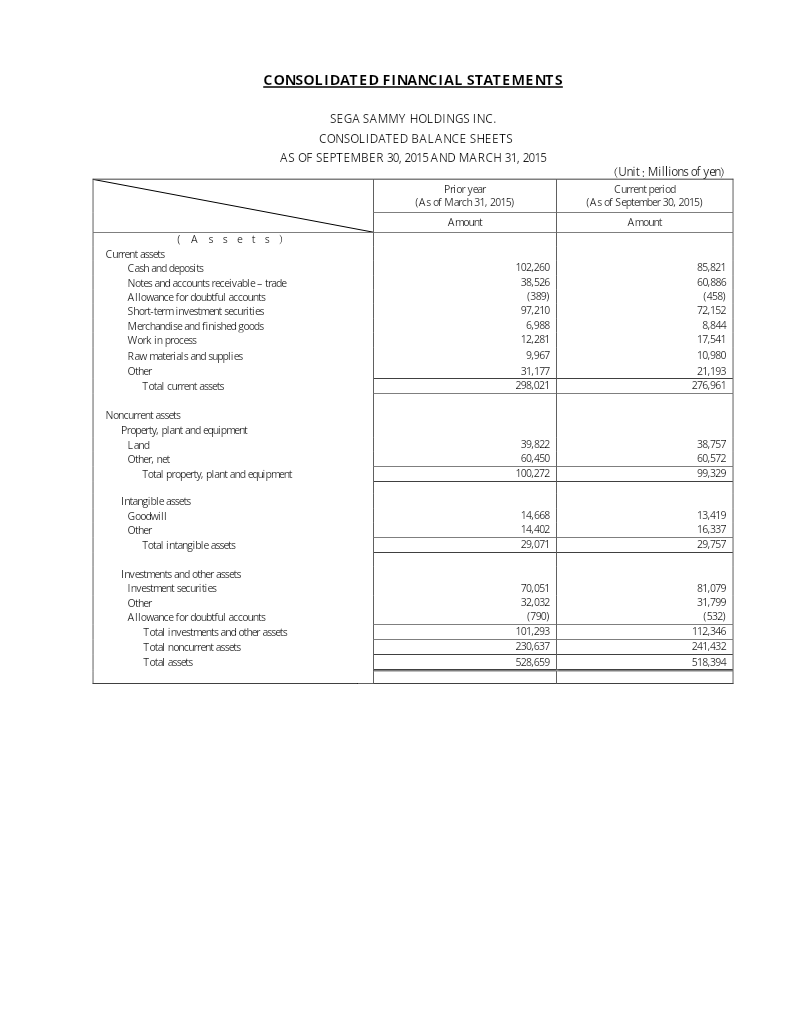
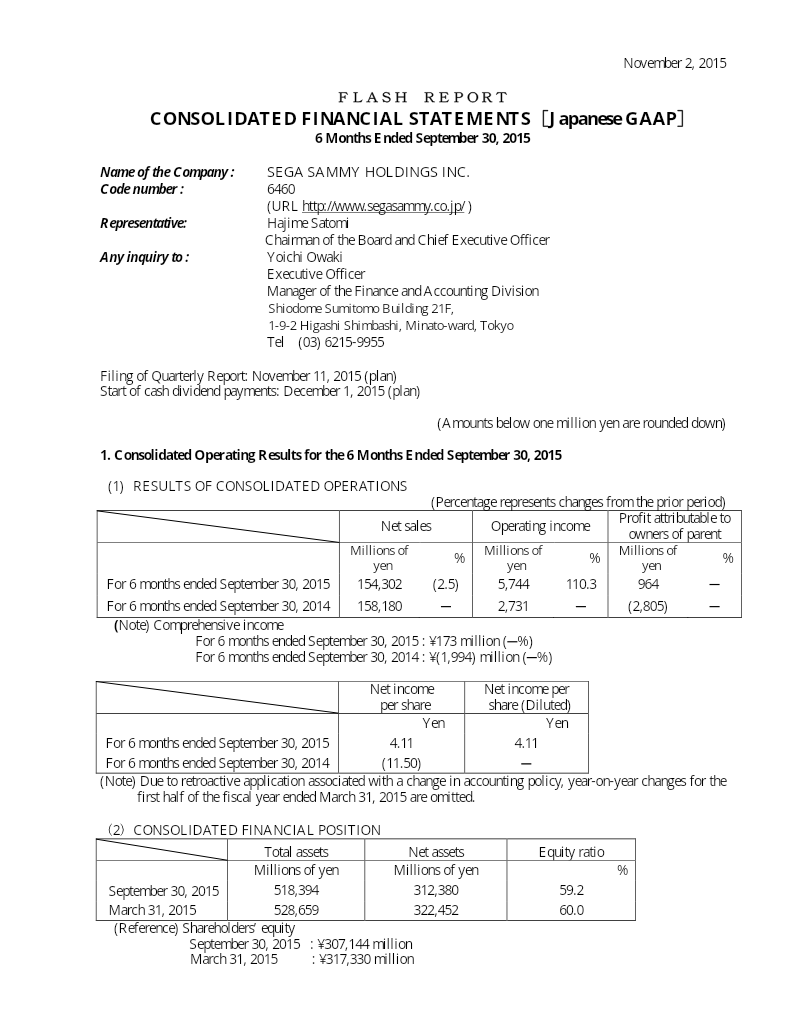
Sega Sammy Holdings Consolidated Financial Statements: 6 Months Ended September 30, 2015
Sega Sammy Holdings’ consolidated financial results for the six-month period ending September 30, 2015, reflect a period of organizational restructuring and strategic realignment.


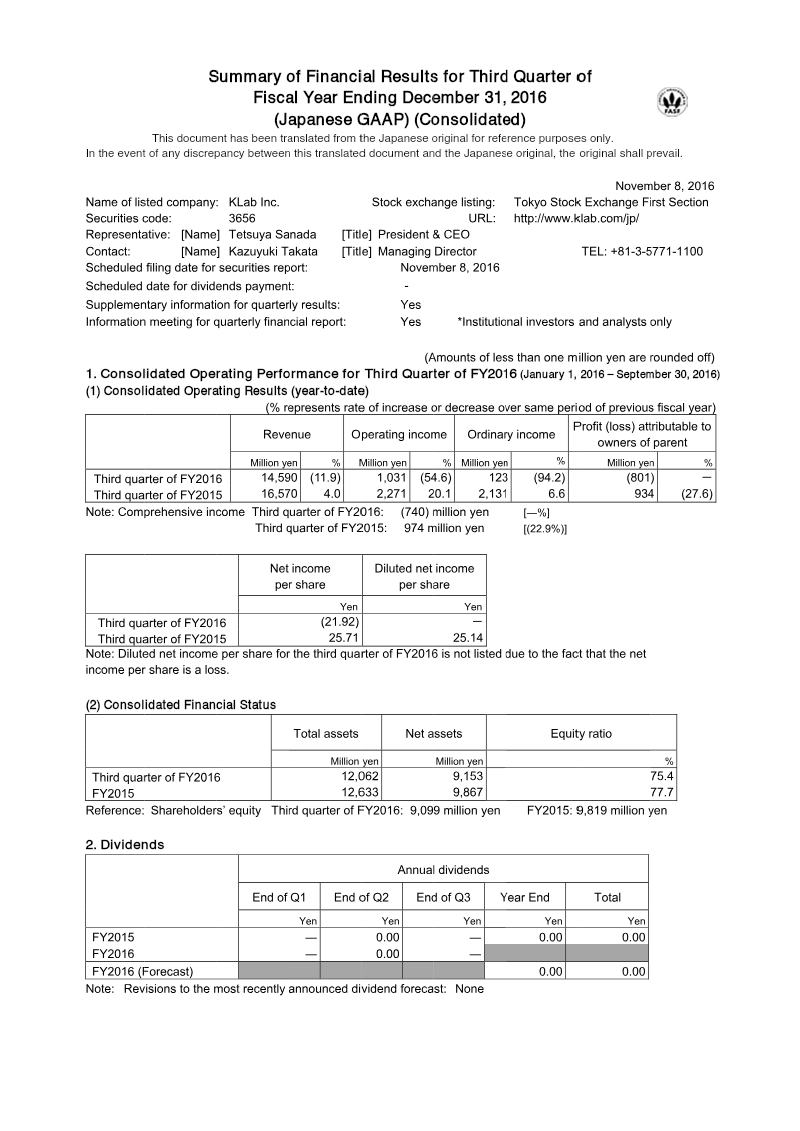
Summary of Financial Results for Third Quarter of Fiscal Year Ending December 31, 2016
This financial summary outlines the consolidated operating performance of KLab Inc. for the first nine months of the fiscal year ending December 31, 2016.
- KLab Inc. reported a net loss of 801.3 million yen for the first nine months of 2016, a significant reversal from the 934.4 million yen profit recorded during the same period in 2015.
- Revenue declined 11.9% year-over-year to 14.59 billion yen, driven primarily by underperformance in the title Love Live! School Idol Festival.
- Profitability suffered sharp declines, with operating income falling 54.6% to 1.03 billion yen and ordinary income dropping 94.2% to 123.6 million yen.


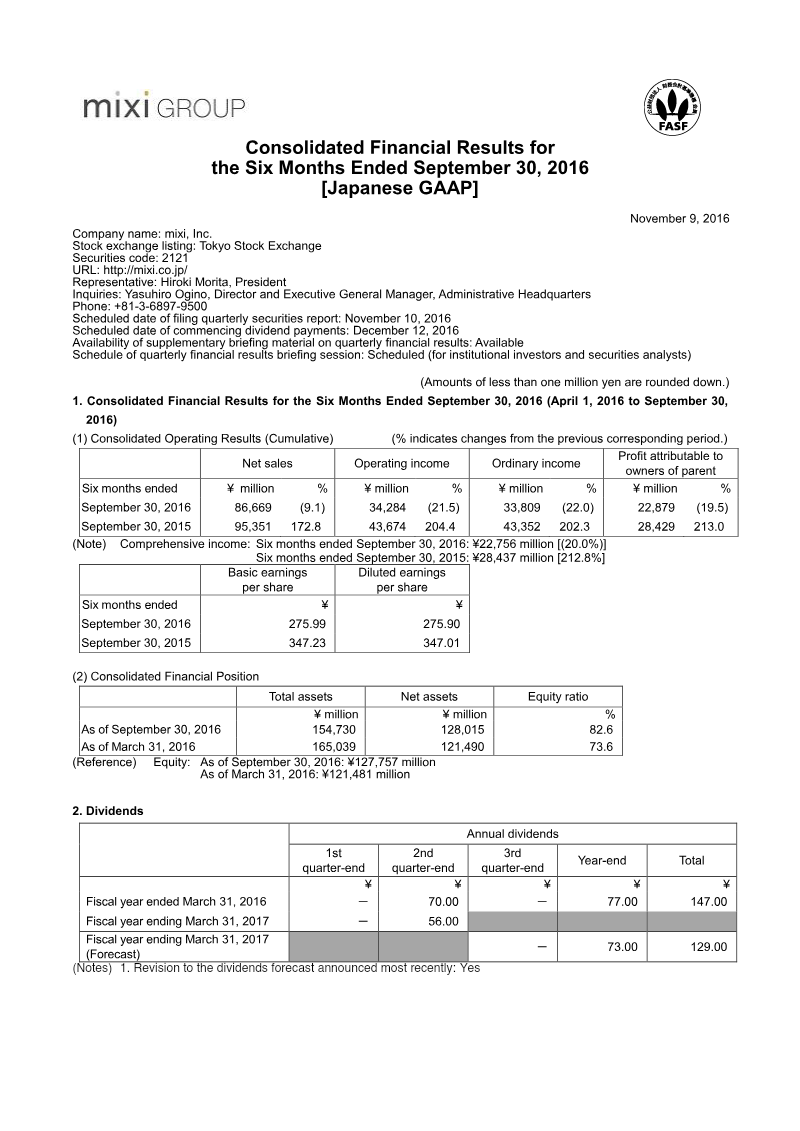
Consolidated Financial Results for the Six Months Ended September 30, 2016
Mixi, Inc. reported consolidated financial results for the first six months of the fiscal year ending March 31, 2017, covering the period from April 1, 2016, to September 30, 2016.
- Mixi, Inc. experienced a contraction in the first half of fiscal year 2017, with net sales falling 9.1% year-over-year to ¥86,669 million.
- Profitability declined significantly, as operating income dropped 21.5% to ¥34,284 million and profit attributable to owners of the parent fell 19.5% to ¥22,879 million.
- The Entertainment Business remains the primary revenue driver at ¥79,452 million, though it saw a decline from the ¥89,027 million recorded in the same period of 2015.