Game Development reports and market data
Documents
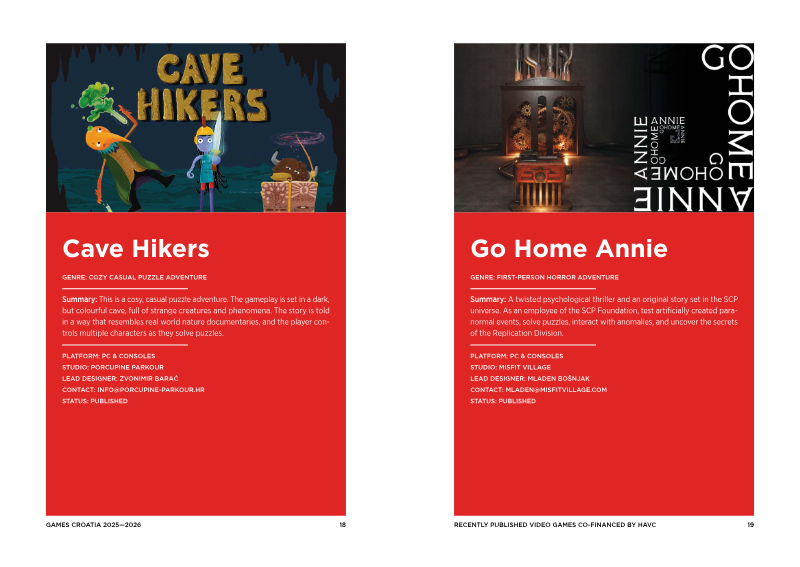
Games Croatia Brochure 2025-2026
The Games Croatia Brochure 2025-2026, published by the Croatian Audiovisual Centre (HAVC) through its Games Croatia initiative, profiles Croatia's video game industry.
- Croatia's industry recorded €72.1M in revenue in 2024, double the 2019 figure.
- The brochure reports 271 active game development entities, including studios, sole traders and associations.
- 86% of studios work on their own intellectual property, according to the brochure.
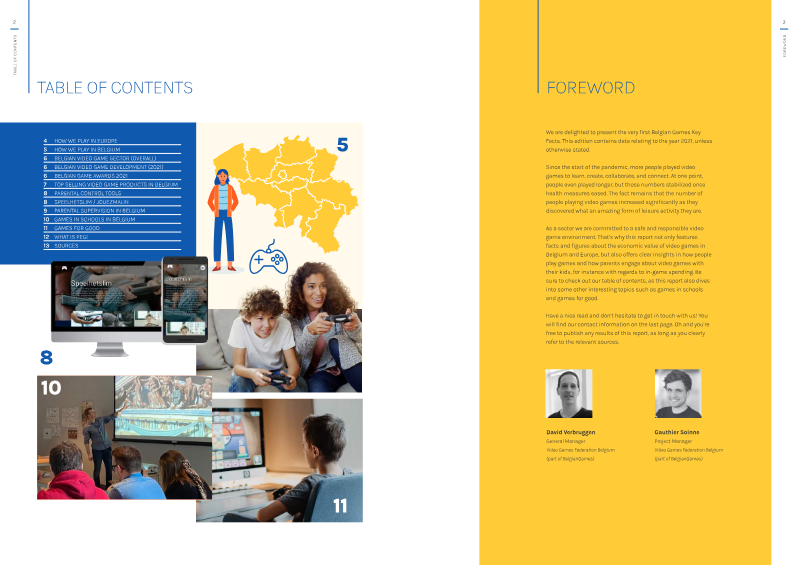

Belgian Games Key Facts 2021
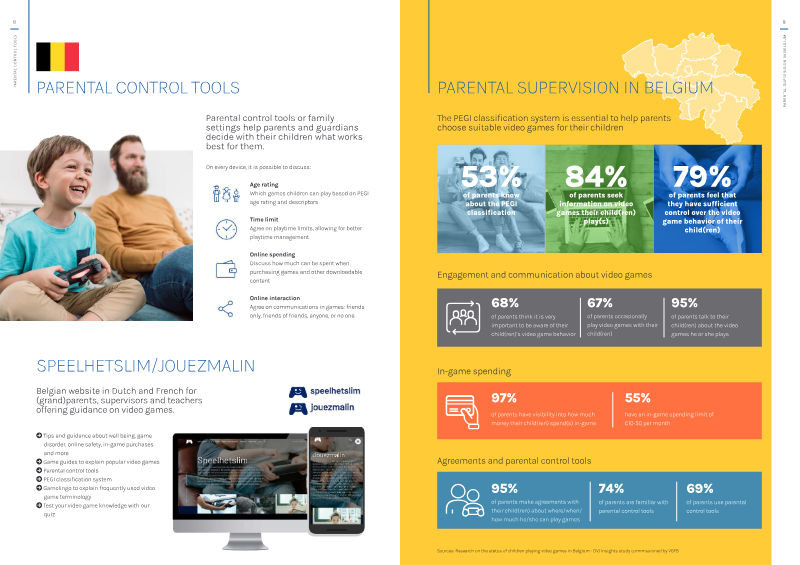
The "Belgian Games Key Facts 2021" report provides an overview of the video game sector in Belgium and Europe for the year 2021, focusing on economic value, player demographics, parental engagement, and the broader societal impact of games.
- Belgium's video game sector was valued at an estimated €600 million in 2021, growing about 4% over 2020.
- Belgian video game development generated €88 million in turnover in 2021 across 110 companies employing 935 full-time equivalents.
- About 52% of Belgians aged 6 to 64 play video games, with an average player age of 31 and women making up 48% of players.

Belgian Games Key Facts 2022
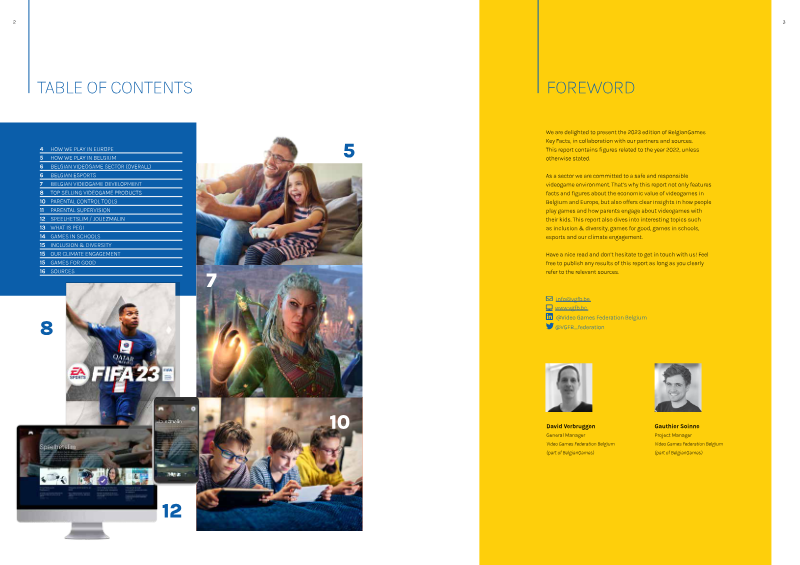
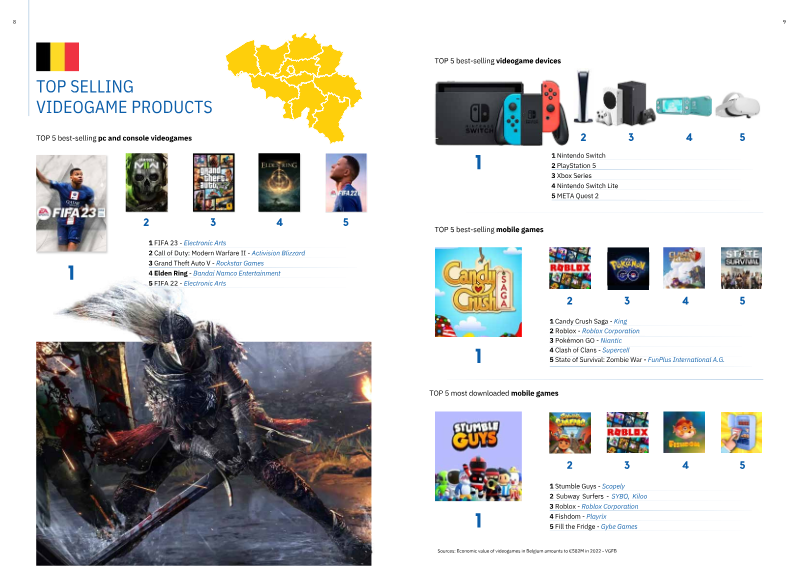
The "Belgian Games Key Facts 2022" report provides a comprehensive overview of the Belgian and European video game markets, focusing on demographic data, usage patterns, economic value, development, esports, and responsible gaming practices.
- The total value of videogames in Belgium reached €582 million in 2022, down 3 percent from 2021 but up 10 percent from the pre-pandemic year 2019.
- Belgian videogame development employed 1,085 full-time equivalents across 133 companies, and mobile game downloads reached roughly 148 million, about one million more than the previous year.
- 53 percent of Belgians aged 6 to 64 play videogames, averaging 8.8 hours per week, with female players making up 46.7 percent of the player base.
Time to Game: Facts, Figures & Inspiration of the Video Game Industry in Belgium 2024
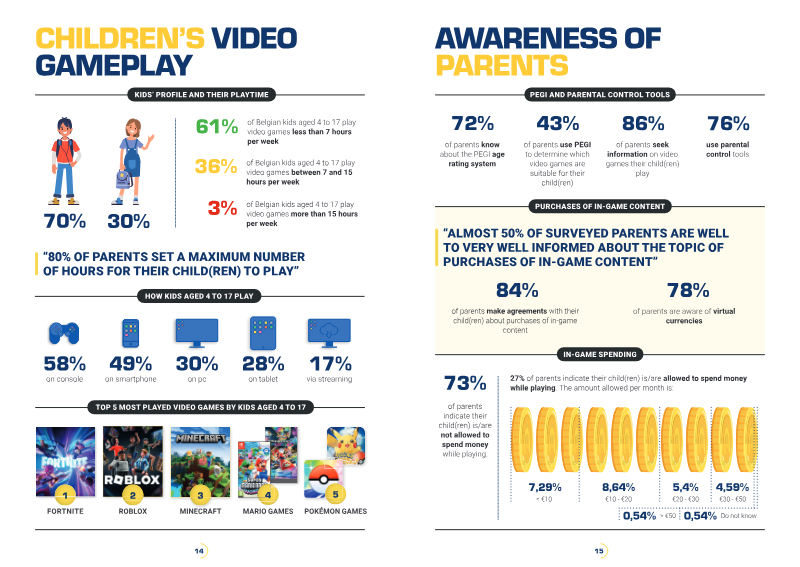
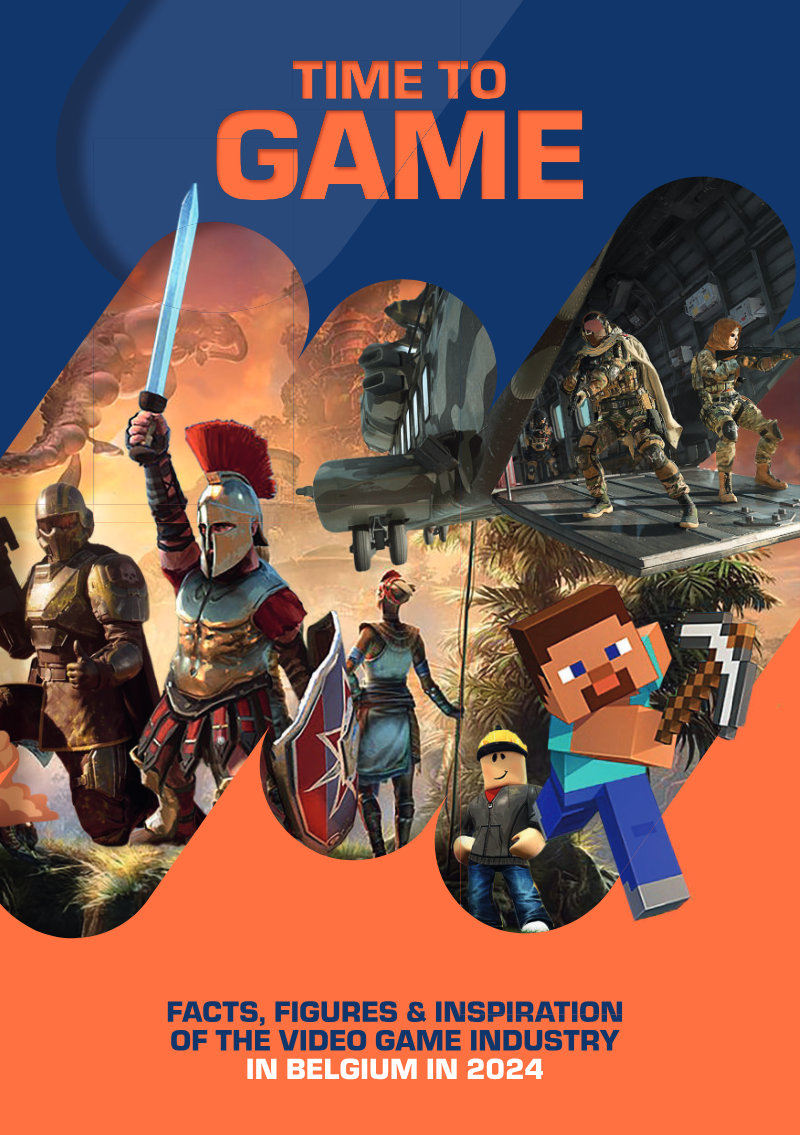
The "Time to Game" report, published in 2024 by the Video Games Federation Belgium, provides an overview of the Belgian video game industry, covering consumer spending, game development, player demographics, children's gameplay habits, and parental awareness of safety tools.
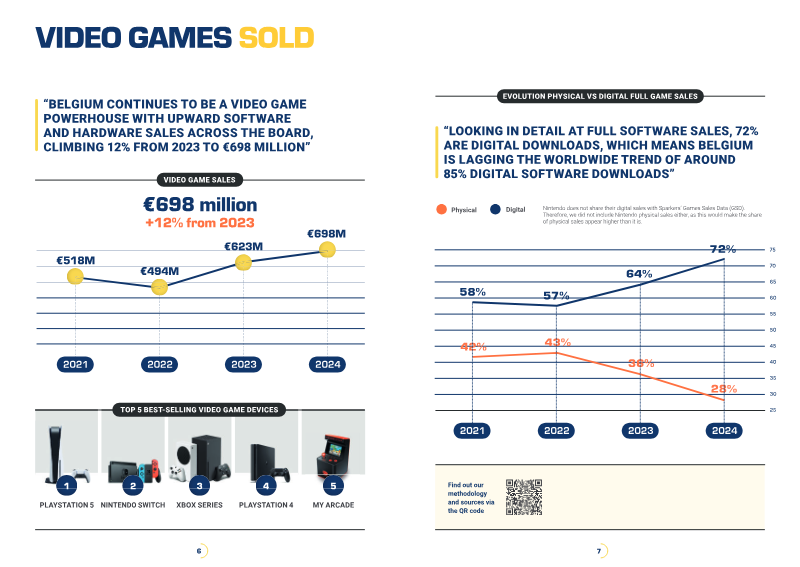
- Belgian video game software and hardware sales rose 12% from 2023 to reach €698 million in 2024.
- Belgium counted 6.2 million gamers in 2024, with more than a third aged over 35, and adventure, puzzle, and shooter games were the most popular genres.
- Digital downloads accounted for 72% of full game sales in Belgium, lagging the worldwide average of around 85% digital, while physical software made up 28%.
Sega Sammy Integrated Report 2023
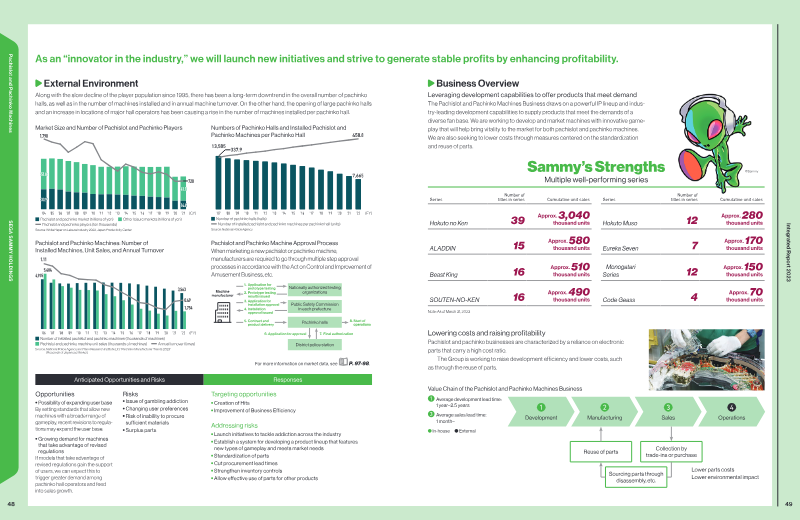
The document is the SEGA SAMMY Holdings Integrated Report 2023, covering the Group's performance for the fiscal year ended March 2023 and its medium-term plan.
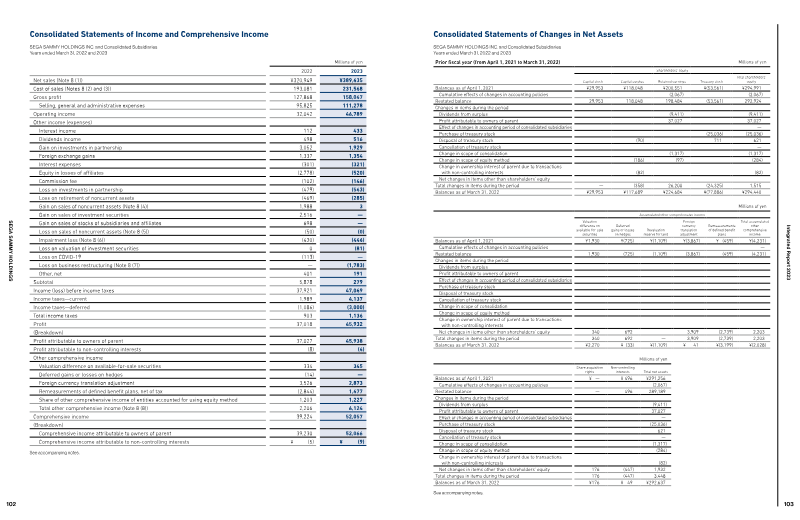
- Consolidated net sales reached ¥389.6 billion for the fiscal year ended March 2023, up 21.4% year on year.
- The Group reports ROE of 14.7% and ordinary income of ¥49.4 billion for the fiscal year ended March 2023.
- Sonic Frontiers had surpassed 3.2 million copies worldwide as of the end of March 2023.
AI Adoption in Video Games: Q2-Q3 2026
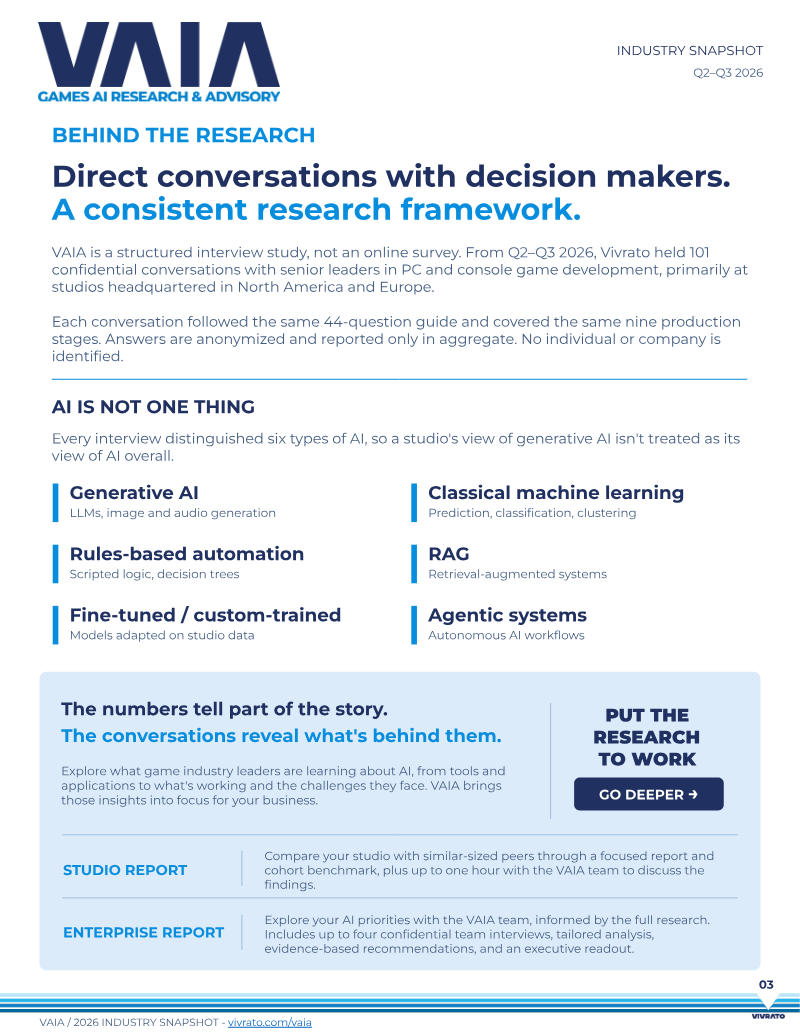
This document provides an industry snapshot of AI adoption in video game development during Q2-Q3 2026.
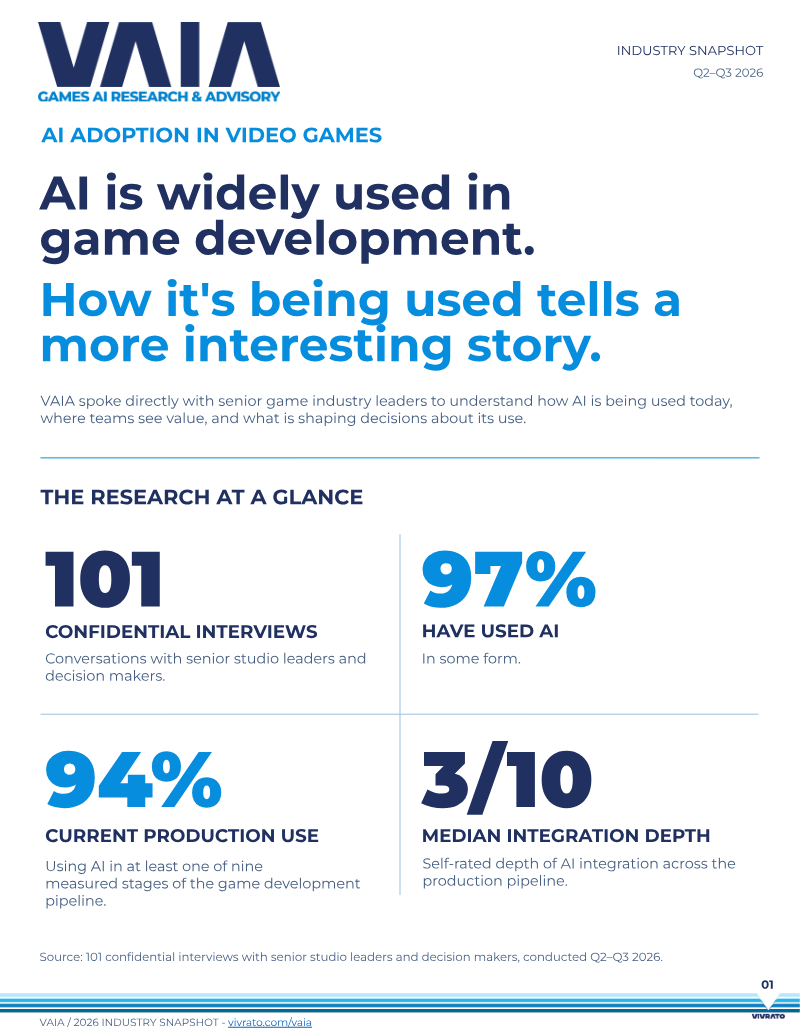
- AI adoption is nearly universal in the video game industry, with 97% of senior studio leaders reporting implementation as of mid-2026.
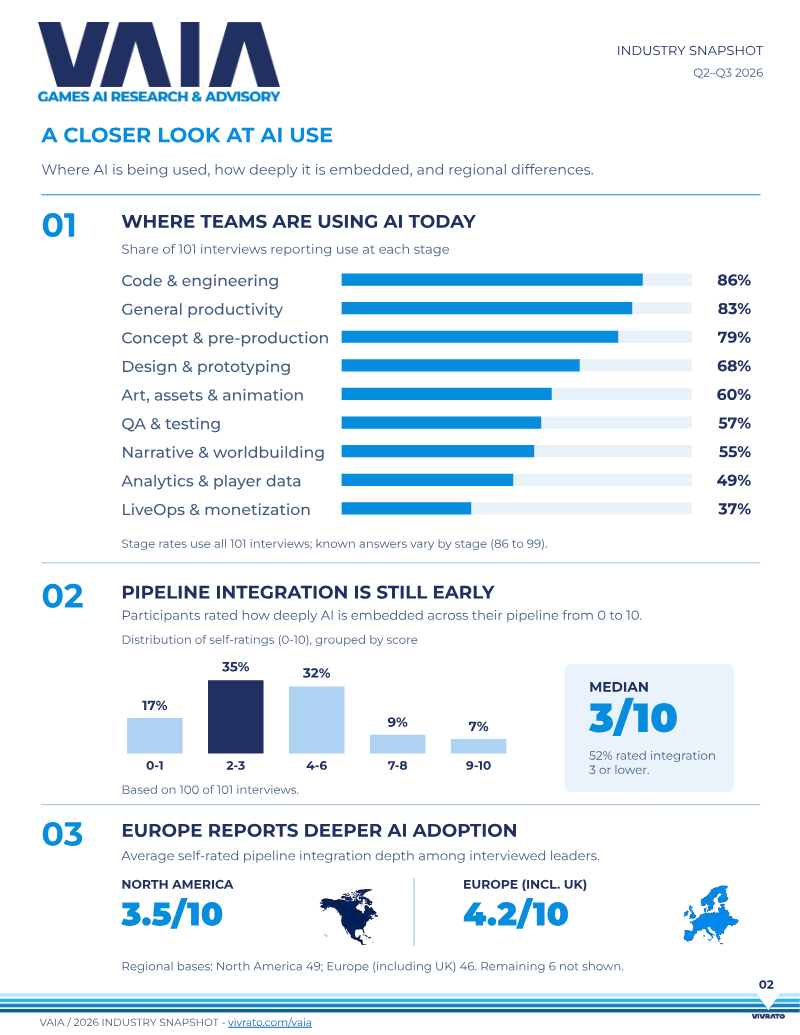
- Despite high adoption rates, AI integration remains shallow, with a median depth of only three out of ten across production pipelines.
- AI is primarily used for technical and administrative tasks, with 86% of studios using it for code and engineering, 83% for productivity, and 79% for concept and pre-production.
Square Enix Annual Report 2021
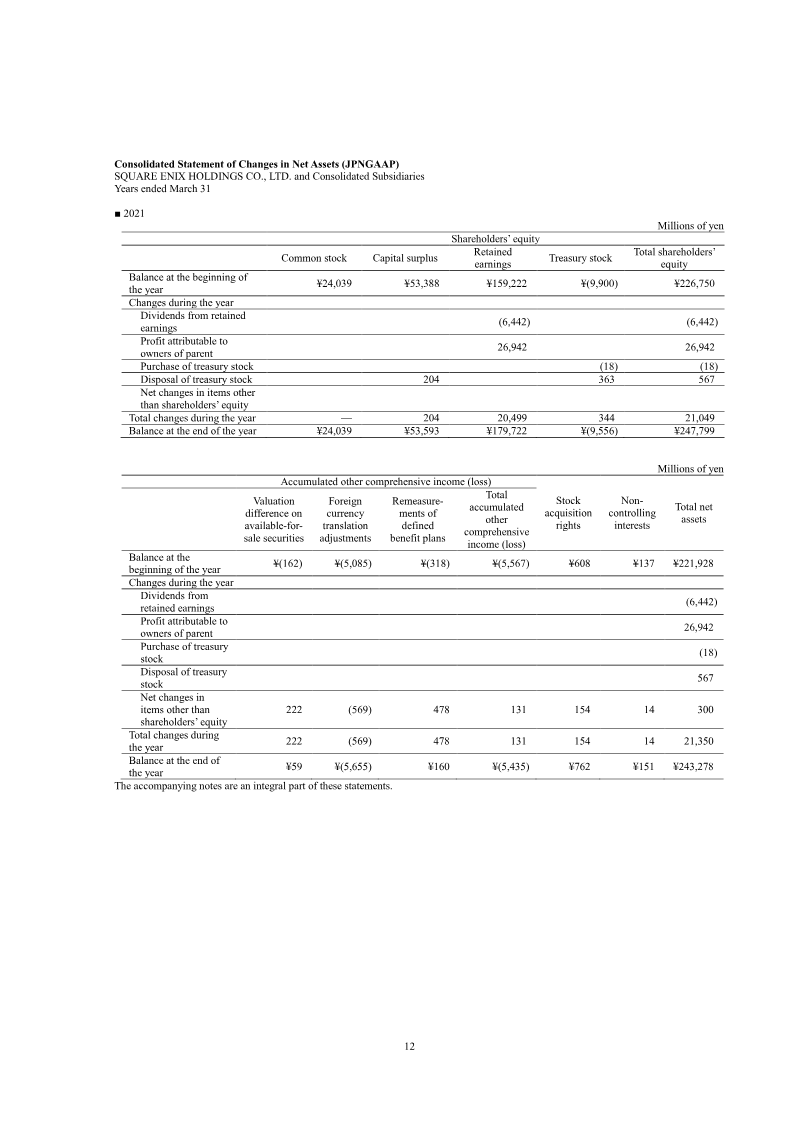
The Square Enix Annual Report 2021 provides a consolidated financial overview of Square Enix Holdings Co., Ltd. and its subsidiaries for the fiscal year ended March 31, 2021.
- The group achieved consolidated net sales of ¥332,532 million and operating income of ¥47,226 million for the fiscal year ended March 31, 2021.
- The Amusement segment recorded an operating loss of ¥1,568 million for the fiscal year ended March 31, 2021, compared to an operating income of ¥1,480 million in the prior fiscal year.
- The Publication segment reported net sales of ¥26,843 million and operating income of ¥11,687 million, marking increases of 38.0% and 61.2% respectively from the prior fiscal year.

GungHo Business Report Vol. 26
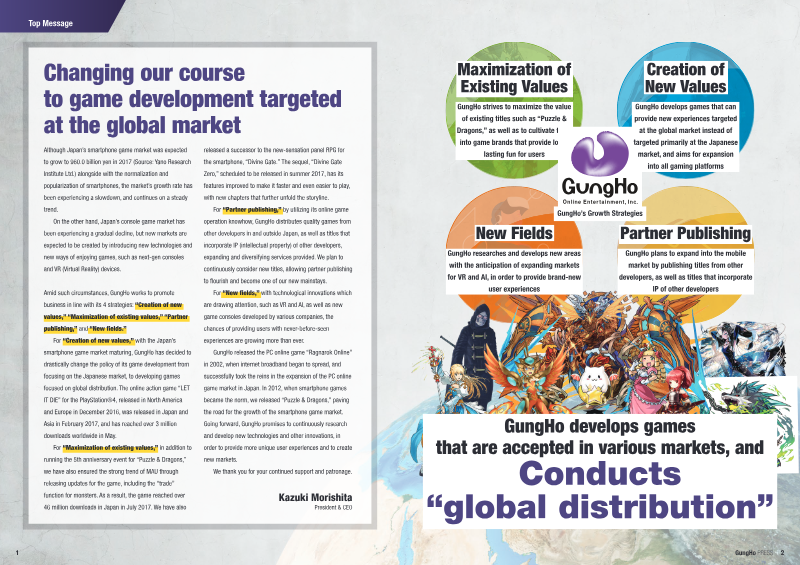
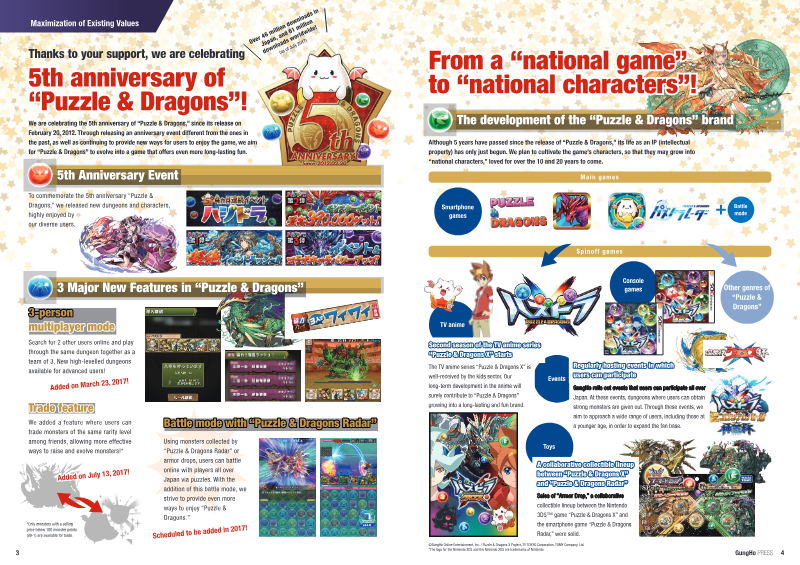
The GungHo Business Report Vol. 26 outlines the company's strategic shift towards global game development and diversification, moving beyond its traditional focus on the Japanese smartphone market.
- GungHo is shifting from a Japan-centric model to a global distribution framework to counter the maturing domestic smartphone market and declining console sector.
- The company is prioritizing long-term brand longevity for its intellectual property, exemplified by ongoing updates to its flagship title, Puzzle & Dragons, which reached over 46 million downloads in Japan by July 2017.
- Financial results for the first half of 2017 show net sales of 49.1 billion yen and operating income of 19.4 billion yen.

COLOPL Annual Report 2019
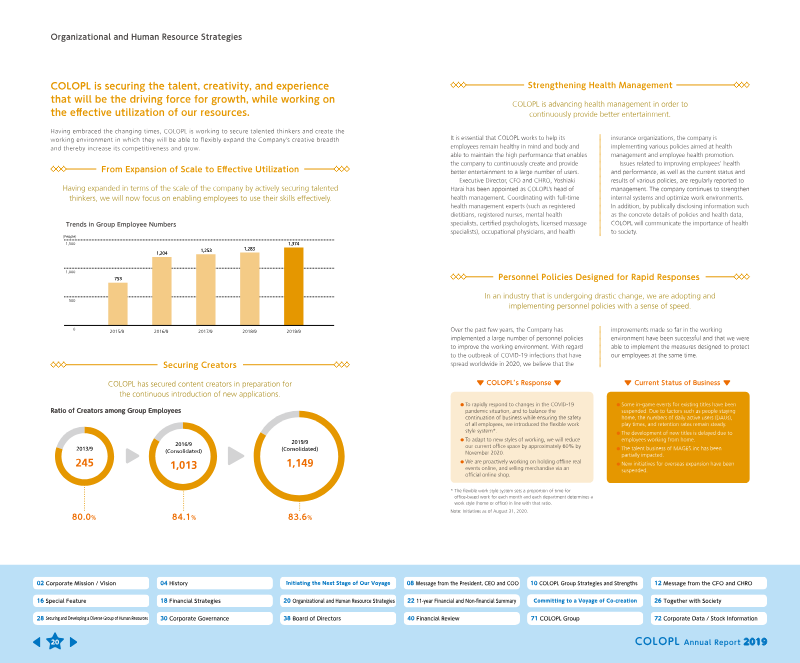
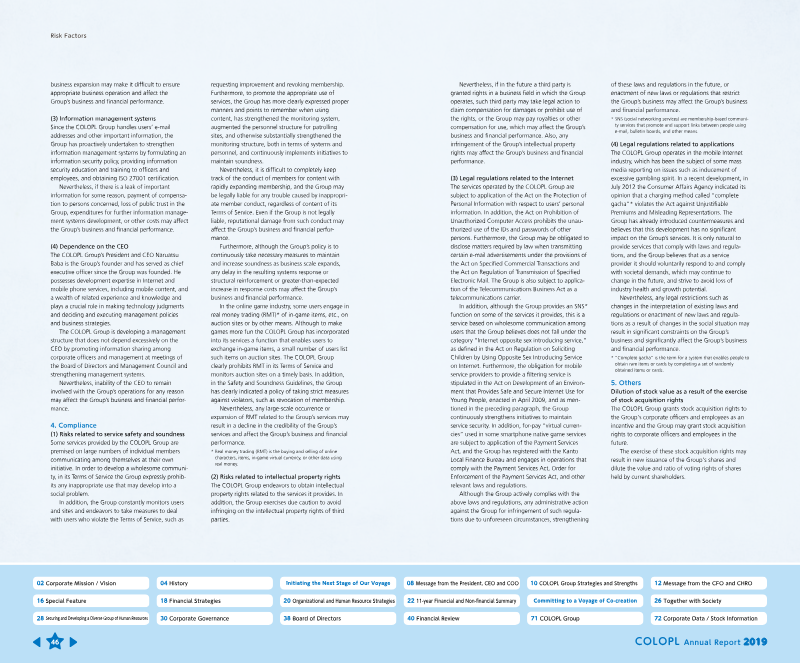
COLOPL's annual report for the fiscal year ended September 30, 2019 covers the Japanese smartphone game company and its Group, presenting its corporate philosophy, history, portfolio strategies, financial position, human resource policies, corporate governance, risk factors, and consolidated financial statements.
- Net sales declined 15.0% year on year to ¥38,920 million, and operating profit fell 57.5% to ¥2,952 million in the fiscal year ended September 30, 2019.
- The company says it has been unable to create a hit game since White Cat Project's 2014 release, and it attributes this partly to not allocating resources well toward the development of new games.
- Dragon Quest Walk, developed by COLOPL with SQUARE ENIX HOLDINGS, exceeded 10 million downloads in the first two months after its September 2019 release.
COLOPL Integrated Report 2022
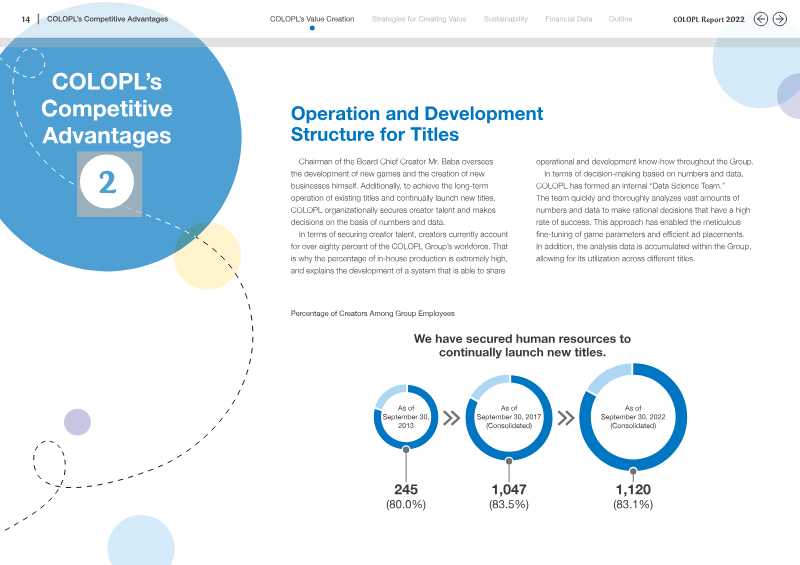
COLOPL, Inc., a Japanese smartphone game company with Group companies in which it holds more than 50% of outstanding shares, presents its Integrated Report 2022 covering the fiscal year ended September 2022 (October 1, 2021 to September 30, 2022).
- Consolidated net sales fell from 37,125 million yen in FY2021 to 32,541 million yen in FY2022, and operating profit fell from 6,320 million yen to 4,310 million yen.
- In the Entertainment Business, net sales decreased 13.9% year on year and operating profit decreased 27.7%, while existing titles did not perform as badly as expected.
- The company states that DRAGON QUEST WALK, which accounts for a major portion of sales, achieved sales at almost the same level as the previous year.

COLOPL Integrated Report 2024
COLOPL's Integrated Report 2024 is the company's annual corporate report covering the fiscal year ended September 2024 (October 1, 2023 to September 30, 2024), with information on the COLOPL Group, defined as COLOPL, Inc. and companies in which it owns more than 50% of outstanding shares.
- COLOPL reported net sales of 25,975 million yen for the fiscal year ended September 2024, down from 30,806 million yen, and an operating loss of 1,208 million yen.
- The report attributes the year-on-year sales decline to a fall in sales of existing titles and a delay in releasing new titles to cover it.
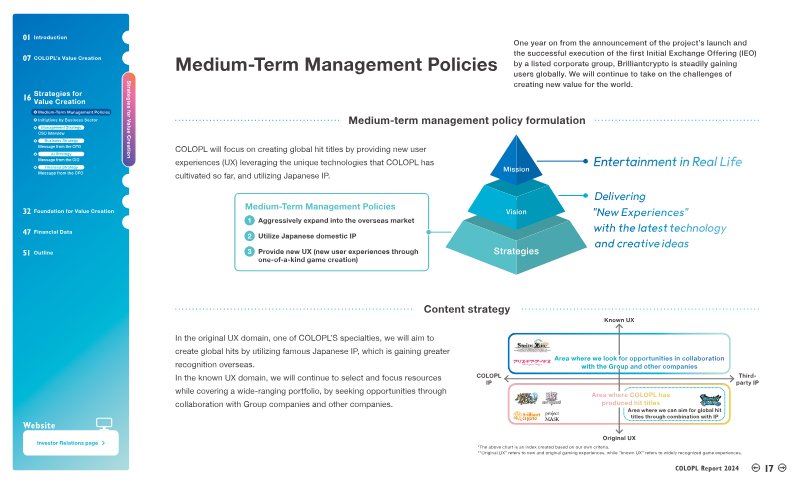
- Brilliantcrypto raised 1.5 billion yen through an IEO of tokens issued by the company, though the amount took time to be reflected in revenue.

COLOPL Report 2025: Integrated Report
COLOPL's 2025 integrated report covers COLOPL, Inc. and its Group companies (companies in which COLOPL, Inc. owns more than 50% of shares as of September 30, 2025) for the fiscal year ended September 2025 (October 1, 2024 to September 30, 2025).
- COLOPL reported consolidated net sales of 25.9 billion yen and operating profit of 1.0 billion yen for the fiscal year ended September 2025, returning to positive profitability after its first operating loss since listing.
- The Investment and Development Business posted segment profit of 1.1 billion yen, while the Entertainment Business posted segment profit of negative 0.1 billion yen.
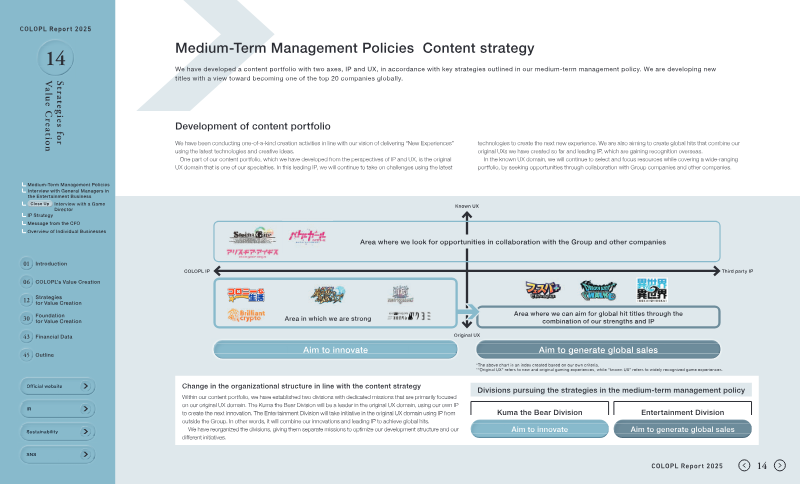
- The company set a medium-term goal of becoming one of the top 20 companies in the global mobile game market, with numerical indicators of consolidated net sales of 100 billion yen or more and consolidated operating profit of 50 billion yen or more.
Writers
Games and companies
Games