Report33 pages
State of the LATAM Games Industry 2026
Latin America has solidified its position as a formidable force in the global gaming landscape, transitioning from a peripheral source of cost-effective labor to a sophisticated hub of creative innovation and live service expertise. Driven by massive, mobile-first player populations in Brazil and Mexico, the region is increasingly defined by high levels of community engagement and a thriving esports culture. While economic challenges such as currency volatility and limited infrastructure persist, the industry is successfully pivoting toward sustainable, long-term business models that prioritize authentic, socially integrated experiences over traditional, short-term monetization strategies.
The regional ecosystem is characterized by a strategic shift toward self-publishing and advanced Live Ops, supported by a deep pool of engineering talent that is increasingly utilizing artificial intelligence to enhance production efficiency. Although major hubs like Brazil and Mexico anchor the market, smaller nations such as Argentina and Ecuador are gaining international visibility through indie innovation and strategic global partnerships. This evolution reflects a broader maturation of the industry, where developers are moving beyond simple localization to address the specific technological and cultural nuances of individual domestic markets.
Success within this territory requires a departure from standardized global frameworks in favor of localized strategies that account for unique payment preferences and regional economic constraints. Despite systemic hurdles regarding access to specialized venture capital and user acquisition, the region offers significant growth potential for developers who commit to long-term engagement. By fostering trust and prioritizing accessibility, the Latin American gaming sector is effectively countering the stagnation currently impacting global mobile markets, establishing itself as a vital, influential player in the international creative economy.
- Brazil and Mexico serve as the region's primary anchors, with Brazil driving engagement across all platforms and Mexico acting as a commercial gateway for global publishers.
- Mexico's gaming industry generated $1.27 billion in revenue in 2024, with mobile and tablet devices accounting for 72% of all gaming activity.
- Brazil hosts a robust ecosystem of over 1,000 developers, while indie game creation in Mexico grew by 30% year-over-year in 2023.
- Successful regional studios like Chile-based TinyBytes have achieved significant scale, with over 100 million downloads and $40 million in lifetime gross revenue from titles like Massive Warfare.
- Growth in the LATAM market is frequently driven by localized payment methods, such as PIX in Brazil and OXXO in Mexico, which are essential for reducing friction in price-sensitive, mobile-first economies.
+3
GamesBeatMay 2026
Report6 pages
CESA Game Industry Report 2025: Launch Seminar Report
The CESA Game Industry Report 2025 Launch Seminar, held in Tokyo on February 20, 2026, served as a platform to analyze the evolving landscape of the Japanese gaming sector. The event introduced the updated 2025 industry report, which features expanded data sets and enhanced international market research to better support the global expansion of Japanese firms. The seminar aimed to address industry needs for technical knowledge sharing, talent development, and cross-sector networking among corporate and academic stakeholders.
Key findings highlight a significant shift toward the integration of generative AI, with approximately half of domestic game companies now utilizing these tools within their development pipelines. While internal production workflows show high adoption rates, industry experts noted a more cautious approach regarding AI-generated content visible to end-users. Legal discussions emphasized the importance of navigating copyright frameworks, specifically distinguishing between AI learning and generation phases, while balancing innovation with intellectual property risks.
Government representatives from the Ministry of Economy, Trade and Industry and the Agency for Cultural Affairs outlined strategic support for the content industry, targeting 20 trillion yen in overseas sales by 2033. Policy initiatives focus on multi-year funding, tax incentives, and robust talent development programs to ensure long-term competitiveness. Furthermore, legal experts underscored the increasing complexity of global regulatory environments, noting that Japanese companies must proactively manage diverse international requirements regarding data privacy, monetization, and rating systems. By synthesizing perspectives from government, legal, and development sectors, the seminar emphasized that strategic investment and regulatory compliance are essential for the sustainable growth of Japan’s gaming industry in a globalized market.
- The Japanese government has set a strategic target to reach 20 trillion yen in overseas content industry sales by 2033.
- Approximately 50% of domestic game companies have integrated generative AI into their internal development pipelines.
- Industry adoption of generative AI remains bifurcated, with high usage in production workflows but a cautious, risk-averse approach toward AI-generated content delivered to end-users.
- Legal frameworks are currently prioritizing the distinction between AI learning and generation phases to mitigate intellectual property risks while fostering innovation.
- Government policy initiatives to support industry competitiveness include multi-year funding, tax incentives, and dedicated talent development programs.
CESA – Computer Entertainment Supplier's Association
Report39 pages
Bilan du Marché Français: 2025
The French video game market demonstrated significant resilience in 2025, generating €5.856 billion in total revenue, a 2.9% increase over the previous year. This performance marks the second-highest in the industry’s history, solidifying its position as a cornerstone of the national cultural economy. Growth was primarily fueled by a rebound in console hardware sales and a record-breaking 11% surge in the mobile sector, which reached €1.792 billion. The market maintains a balanced ecosystem, with consoles commanding a 44% share, followed by mobile at 31% and PC gaming at 26%.
Software remains the primary revenue driver, accounting for over two-thirds of the total market. While physical game sales faced a double-digit decline, this was effectively mitigated by the expansion of digital content, including microtransactions and downloadable content. Electronic Arts emerged as the leading publisher across console and PC platforms, while the mobile landscape remains almost entirely dominated by free-to-play models, which now represent 94% of mobile revenue.
The industry’s reach expanded to 40.2 million players, characterized by a maturing demographic where adults comprise 88% of the base. High engagement levels persist, with 76% of players gaming on a weekly basis and a growing trend toward cross-platform usage. Alongside this growth, there is a heightened emphasis on responsible gaming. Parental involvement has reached new heights, with 67% of parents actively monitoring gaming habits through PEGI classifications and standardized parental control tools. This commitment to safety, supported by organizations like the SELL and events such as Paris Games Week, ensures that the industry continues to thrive as a mature, socially responsible, and culturally significant sector within France.
- The French video game market reached €5.856 billion in 2025, a 2.9% year-over-year increase and the second-highest revenue in the industry's history.
- Mobile gaming experienced an 11% surge to reach €1.792 billion, with free-to-play models accounting for 94% of that sector's total revenue.
- Market share is distributed across consoles (44%), mobile (31%), and PC (26%), with software sales—driven by digital content and microtransactions—comprising over two-thirds of total revenue.
- The player base has expanded to 40.2 million people, 88% of whom are adults, with 76% of all players engaging with games on a weekly basis.
- Physical game sales suffered a double-digit decline in 2025, necessitating a shift toward digital distribution and downloadable content strategies.
+3
SELL – Syndicat des Éditeurs de Logiciels de Loisirs

Report45 pages
Corporate Responsibility Report 2013
Modern Times Group (MTG) maintains a comprehensive corporate responsibility strategy centered on media integrity, employee welfare, environmental stewardship, and ethical business governance. During the 2013 fiscal year, the organization prioritized digital development and the protection of young audiences, achieving recognition in the Dow Jones Sustainability Europe Index. With a workforce of 3,361 employees and net sales reaching 14,129 MSEK, the company leveraged its extensive media reach to contribute over 42 million TSEK in combined financial and media-time donations to charitable causes, most notably through the Reach for Change social entrepreneurship foundation.
Operational performance in 2013 reflected a mix of progress and systemic challenges. Environmental efforts yielded a strong score of 88 out of 100 in the CDP report, supported by energy-efficient infrastructure and carbon disclosure initiatives, despite a 7% rise in total carbon emissions linked to corporate expansion. Internally, the company implemented rigorous anti-bribery policies and updated editorial standards. However, workforce metrics revealed persistent disparities, including a gender pay gap where female remuneration averaged 70% of male earnings, alongside a decline in return-to-work rates following parental leave.
The reporting process, conducted in accordance with GRI G4 Core standards and independently assured by Ethos International, identified customer data integrity and child protection as the most material issues for the business. While the company successfully established a new Corporate Responsibility Advisory Group to oversee governance, auditors noted significant limitations in existing data collection systems. Future strategic objectives focus on harmonizing human resources data, improving supply chain management, and refining internal reporting mechanisms to better track labor and training metrics across the company’s global operations.
- MTG achieved 14,129 MSEK in net sales while contributing 42 million TSEK in financial and media-time donations, primarily through the Reach for Change foundation.
- The company reported a significant gender pay gap in 2013, with female remuneration averaging only 70% of male earnings.
- MTG earned a score of 88 out of 100 in the CDP environmental report, though total carbon emissions increased by 7% due to corporate expansion.
- Materiality assessments identified customer data integrity and child protection as the primary strategic risks for the business.
- The organization maintained a workforce of 3,361 employees while experiencing a decline in return-to-work rates following parental leave.
+1
Modern Times Group
Report24 pages
Modern Responsibility Report 2010
MTG’s 2010 Modern Responsibility initiative establishes a comprehensive framework for integrating economic, environmental, and social accountability across its global media operations. Spanning 33 countries, the company’s strategy centers on four pillars: responsible business conduct, broadcasting integrity, employee relations, and community engagement. By adopting the Global Reporting Initiative framework and conducting a formal materiality analysis, the organization has aligned its internal governance with stakeholder priorities, specifically emphasizing anti-corruption, regulatory compliance, and fair employment practices.
Operational performance in 2010 reflects a dual focus on professional development and social impact. The company invested heavily in human capital through the MTG Academy, which emphasizes leadership and sales training, while simultaneously promoting diversity and female representation in management. Beyond internal operations, the company leveraged its media influence to drive social change, donating 111 million SEK in airtime to charitable causes and launching foundations such as MTG United for Peace and Playing for Change. These efforts underscore a commitment to using broadcasting platforms to support disaster relief, cancer research, and youth development.
Environmental stewardship remains a critical, albeit challenging, area of focus. Total climate impact reached approximately 15,000 tons of CO2e in 2010, driven largely by business travel and facility energy consumption. Despite a 36 percent increase in travel-related emissions, the company has implemented rigorous mitigation strategies, including the adoption of ISO 14001 standards and a mandate to reduce CO2 emissions per employee by 5 percent by early 2012. Through the integration of green training for 59 percent of its staff and the expansion of video conferencing, the organization seeks to balance its international growth with a measurable reduction in its corporate carbon footprint.
- MTG established a 2010 corporate responsibility framework across 33 countries, utilizing the Global Reporting Initiative to prioritize anti-corruption, regulatory compliance, and fair employment.
- The company donated 111 million SEK in airtime to charitable causes in 2010, supporting initiatives like MTG United for Peace and Playing for Change.
- MTG’s total climate impact reached approximately 15,000 tons of CO2e in 2010, with business travel-related emissions increasing by 36 percent.
- To mitigate environmental impact, the company mandated a 5 percent reduction in CO2 emissions per employee by early 2012 and provided green training to 59 percent of its staff.
- Human capital investment in 2010 focused on leadership and sales training through the MTG Academy, alongside efforts to increase female representation in management.
+1
Modern Times Group
Report42 pages
Modern Responsibility Report 2009
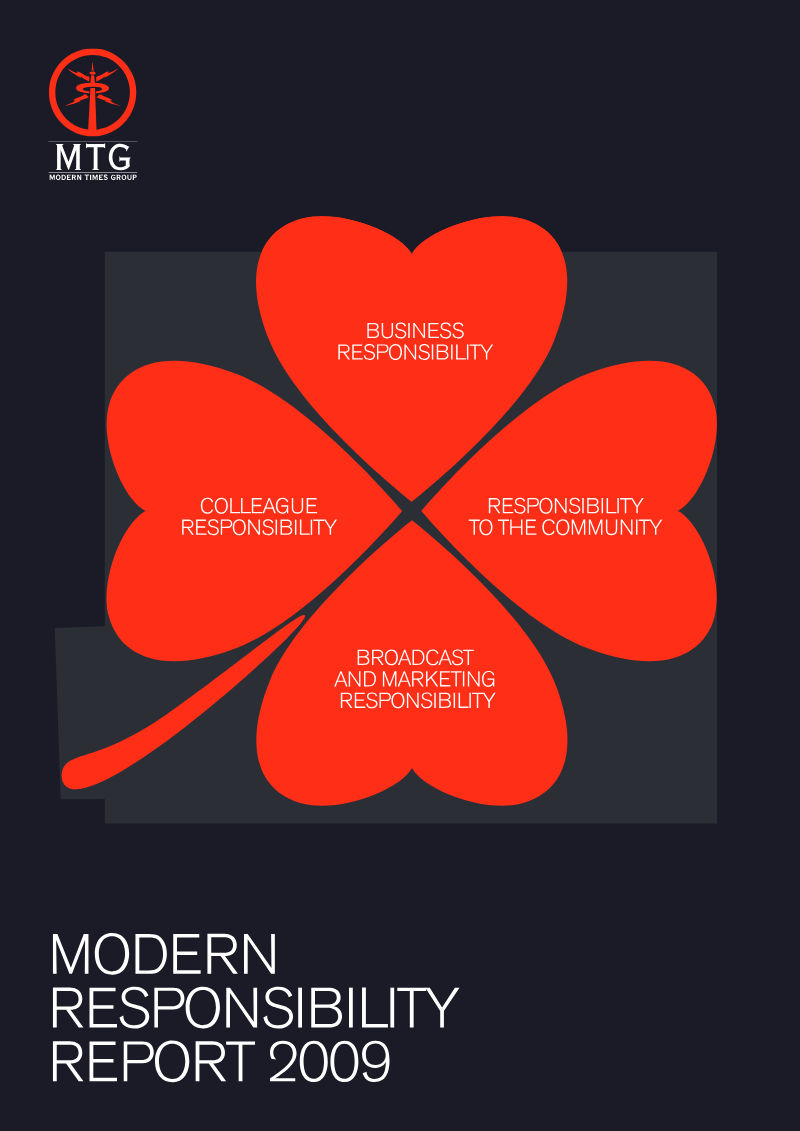
Modern Times Group (MTG) maintains a comprehensive commitment to integrating corporate responsibility into its broadcasting and entertainment operations across 31 countries. The primary objective of its 2009 strategic framework is to ensure sustainable business growth through rigorous governance, ethical conduct, and social accountability. By formalizing environmental policies and establishing a structured oversight committee, the company seeks to balance its commercial objectives with its impact on society and the environment, even amidst the challenging economic climate of the late 2000s.
Operational performance is anchored by a robust governance model that emphasizes transparency, fair competition, and strict adherence to a global code of conduct. Key initiatives include the implementation of a whistleblower policy, mandatory compliance training, and the protection of minors through regulated content and parental controls. The company’s focus on human capital is evidenced by the MTG Academy, which provided training to 81 percent of permanent staff, and a diverse workforce spanning 38 nationalities. These efforts are supported by internal audits and key performance indicators designed to enhance the measurability of ethical and social initiatives.
Environmental stewardship remains a central pillar of the company’s strategy, with carbon footprint audits now covering operations in 19 countries. In 2009, the organization recorded a total climate impact of approximately 13,000 tons of CO2e, prompting investments in energy-efficient infrastructure and reduced travel requirements. Beyond internal reductions, the company leverages its media platforms to drive social change, notably through the "Playing for Change" initiative and the donation of airtime to support environmental and social causes. By aligning its broadcasting reach with philanthropic goals, the company reinforces its position as a responsible stakeholder in the global media landscape.
- MTG established a formal corporate responsibility framework in 2009 to integrate governance, ethical conduct, and social accountability across its broadcasting operations in 31 countries.
- The company recorded a total climate impact of approximately 13,000 tons of CO2e in 2009, leading to the implementation of carbon footprint audits across 19 countries and investments in energy-efficient infrastructure.
- Human capital development was prioritized through the MTG Academy, which provided training to 81 percent of the company's permanent staff.
- MTG maintains a diverse workforce representing 38 nationalities, supported by a governance model that includes mandatory compliance training and a formal whistleblower policy.
- The company utilizes its media reach for philanthropic purposes, specifically through the 'Playing for Change' initiative and the donation of airtime to support social and environmental causes.
+1
Modern Times Group
Report62 pages
Annual Report 2024: Savvy Games Group
Savvy Games Group has established itself as a premier global force in interactive entertainment, currently ranking eighth worldwide by net revenue. The organization serves as the primary vehicle for Saudi Arabia’s National Gaming and Esports Strategy, which seeks to generate $13.3 billion in GDP contribution and create 39,000 jobs by 2030. By integrating publishing, development, and esports community building, the group effectively navigates the challenges of a saturated global market, positioning the Kingdom as a central hub for the international gaming industry.
The company’s operational success is underpinned by a robust capital deployment strategy, with over $12 billion invested across nine major acquisitions since 2021. Under the leadership of CEO Brian Ward, the group has scaled to nearly 4,000 employees across 22 countries, supported by a governance structure that includes specialized committees for investment, risk, and executive oversight. This organizational framework ensures that the group maintains strategic alignment while pursuing aggressive growth in both domestic and international markets.
Key business units, specifically Scopely and the ESL FACEIT Group, have delivered record-breaking financial results and solidified the company’s market dominance. The ESL FACEIT Group currently commands a 40% share of the global esports market, engaging over 225 million users through high-profile events like the inaugural Esports World Cup. Simultaneously, internal development efforts through Steer Studios and strategic partnerships with firms like Niantic and Xsolla continue to diversify the portfolio. These collective efforts demonstrate a commitment to scaling interactive entertainment through high-engagement competitive platforms and localized talent development, ensuring long-term sustainability within the global gaming ecosystem.
- Savvy Games Group ranks as the eighth-largest global gaming company by net revenue and serves as the primary vehicle for Saudi Arabia’s goal to contribute $13.3 billion to GDP and create 39,000 jobs by 2030.
- The organization has deployed over $12 billion in capital across nine major acquisitions since 2021 to scale its operations to nearly 4,000 employees across 22 countries.
- The ESL FACEIT Group holds a 40% share of the global esports market and engages more than 225 million users through platforms like the Esports World Cup.
- Business units Scopely and ESL FACEIT Group are the primary drivers of the company's record-breaking financial performance and current market dominance.
- The group is diversifying its portfolio through internal development at Steer Studios and strategic partnerships with firms including Niantic and Xsolla.
+2
Savvy Games Group
Report2 pages
Videogiocatori in Italia
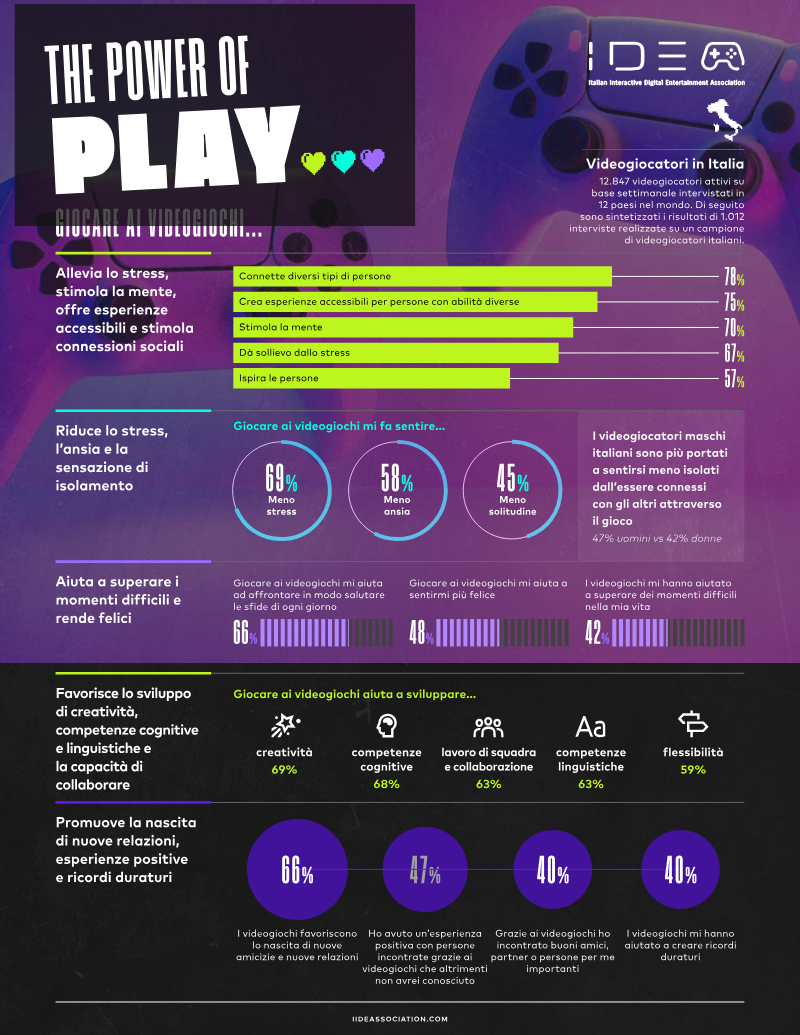
The Italian gaming landscape is characterized by a strong emphasis on the psychological and social benefits of interactive entertainment. Based on a survey of 1,012 Italian gamers, which forms part of a broader 12-country study involving 12,847 active weekly players, the research highlights that gaming serves as a vital tool for stress relief, cognitive stimulation, and social connection. A significant majority of respondents report that gaming alleviates stress and anxiety, fosters creativity, and enhances problem-solving skills, with 69% of participants noting that the medium stimulates the mind and improves teamwork capabilities.
Social interaction remains a cornerstone of the Italian gaming experience. While solitary play is common on a daily basis, approximately half of the respondents prefer engaging with others through online platforms on a weekly basis. This social dimension is particularly prevalent among male gamers, who show a higher propensity for online multiplayer interaction. Furthermore, the data indicates that gaming acts as a bridge for building new relationships, with many users reporting that they have formed lasting friendships or met significant partners through in-game experiences.
The demographic reach of gaming in Italy is broad, though usage patterns vary by age and gender. Engagement is most concentrated within the 19-34 age bracket, and there is a notable adoption of in-game communication tools, particularly among male players. Ultimately, the findings suggest that gaming is perceived not merely as a pastime, but as a constructive activity that supports mental well-being, facilitates personal development, and provides a reliable framework for community building in an increasingly digital society.
- 69% of Italian gamers report that interactive entertainment stimulates the mind and improves teamwork capabilities.
- Gaming is primarily utilized as a tool for stress relief, anxiety reduction, and the enhancement of cognitive skills like creativity and problem-solving.
- Approximately 50% of Italian gamers engage in online multiplayer sessions on a weekly basis, highlighting the medium's role as a social platform.
- The 19-34 age demographic represents the most concentrated segment of gaming engagement in Italy.
- In-game environments serve as significant social hubs, with many users reporting the formation of lasting friendships and romantic partnerships through digital play.
IIDEA
Report1 pages
Video Games as a Tool for Mental Resilience: Italy
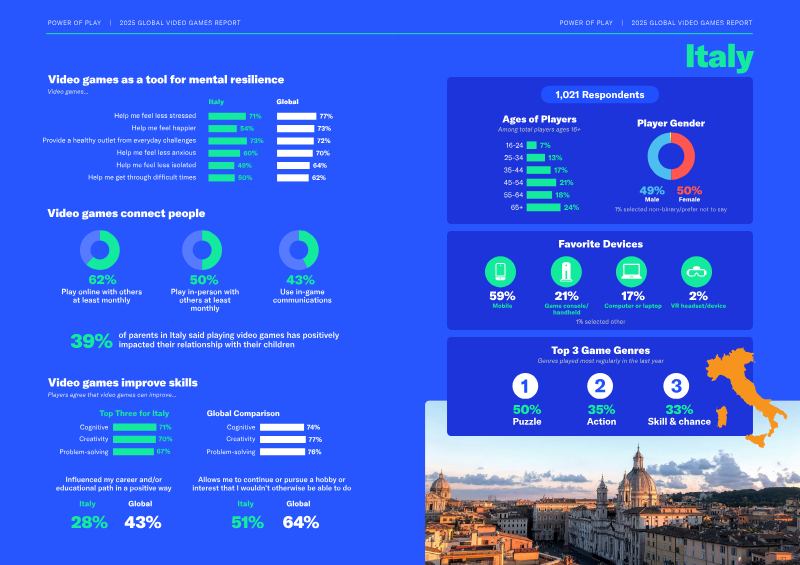
Video games serve as a significant mechanism for mental resilience and emotional regulation among the Italian population. A survey of 1,021 respondents aged 16 and older reveals that a substantial majority of Italian players utilize gaming to mitigate negative psychological states. Specifically, 71% of participants report that gaming helps reduce stress, while 60% use it to manage anxiety and 49% rely on it to combat feelings of isolation. These figures demonstrate that gaming functions as a vital outlet for navigating everyday challenges and difficult life transitions, with 50% of respondents explicitly noting that the medium helps them endure personal hardships.
The demographic profile of the Italian gaming community is broad, with the largest segment of players falling into the 45-54 age bracket at 21%, followed closely by those aged 65 and older at 24%. Mobile devices remain the primary platform for 59% of users, significantly outpacing consoles and computers. Social connectivity is a core component of the experience, as 62% of players engage in online multiplayer sessions at least monthly. Beyond emotional support, gaming is perceived as a tool for cognitive development, with 71% of players reporting improvements in cognitive function, 70% in creativity, and 67% in problem-solving skills.
The impact of gaming extends into familial and professional spheres, fostering positive interpersonal dynamics and skill acquisition. Approximately 39% of parents in Italy report that shared gaming experiences have strengthened their relationships with their children. While the influence on career paths remains lower in Italy at 28% compared to the global average of 43%, the medium continues to provide a unique space for pursuing hobbies and educational interests. Puzzle, action, and skill-based games represent the most popular genres, underscoring a preference for interactive experiences that challenge the mind while providing a structured environment for relaxation.
- Gaming is a primary tool for mental health in Italy, with 71% of players using it to reduce stress, 60% to manage anxiety, and 49% to combat isolation.
- The Italian gaming demographic is older than often assumed, with the 65+ age group representing 24% of players and the 45-54 bracket accounting for 21%.
- Mobile devices are the dominant gaming platform in Italy, utilized by 59% of the population compared to consoles and computers.
- Beyond emotional regulation, 71% of Italian players report improvements in cognitive function, 70% in creativity, and 67% in problem-solving skills.
- Social connectivity is a key driver of engagement, with 62% of players participating in online multiplayer sessions at least once a month.
IIDEA – Italian Interactive Digital Entertainment Association
Whitepaper13 pages
Gamer Motivation Profile: Empirical Research and Data Insights
The Gamer Motivation Profile provides a comprehensive empirical framework for understanding player behavior through a psychometric model that categorizes gaming preferences into twelve distinct motivational drivers. These drivers—organized into six primary clusters including Action, Social, Mastery, Achievement, Immersion, and Creativity—allow developers and marketers to quantify why specific audiences engage with particular game titles. By linking psychometric data with demographic variables and specific game franchises, the model offers a data-driven approach to audience segmentation and product positioning.
The research is built upon a robust dataset derived from over 1.75 million global participants who have completed the Gamer Motivation Profile survey. This large-scale, ongoing collection of data enables real-time analysis of player demographics, such as age, gender, and play frequency, alongside their psychological motivations. The methodology utilizes factor analysis to identify how various gaming preferences cluster together, providing a statistically sound basis for comparing individual titles against broader genre norms.
The primary utility of this research lies in its ability to generate actionable insights for game development and player acquisition. Through a dynamic dashboard, users can perform side-by-side comparisons of different franchises, identify "game neighborhoods" based on shared motivational profiles, and filter titles by specific criteria to uncover underserved market segments. By mapping how individual games deviate from genre benchmarks, the model helps stakeholders prioritize development features, refine marketing messaging, and identify potential competitors even across disparate genres. This analytical toolset is designed to assist industry professionals in making evidence-based decisions regarding portfolio management and the strategic targeting of core and mid-core gaming audiences.
- The Gamer Motivation Profile utilizes a dataset of over 1.75 million global participants to categorize player behavior into twelve distinct motivational drivers across six primary clusters.
- The psychometric model employs factor analysis to link player demographics, such as age and gender, with specific gaming preferences to enable precise audience segmentation.
- Developers can use the framework to compare individual game franchises against broader genre benchmarks to identify how specific titles deviate from industry norms.
- The research enables the identification of 'game neighborhoods' based on shared motivational profiles, allowing stakeholders to uncover underserved market segments across different genres.
- The analytical toolset supports evidence-based decision-making for portfolio management, feature prioritization, and the strategic targeting of core and mid-core gaming audiences.
+1
Quantic Foundry
Presentation18 pages
Gamer Motivation Profile: Empirical Research Methodology
The Gamer Motivation Profile provides an empirical framework for understanding player behavior by categorizing gaming preferences into twelve distinct motivational factors. Developed through psychometric techniques and factor analysis, the model identifies how specific gaming desires—such as competition, immersion, or mastery—cluster together to drive player engagement. The primary thesis posits that gaming motivations exist on a spectrum, where both high and low scores serve as critical indicators of a player’s preferences, allowing for a nuanced analysis of why individuals gravitate toward specific titles or genres.
The research is underpinned by a robust dataset of over 1.25 million unique gamers worldwide, with a demographic composition of 74% male, 22% female, and 3% non-binary, and a median age of 23. The geographic scope is global, with the largest concentrations of participants in North America (33%) and Western Europe (14%). Data collection relied on a five-minute online survey, which achieved high internal and test-retest reliability. By mapping these motivations against a 50th-percentile industry norm, the model allows analysts to visualize which factors are disproportionately important for specific game audiences, effectively linking demographic data with franchise-specific engagement.
The twelve motivations are grouped into six thematic clusters: Action-Social (Destruction, Excitement, Community, Competition), Mastery-Achievement (Challenge, Strategy, Completion, Power), and Immersion-Creativity (Fantasy, Story, Discovery, Design). Each factor is defined by its behavioral anchors, providing a clear distinction between high-intensity, goal-oriented play and more relaxed, expressive, or exploratory experiences. By utilizing this standardized methodology, the research offers an actionable tool for developers and industry analysts to decode player behavior, predict engagement patterns, and better align game design with the psychological needs of diverse gaming audiences.
- The Gamer Motivation Profile categorizes player behavior into twelve distinct factors grouped into six thematic clusters: Action-Social, Mastery-Achievement, and Immersion-Creativity.
- The model is built on a global dataset of over 1.25 million unique gamers, providing a statistically significant foundation for analyzing player engagement.
- The participant demographic is 74% male, 22% female, and 3% non-binary, with a median age of 23 and a primary geographic concentration in North America (33%) and Western Europe (14%).
- Gaming motivations exist on a spectrum where both high and low scores serve as critical indicators, allowing analysts to map specific player preferences against a 50th-percentile industry norm.
- The framework uses psychometric techniques and factor analysis to link demographic data with franchise-specific engagement, enabling developers to predict player behavior and align design with psychological needs.
+2
Quantic Foundry
Report20 pages
Global Gaming Report Q1 2026
LOS ANGELES | SAN FRANCISCO | NEW YORK | LONDON | PARIS | MUNICH | BERLIN | DUBAI PROVEN TRACK RECORD IN GAMING M&A AND GROWTH FINANCING ADVISORY PROVEN TRACK RECORD IN GAMING M&A AND GROWTH FINANCING ADVISORY MICHAEL METZGER JULIAN RIEDLBAUER Linkedin - Free social media icons MOHIT PAREEK Linkedin - Free social media icons MICHAEL METZGER JULIAN RIEDLBAUER ...
- Q1 2026 saw 106 private placement deals totaling $785 million, a significant decrease from Q1 2025's $5.0 billion across 149 deals, indicating a cooling investment landscape.
- Project financing is now the primary funding path for studios due to headwinds in studio equity, with dedicated User Acquisition (UA) funds emerging as a new lifeline for mid-stage mobile studios.
- Key strategics to watch include PIF/Scopely, KRAFTON, NCSoft, Tencent, MTG, Take-Two, Netflix, everplay, and Keywords Studios, while Private Equity is expected to drive take-private transactions of publicly listed gaming firms.
- AI, User-Generated Content (UGC), and tech platforms remain top investment areas, with a projected surge in Augmented Reality (AR) activity, exemplified by RayNeo's eSIM-enabled AR glasses and 24% AR glasses market share in Q3 2025.
- Notable M&A activity includes NCSOFT acquiring a 70% stake in JustPlay for $202 million, Nazara Technologies acquiring a 50% controlling stake in Bluetile Games for $100.3 million, and Mattel taking full ownership of Mattel163 for $159 million.
+1
Drake Star PartnersApr 2026

Report45 pages
Video Game Market Update: Q1 2026
This report is provided for general information and discussion purposes only and is intended solely for subscribers. It does not constitute a financial promotion, investment advice, or a recommendation to engage in any investment activity. The content reflects the views of the authors at the time of publication and may be subject to change without notice.
- The console market reached a record $21.7 billion in Q1 2026, primarily driven by the Nintendo Switch 2's first holiday season, while Sony and Microsoft experienced year-over-year revenue declines.
- Mobile gaming's in-app purchase (IAP) revenue has plateaued, with Q1 2026 gross IAP revenue at $20.6 billion, while install volumes hit multi-year lows, indicating a shift towards monetization efficiency.
- Mergers and Acquisitions (M&A) activity in Q1 2026 saw a high quarterly deal value of $7.7 billion across 52 deals, with mobile studios accounting for the majority of headline acquisitions.
- Public capital offerings remained subdued in Q1 2026, totaling $1.0 billion across 11 deals, concentrated in mid-sized fixed income deals (e.g., Hasbro, Stillfront) and strategic investments.
- Private investment in Q1 2026 totaled $0.8 billion across 101 deals, with early-stage activity falling to its lowest level in recent years at just 43 deals.
+1
Aream & CoApr 2026
Report185 pages
Annual and Sustainability Report 2024
Modern Times Group (MTG) concluded the 2024 fiscal year as a focused European mobile gaming entity, reporting net sales of SEK 6,015 million, representing a 3% currency-adjusted growth. Despite achieving an adjusted EBITDA of SEK 1,666 million, the group recorded a net loss of SEK 210 million. The company maintains a strong liquidity position with SEK 3,543 million in cash and equivalents and no utilized external debt, supported by a disciplined capital allocation strategy that includes active share buybacks and a commitment to long-term, evergreen game franchises.
The company’s strategic trajectory is defined by its "Gaming Village" model, which emphasizes organic growth and accretive M&A to bolster its portfolio of studios, including InnoGames, Hutch, and Ninja Kiwi. A transformative development in this period was the acquisition of Plarium Global Ltd, finalized in early 2025, which significantly scales the group’s mid-core gaming capabilities and adds the flagship title RAID: Shadow Legends to its offerings. This expansion is supported by the "Flow Platform," a centralized infrastructure designed to share business intelligence and user acquisition tools across the group’s subsidiaries.
Sustainability and governance remain central to the company’s operational framework. In 2024, MTG transitioned its reporting to align with the Corporate Sustainability Reporting Directive (CSRD) and European Sustainability Reporting Standards (ESRS). While this methodological shift resulted in a reported 118.2% increase in location-based greenhouse gas emissions due to expanded accounting scopes, the company has committed to a 50% reduction in value chain emissions by 2032. Furthermore, the group maintains a robust governance structure, reporting no incidents of corruption or bribery, and continues to prioritize consumer safety through transparent odds disclosure and data protection measures. The board remains focused on long-term shareholder value, integrating ESG metrics into executive incentive schemes while maintaining a stable, low-leverage financial foundation.
- MTG finalized the acquisition of Plarium Global Ltd in early 2025, significantly scaling its mid-core gaming capabilities and adding the flagship title RAID: Shadow Legends to its portfolio.
- The company reported 2024 net sales of SEK 6,015 million, reflecting 3% currency-adjusted growth, alongside an adjusted EBITDA of SEK 1,666 million and a net loss of SEK 210 million.
- MTG maintains a strong financial position with SEK 3,543 million in cash and equivalents and zero utilized external debt, supporting a strategy of active share buybacks and evergreen franchise investment.
- The group utilizes a 'Gaming Village' model supported by the 'Flow Platform,' a centralized infrastructure designed to share business intelligence and user acquisition tools across studios like InnoGames, Hutch, and Ninja Kiwi.
- Following a transition to CSRD and ESRS reporting standards, MTG reported a 118.2% increase in location-based greenhouse gas emissions and has committed to a 50% reduction in value chain emissions by 2032.
+1
Modern Times Group
Whitepaper10 pages
2026 Global Mobile App Marketing Trends White Paper
The white paper argues that the 2025 mobile app market has shifted from volume‑driven traffic growth to value‑centric, technology‑enabled optimization. It identifies a “scissor gap” where the number of active advertisers fell 16.7 % YoY while creatives per advertiser rose 73.3 %, indicating higher competitive thresholds and a focus on creative quality. Market share remains strongest in business & productivity, utilities, entertainment, and finance, but creative volume is dominated by short‑drama, reading, and AI apps. iOS and Android advertising ratios stabilized at 4:6, with iOS advertisers producing more creatives due to higher monetization expectations.
User acquisition spend reached $78 billion, a 13 % YoY increase driven almost entirely by iOS, with e‑commerce, fintech, and betting leading non‑gaming verticals. Video remains the dominant ad format (≈70 % of social inventory), while static and playable ads serve testing, Android traffic, and engagement signals. AI has moved from a marketing tool to a core capability; leading AI apps scale through volume and quality, while many smaller entrants exit due to weak monetization.
Finance apps maintain steady growth focused on user quality, lifetime value, and compliance, contrasting with AI’s rapid scaling. North America remains the most selective market, demanding high content quality and long‑term trust; success here signals scalability elsewhere. The paper concludes that sustainable growth now hinges on creative capability, system efficiency, AI integration, and long‑term value creation rather than sheer traffic volume.
- The mobile app market has shifted from volume-based growth to a quality-focused model, evidenced by a 16.7% YoY decline in active advertisers alongside a 73.3% surge in creatives per advertiser.
- Global user acquisition spend grew 13% YoY to $78 billion, with the increase driven almost exclusively by iOS advertising.
- Video remains the dominant advertising format, accounting for approximately 70% of social media inventory, while static and playable ads are relegated to testing and engagement signaling.
- The iOS-to-Android advertising ratio has stabilized at 4:6, though iOS advertisers maintain higher creative output due to expectations for superior monetization.
- AI has transitioned from a marketing tool to a core operational capability, where success is defined by the ability to scale volume and quality while maintaining sustainable monetization.
+3
SocialPetaApr 2026

Report43 pages
Insight into Global Micro Drama App Marketing for 2026
SocialPeta’s analytics platform aggregates data from more than 90,000 micro‑drama advertisers and 80 million ad creatives across over 55 countries, positioning itself as a key resource for launching and scaling micro‑drama apps worldwide. The platform projects the global micro‑drama market to reach $6 billion by 2026, emphasizing its capacity to deliver actionable insights into advertising strategies, creative formulas, and regional audience preferences.
In 2025 the ecosystem expanded sharply: active advertisers rose by 63.6 % to over 700, while each advertiser produced a 144.9 % increase in creatives, largely thanks to AI‑powered production tools. Southeast Asia dominated genre preferences for “reversal of fortune” and “rebirth” dramas, whereas North America’s high‑paying users gravitated toward premium romance content. Europe remained the largest source of creative volume, underscoring a sustained upward trend in both advertiser participation and output across the globe.
A case study of “Evil Bride vs. The CEO’s Secret Mom” illustrates high‑impact marketing: 44 K creatives generated an estimated 2.7 B impressions in key markets such as the USA, UK, Canada, Australia, and Germany. AI‑driven tools—DSV restructuring and automated cover/clip generation—reduced production time, enabling rapid localization. Short, cliffhanger‑style ads with intense conflict and strong visual hooks outperformed longer formats, driving downloads and engagement in North America, Southeast Asia, Latin America, and the Middle East.
By late 2024 vertical micro‑dramas had matured into a stable ecosystem, with regional preferences—“reversal of fortune” in Southeast Asia and conflict‑driven stories in Latin America—fueling audience engagement. Production scaled to 55 vertical dramas in 2025 through standardized pipelines and AI‑enhanced marketing, allowing faster creative validation, lower volatility, and continuous data‑driven optimization. The analysis stresses that audience‑first IP development—testing concepts in short form before scaling—and multi‑platform, AI‑supported workflows are essential for reducing creative risk and converting IP into long‑term company capital.
- The global micro-drama market is projected to reach $6 billion by 2026, supported by a 63.6% increase in active advertisers to over 700 in 2025.
- AI-powered production tools drove a 144.9% increase in creative output per advertiser in 2025, enabling rapid localization and standardized production pipelines.
- High-impact marketing campaigns, such as the 44,000 creatives for 'Evil Bride vs. The CEO’s Secret Mom,' demonstrate that short, cliffhanger-style ads with intense conflict are the most effective format for driving global engagement.
- Regional audience preferences are highly segmented, with Southeast Asia favoring 'reversal of fortune' and 'rebirth' themes, while North American users gravitate toward premium romance content.
- Europe currently leads the global market in total creative volume, while Latin America and the Middle East show strong engagement with conflict-driven storytelling.
+3
SocialPetaApr 2026

Report23 pages
Gaming the Future: How to Make an Impact With Younger Generations
Gaming has become the dominant entertainment medium for younger generations, with 80 % of under‑18s actively gaming and Gen Z allocating up to 22 % of free time to play. The study, combining first‑party data from SuperAwesome and Anzu with social listening, qualitative research, quantitative surveys, syndicated data, brand lift studies and parent‑tracking panels, covers the UK, France, Germany, the United States and global markets from 2023‑24. A sample of 30 000 children, teens and young adults (ages 4‑24) plus parent responses informs the analysis.
Key findings show that gaming captures more attention than social media for Gen Z, with 55 % of under‑18s reporting a strong affinity for branded in‑game experiences. Younger gamers are highly receptive to ads, with 75 % of Gen Z players in the UK and US saying in‑game ads improve their experience, compared to 34 % of older adults. In‑game advertising drives higher brand recall (+7 pts) and purchase intent (+9 pts) for audiences under 34, and generates a “halo effect” that boosts brand affinity by up to 86 % among under‑18s. Parents report that children influence household spending, with 86 % saying their child’s opinions matter in purchases and 82 % prioritising items for children.
The report recommends a multi‑platform, contextual approach that respects emerging data‑protection regulations and Age Appropriate Design Codes. It emphasizes early engagement before brand loyalties lock at age 16, contextual targeting over behavioural profiling, and rigorous creative vetting to avoid manipulative design. The analysis underscores gaming’s strategic importance for reaching Gen Alpha and Gen Z, offering measurable lift across awareness, consideration and purchase stages.
- Gaming has become the primary entertainment medium for younger demographics, with 80% of under-18s actively gaming and Gen Z dedicating up to 22% of their free time to play.
- In-game advertising significantly outperforms traditional metrics for younger audiences, driving an 86% boost in brand affinity among under-18s and increasing brand recall by 7 points and purchase intent by 9 points for those under 34.
- Younger gamers are notably more receptive to in-game ads than older adults, with 75% of Gen Z players in the UK and US reporting that ads improve their gaming experience compared to only 34% of older adults.
- Children exert substantial influence on household economics, as 86% of parents report that their child’s opinions impact household purchases and 82% prioritize spending on items for their children.
- Gaming captures more attention than social media among Gen Z, with 55% of under-18s expressing a strong affinity for branded in-game experiences.
+4
AnzuApr 2026

Report69 pages
State of Gaming 2026
The 2026 State of Gaming analysis demonstrates a shifting landscape in which mobile gaming remains the largest driver of downloads—approximately 50 billion in 2025—but its growth rate is slowing. Revenue, however, continues to climb as monetization models mature and lifetime value deepens, especially within hybrid‑casual titles that now generate the most incremental income. In contrast, PC and console platforms experience record revenue growth, with Steam’s premium segment up 32 % and blockbuster releases such as Battlefield 6 capturing significant market share from incumbents. Shooter downloads on these platforms have plateaued, suggesting new titles are primarily cannibalizing existing audiences rather than expanding the category.
Genre‑specific dynamics reveal that strategy games are the only mobile genre to grow in downloads, driven by 4X titles from Eastern developers. Action and shooter games dominate PC/console gains, while hyper‑casual remains the largest download engine but shows a notable lift in time spent, particularly in Tier 2 markets. Casual titles face declining day‑7 retention, indicating a stickiness challenge that could erode long‑term player value.
Live‑ops and acquisition strategies have evolved toward retention‑focused events, multi‑tier season passes, and expedition‑style rewards. These mechanisms now represent the most reliable revenue drivers across competitive genres such as RPG, action, and simulation. Advertising spend remains concentrated on social channels—YouTube, Facebook/Instagram—and high‑attention formats like video, playable, and rewarded ads. Battlefield 6’s pre‑launch spend surpassed Call of Duty titles, leveraging Facebook, Reddit, and desktop display, while its post‑launch strategy pivoted to YouTube with cinematic, celebrity‑hook creatives.
Geographically, the U.S. market shows a skew toward lifestyle and puzzle categories despite lower IAP shares, whereas casino titles exhibit higher spend‑to‑revenue efficiency. Overall, the industry is moving from acquisition toward deeper monetization per user, with indie shooters and simulation titles gaining traction amid intense competition in the shooter segment.
- PC and console platforms are seeing record revenue growth, highlighted by a 32% increase in Steam’s premium segment and the strong market performance of Battlefield 6.
- Mobile gaming growth is slowing despite reaching 50 billion downloads in 2025, with hybrid-casual titles now serving as the primary drivers of incremental revenue.
- Shooter games on PC and console have reached a download plateau, indicating that new releases are cannibalizing existing player bases rather than expanding the total market.
- Retention-focused live-ops, including multi-tier season passes and expedition-style rewards, have become the most reliable revenue drivers for RPG, action, and simulation genres.
- Strategy games are the only mobile genre experiencing download growth, fueled primarily by 4X titles from Eastern developers.
+1
Sensor TowerApr 2026
Report30 pages
Q4 2023 Gaming Industry Report: Global & MENAP Outlook
The Q4 2023 Gaming Industry Report presents a global market that expanded to $212 billion, with the MENAP region contributing $2.8 billion and experiencing a 30% quarter‑over‑quarter rise in both gamers and investment activity. Mobile gaming remains the dominant platform, accounting for 46% of the global player base, while indie PC titles capture a growing share of revenue at roughly 30%. The report also highlights the continued diversification of the industry, noting that game‑to‑movie adaptations generated over $1.4 billion in 2023, underscoring cross‑media opportunities.
Regulatory scrutiny intensified across the sector, with a 15% increase in litigation and high‑profile antitrust cases against major platform holders such as Google and Apple. Significant fines were imposed for deceptive practices, reflecting a tightening legal environment that could reshape market dynamics.
M&A activity rebounded sharply in Q4, with transactions totaling $68.7 billion—a 769% jump largely driven by the Activision‑Blizzard deal—while global venture capital funding fell. In contrast, MENAP venture activity rose 30%, indicating a strategic pivot toward emerging markets including Asia, Africa, and MENAP for future consolidation. This trend presents both challenges and opportunities for indie studios, potentially enabling higher‑quality titles through increased resources.
Shorooq Partners focuses on early‑stage gaming investments within MENAP, targeting pre‑seed to Series A deals with ticket sizes of $1–8 million. The firm prioritizes studios that possess strong intellectual property, robust monetization models, and software solutions that enhance processing efficiency and scalable user connectivity. By engaging through conferences such as the WN Conference Abu Dhabi and LEAP 2024, newsletters, and partnership initiatives, Shorooq aims to nurture the growing MENAP gaming ecosystem.
- The global gaming market reached $212 billion in Q4 2023, with M&A activity surging to $68.7 billion, a 769% increase primarily driven by the Activision-Blizzard acquisition.
- Mobile gaming remains the industry's primary platform, capturing 46% of the global player base, while indie PC titles have grown to represent approximately 30% of total revenue.
- The MENAP region is a key growth area, contributing $2.8 billion to the market and recording a 30% quarter-over-quarter increase in both gamer population and venture capital investment.
- Regulatory pressure is intensifying, marked by a 15% rise in litigation and significant antitrust actions against major platform holders like Google and Apple regarding deceptive practices.
- Cross-media expansion is a proven revenue driver, with game-to-movie adaptations generating over $1.4 billion in 2023.
+1
Shorooq Partners

Report121 pages
African Video Game Report 2026
The report establishes that Africa’s video‑game industry has entered a phase of rapid maturation, driven largely by mobile play in urban centres such as South Africa, Nigeria and Kenya. Mobile accounts for roughly 90 % of the $1.8 billion market in 2024, with a 10 % year‑over‑year rise in players to 349 million. PC and console remain niche but critical for studio visibility, with Steam dominating distribution (≈70 % of PC use) and local platforms like Gara and Jiwe capturing the remainder. Funding for studios is overwhelmingly sourced from international incubators and grants—Pro Helvetia, the French Agence Française de Développement, the British Council’s Ignite Culture and Digital Lab Africa—yet local infrastructure gaps (low internet penetration, limited payment systems, unreliable electricity) continue to constrain broader market development.
Key findings show that the fastest‑growing economies—Eritrea, Niger, Egypt, Ethiopia, Nigeria and South Africa—host studios such as Maliyo Games, Kayfc and Legends of Orisha that are producing mobile‑first IP while experimenting with higher‑production PC/console titles. Female representation and gender inclusivity are addressed through programmes like Pro Helvetia’s “She Got Game”, yet overall skill development remains uneven, with many studios still operating at the indie level and lacking robust business training.
The esports sector mirrors this mobile dominance, with titles like PUBG Mobile and Free Fire generating substantial prize pools and viewership across hubs such as Morocco, Egypt and Kenya. However, talent development is concentrated in a handful of urban centres, leaving Francophone and non‑English speaking regions underrepresented.
The analysis concludes that sustainable growth hinges on three pillars: deeper, studio‑level talent development; reliable data infrastructure for market intelligence; and evolved payment systems that reduce friction. Strengthening African‑European partnerships, expanding local incubation pathways, and ensuring annual data updates are essential to unlock the continent’s commercial potential while preserving African leadership in game creation.
- Africa’s video game market reached $1.8 billion in 2024, with mobile gaming accounting for 90% of the market and a player base that grew 10% year-over-year to 349 million.
- Market growth is concentrated in urban hubs across South Africa, Nigeria, Kenya, Egypt, Ethiopia, Niger, and Eritrea, where studios like Maliyo Games and Kayfc are prioritizing mobile-first IP.
- Studio funding is heavily reliant on international grants and incubators, including Pro Helvetia, the Agence Française de Développement, and the British Council’s Ignite Culture.
- PC and console gaming remain niche, with Steam capturing approximately 70% of PC distribution, while local platforms like Gara and Jiwe serve the remaining market share.
- Esports viewership and prize pools are dominated by mobile titles such as PUBG Mobile and Free Fire, though talent development remains geographically limited to a few major urban centers.
SpielFabriqueApr 2026