Market Analysis
Report22 pages
The 2026 State of Web Gaming Report: A Study of Developer and Gamer Perceptions
- Web gaming is experiencing a resurgence as a strategic alternative to the plateauing growth observed in the PC, console, and mobile gaming sectors.
- The primary driver behind the stagnation of traditional gaming platforms is an ongoing, significant challenge regarding game discoverability.
- Web gaming has successfully reinvented its value proposition to address the limitations currently hindering growth in established gaming markets.
PokiJun 2026

Presentation16 pages
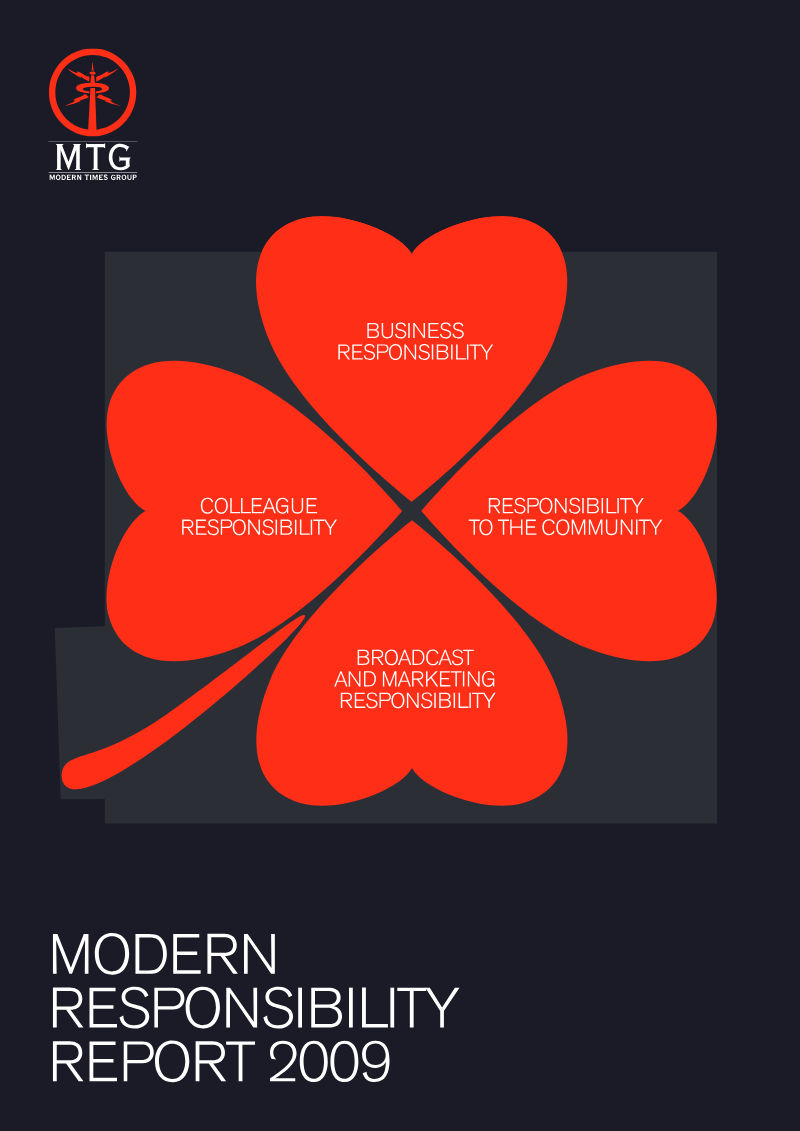
AI in MTG: Moving Beyond Theory
- Adopting an 'AI-first' development approach enabled the launch of five new mobile games in 2026, facilitating rapid iteration and simultaneous production of specialized content.
- AI integration has achieved significant operational efficiencies, including a 99% reduction in marketing asset costs and an 80% time saving on influencer spotlight production.
- Data analysis turnaround times have been reduced by 75% by utilizing AI agents to query large-scale datasets, allowing analysts to focus on high-level strategy.
Modern Times Group