Mobile reports and market data
Documents
An Empirical Taxonomy of Monetized Random Reward Mechanisms in Games
The document establishes an empirically derived taxonomy of monetized random reward mechanisms (RRMs) in games, aiming to standardize academic and public discourse around these often-criticized mechanics.
- Across 108 free-to-play and paid-to-play games from the US, Germany, and Japan, the study identified 59 monetized random reward mechanisms (RRMs) in 47 titles, grouped into three implementation strategies and 40 implementation types.
- About 63% of RRMs are triggered by real money, usually via purchased in-game currency, while 31% are triggered by watching advertisements and 7% by both methods.
- Ad-triggered RRMs are consistently closed (drop rates disclosed) and typically offer skins, in-game currency, or consumables, often with gambling-style presentation, whereas currency-triggered RRMs are open, more varied in rewards, and often serve as central progression systems, such as the gacha structure in Fire Emblem Heroes.
Brain-Training Games: Play as a Tool for Cognitive Enhancement
This extended abstract outlines an ongoing study investigating user perceptions and experiences with brain-training games, focusing on how play elements contribute to their adoption as cognitive interventions.
- Consumer spending on brain-training games such as Lumosity, Elevate, and Peak rose more than 400% between 2012 and 2019, even though scientists remain only moderately optimistic about their efficacy.
- Evidence that gains from brain-training games transfer to real-world cognitive performance is lacking, and the gap between established and perceived benefits is attributed partly to aggressive marketing and a digital placebo effect in which expectations sustain engagement.
- The paper frames brain-training games as an instance of "ludification," in which cognitive intervention practices are reframed as play within the app economy.

A Data-Driven Model for Mobile Game New Version Update Evaluation
The "Fish Tank Model" (FTM) is introduced as a data-driven framework for evaluating mobile game version updates, aiming to bridge a gap in game analytics by focusing on publishing.
- The paper proposes the Fish Tank Model (FTM), a framework combining New Version Rating (NVR) and New Version Change Rate (NVCR) to evaluate whether players favor a mobile game version update by blending player reviews with changes in installs, paying users, revenue, and daily active users (DAU).
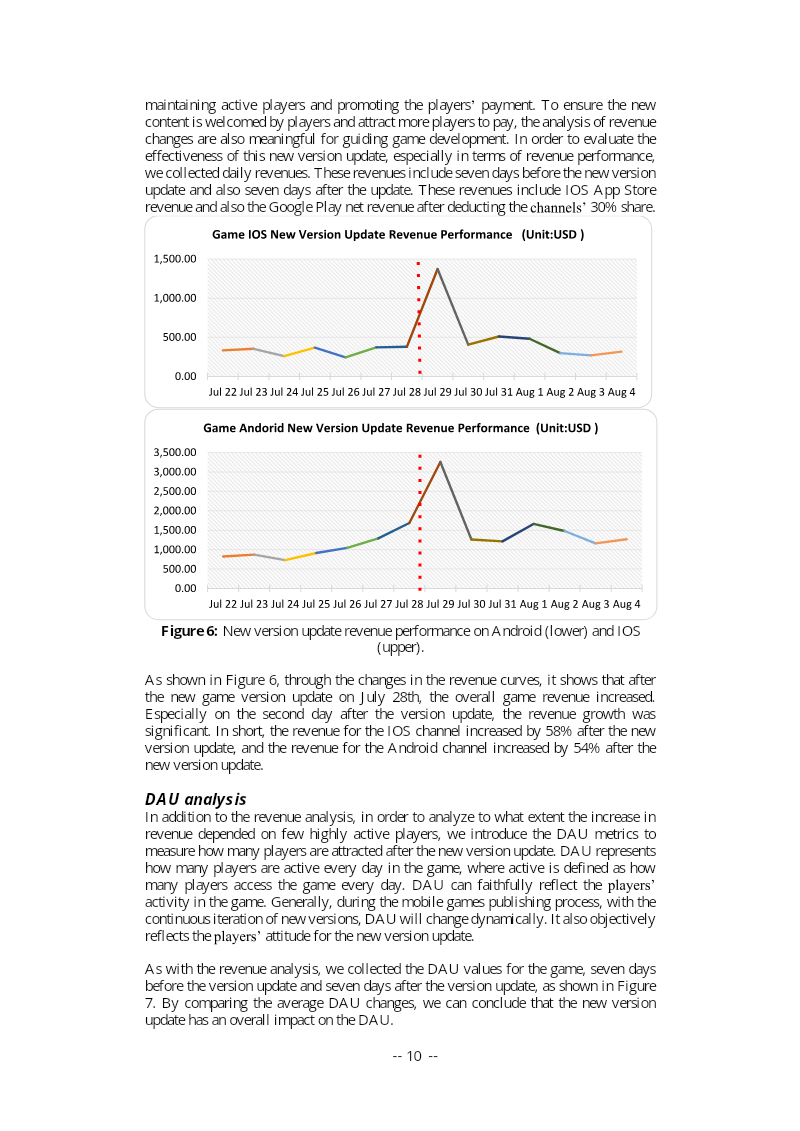
- In a case study of casual mobile game studio's version 2.7 update, net revenue rose roughly 58% on iOS and 54% on Android, while paying users grew 25% on iOS and 63% on Android.
- Reception was mixed across storefronts: the iOS App Store rating rose from 4.4 to 4.7 while Google Play held steady at 4.7, so the authors relied on in-game data to supplement ratings.
MeWare for Sale: Developer's Approaches to Serious Mobile Music Games
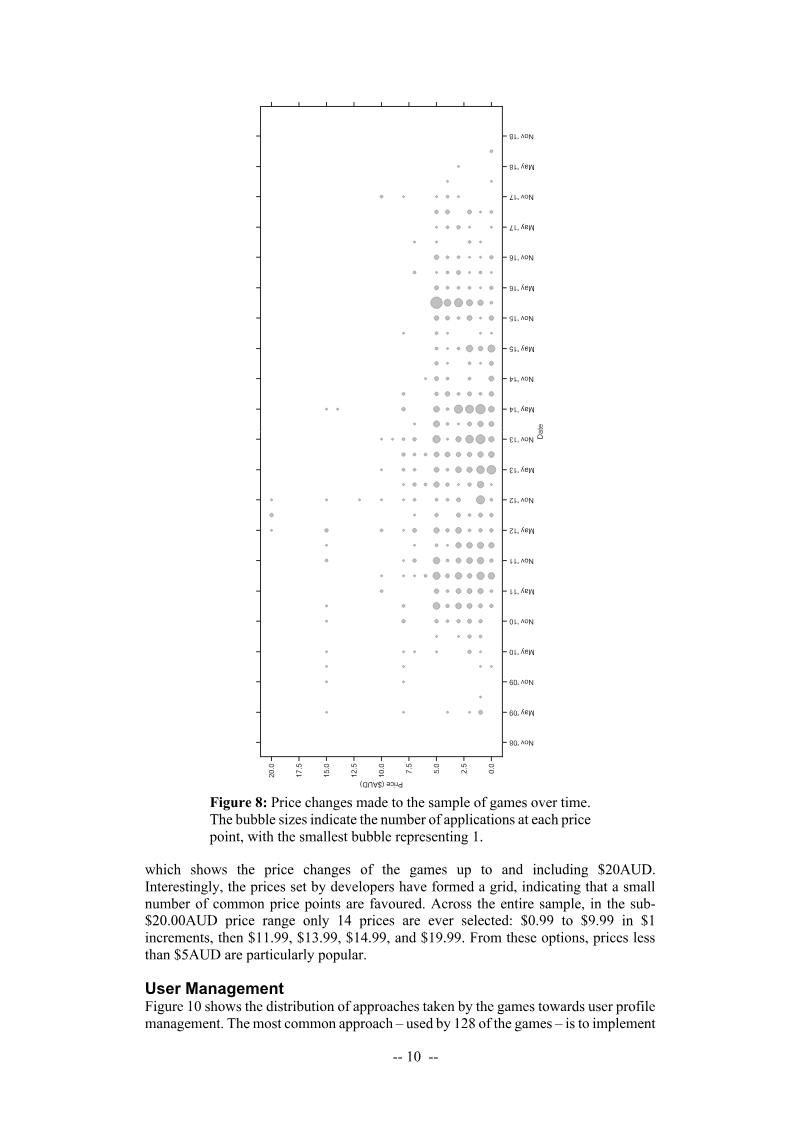
This study examines 175 serious mobile music games available on the iOS platform, analyzing developer approaches to design, revenue models, and user/data management.
- The study analysed 175 serious mobile music games rated 4+ on the iOS App Store, selected from 313 candidates and drawn from 74 unique developers.
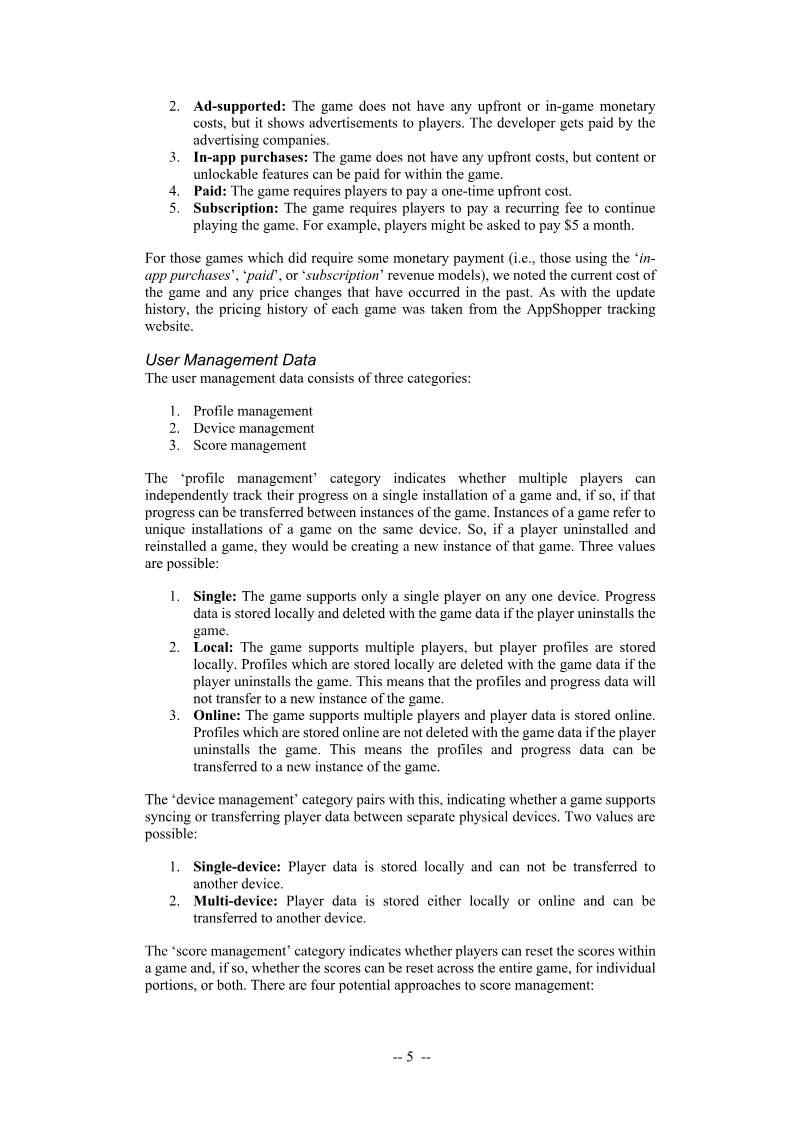
- Market supply is concentrated: publisher AtPlayMusic alone accounts for 23 titles, indicating a few sources dominate the catalogue.
- Over half of the games (about 54 percent) are inactive, with no updates in six months, and music games generally receive fewer updates than comparable non-music games.
How Is the Gacha System Reported on in Japan?
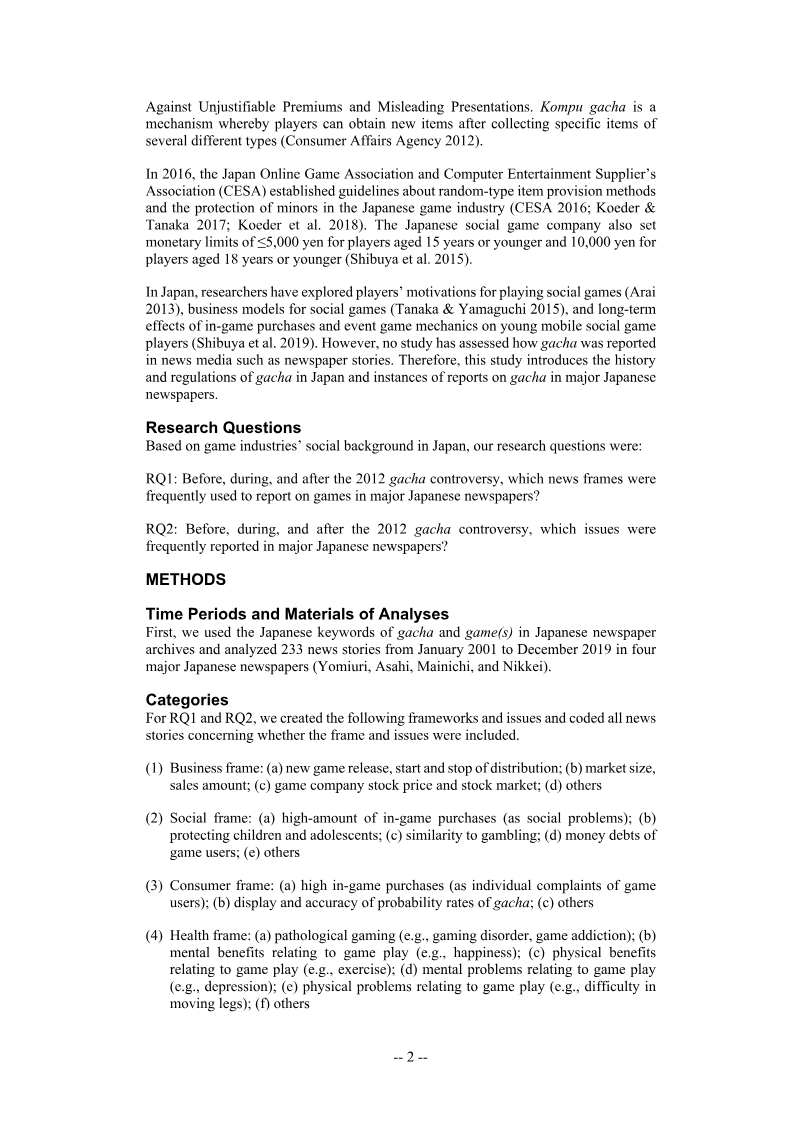
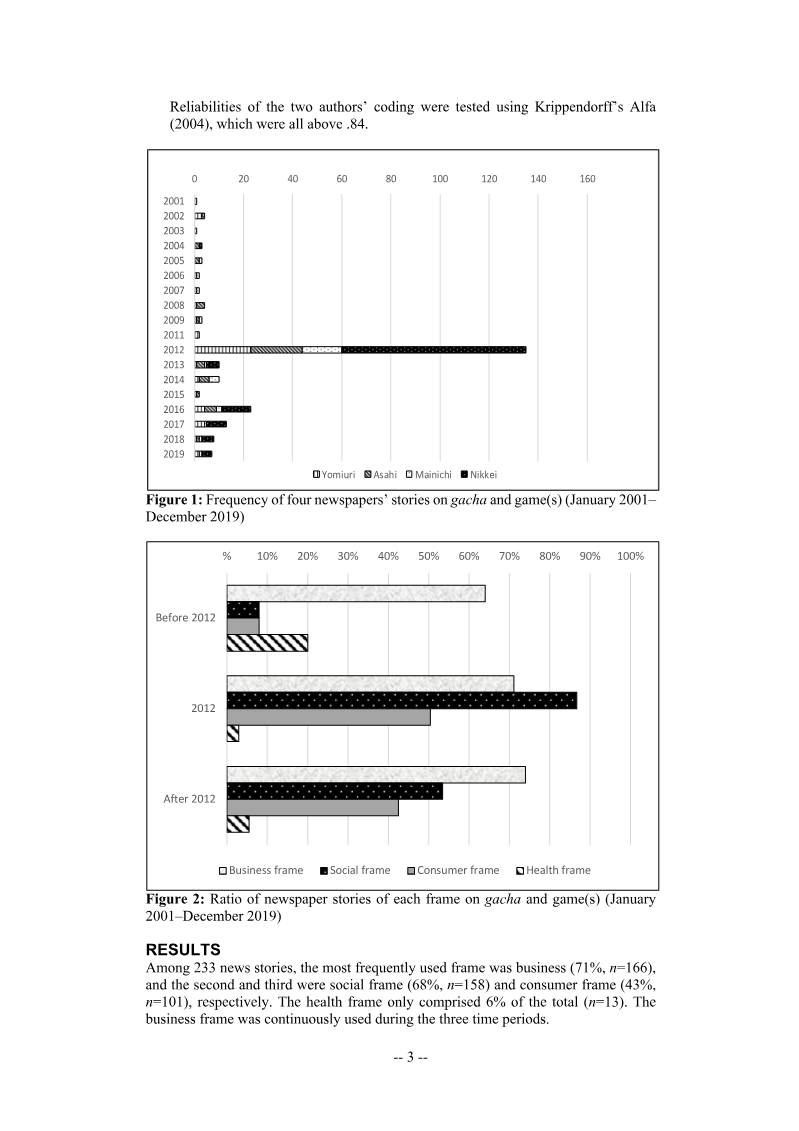
This study analyzes how the gacha system, a random-type item provider in mobile online games, was reported in Japan by examining 233 newspaper articles from January 2001 to December 2019 across four major Japanese newspapers: Yomiuri, Asahi, Mainichi, and Nikkei.
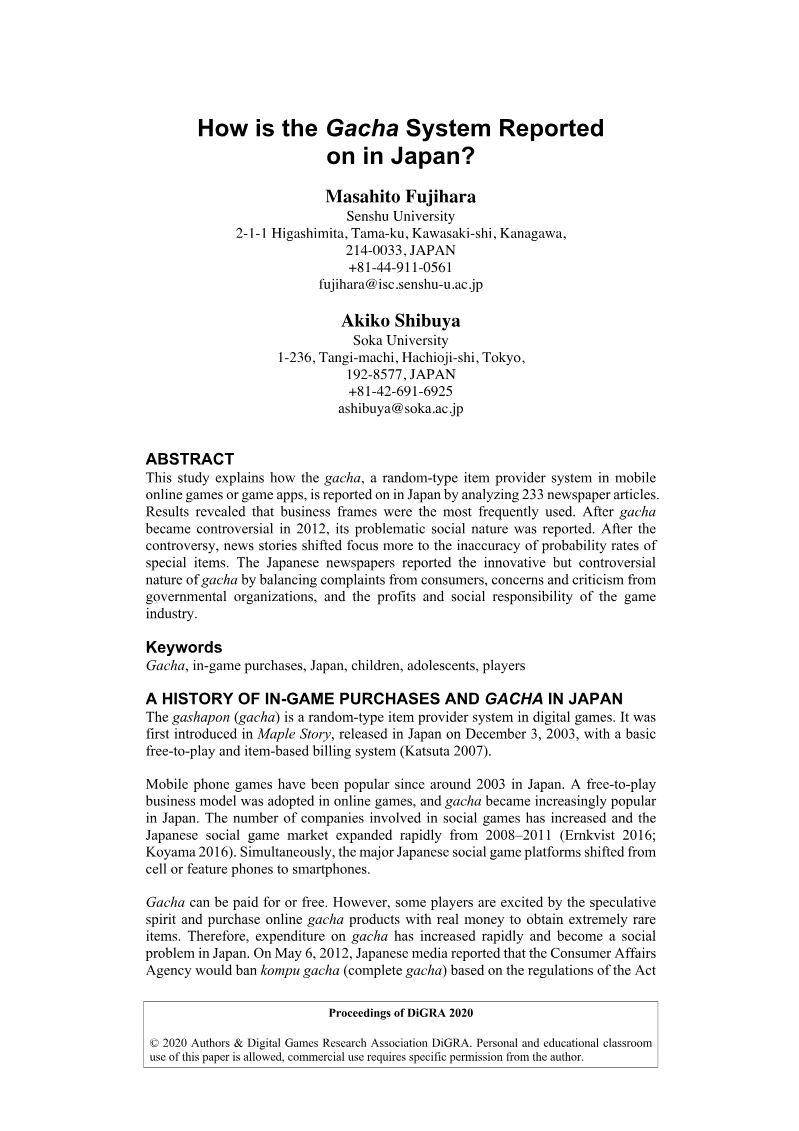
- Japanese newspapers covered gacha through business (71% of stories), social (68%), consumer (43%), and health (6%) frames across 233 stories from 2001 to 2019 in Yomiuri, Asahi, Mainichi, and Nikkei.
- The 2012 gacha controversy drove a surge in coverage: the social frame reached 87% of stories, with 76% linking gacha to gambling and 50% framing high in-game spending as a social problem.
- Before 2012, coverage of gacha in digital games was sparse, with only 25 stories, and reporting centred on physical capsule toys.
Toys Traveling Through Geocaching: Mobile, Social and Hybrid Values of Play
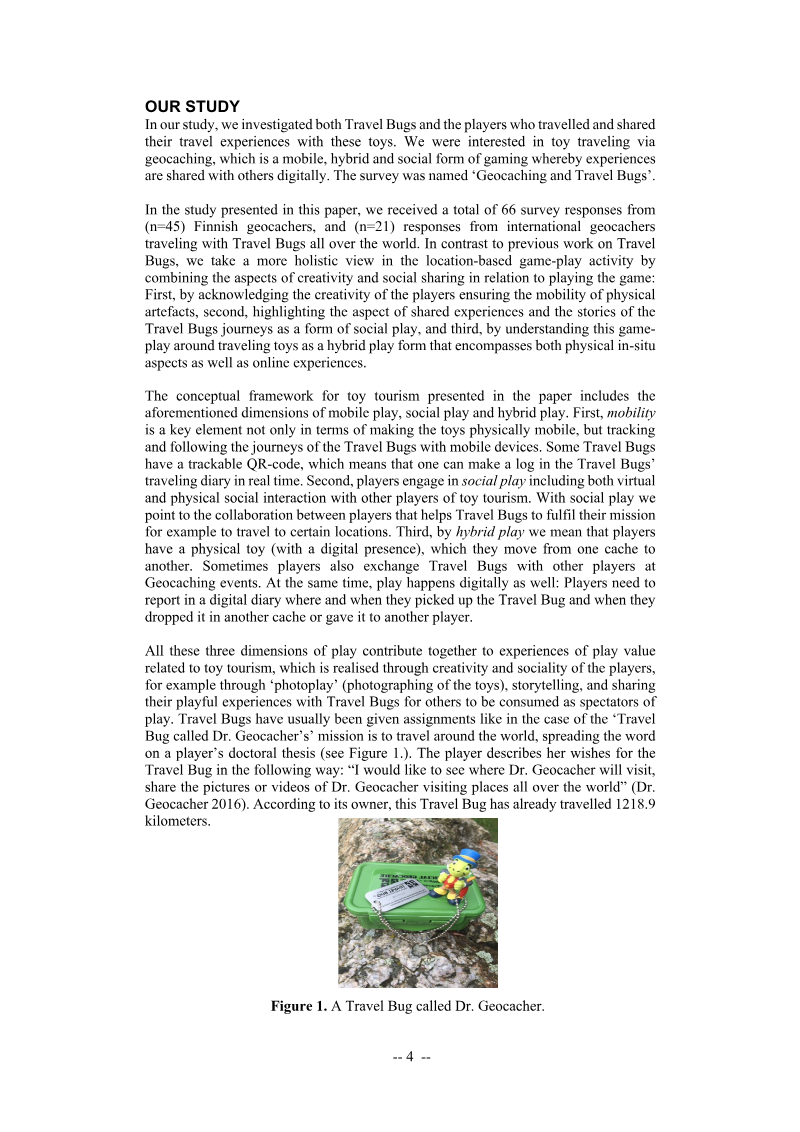
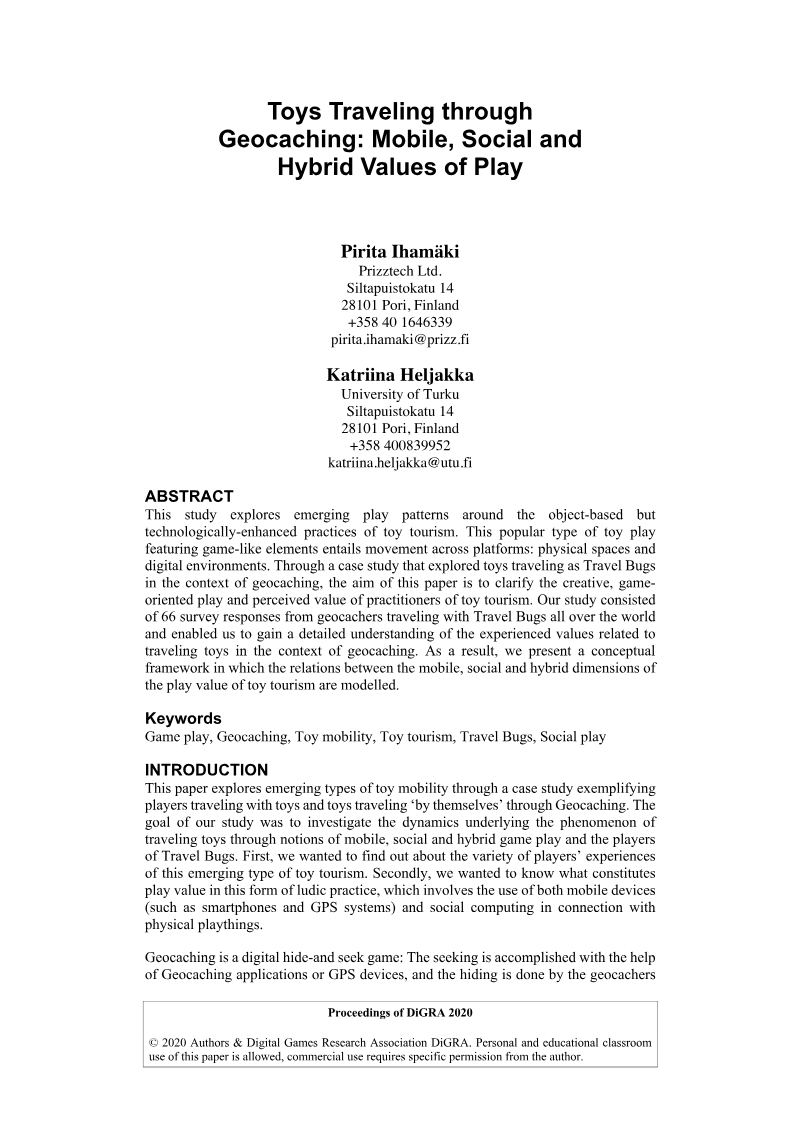
The study, "Toys Traveling Through Geocaching: Mobile, Social and Hybrid Values of Play," examines "toy tourism" within the geocaching community, specifically focusing on the "Travel Bug" phenomenon.
- The study frames Travel Bugs in geocaching as 'toy tourism', arguing that their play value comes from the combination of mobility, social interaction, and blended digital-physical play.
- Mobility is the defining goal of Travel Bug play, with cited figures suggesting roughly 200,000 Travel Bugs have visited more than 200 countries across over one billion kilometres.
- Players sustain engagement through creative photoplay, storytelling, and cross-border collaboration, supported by shared online diaries, dedicated websites, social media documentation, and in-person events.

2020 Global Mobile Market Report
The 2020 Global Mobile Market Report analyzes the state and future trajectory of the mobile gaming industry, emphasizing its accelerated growth due to the COVID-19 pandemic and inherent accessibility.
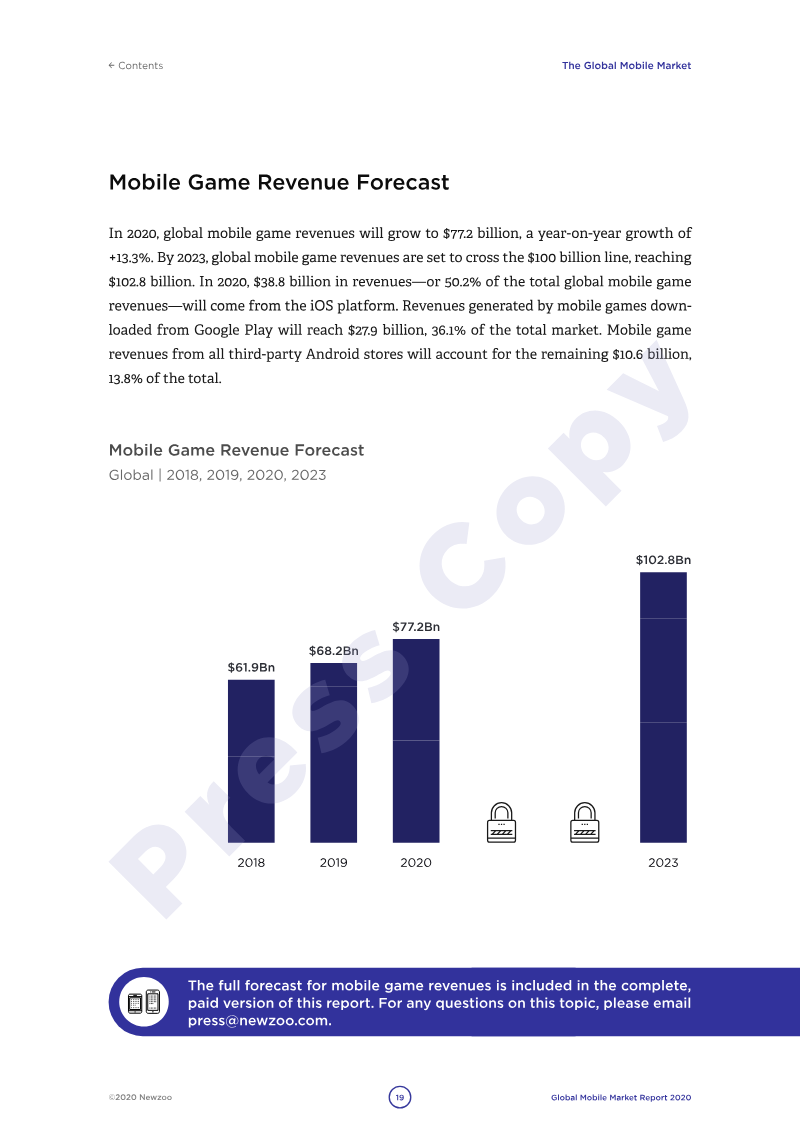
- Global mobile gaming revenue reached $77.2 billion in 2020, cementing mobile platforms as a primary form of global entertainment.
- The global smartphone user base expanded to 3.5 billion, with China leading the market at 874.4 million active users, followed by India and the United States.
- China is projected to maintain its position as the world's largest mobile gaming market through 2023.



2020 Year in Review: Digital Games and Interactive Media
The "2020 Year in Review: Digital Games and Interactive Media" report by SuperData, a Nielsen company, provides a comprehensive analysis of the global digital games and interactive media market for 2020, with projections for 2021.
- The global digital games and interactive media industry grew 12% year-over-year in 2020, reaching $126.6 billion in total revenue.
- Free-to-play titles dominated the market, accounting for 78% of total digital revenue, primarily driven by mobile gaming in Asian markets.
- Premium game sales experienced the fastest growth at 28%, bolstered by high-profile releases such as Animal Crossing: New Horizons and Call of Duty: Modern Warfare.


2020 Mobile Gaming Apps Report
Mobile gaming expanded sharply in 2020, with roughly 2.6 billion players, revenue above $100 billion (48% of all gaming revenue), a 24% rise in daily in-app payments during stay-at-home orders, and a 57% year-over-year jump in late-March ad impressions.
- The global mobile gaming market is projected to exceed $100 billion in 2020, supported by 2.6 billion players and a 24% increase in daily in-app payments.
- Midcore and strategy games are the most efficient segments, achieving a 39.5% 30-day return on ad spend with low acquisition costs, particularly on Android.
- While the average cost per install has hit a record low of $1.47, the industry faces a 24% rise in install-to-purchase costs and a decline in conversion rates to 3.3%.


Mobile Ad Creative Index 2020
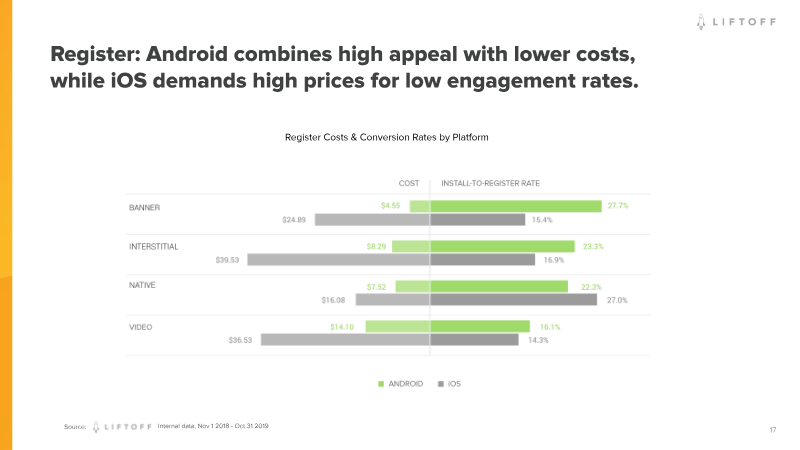
Liftoff's Mobile Ad Creative Index 2020 evaluates how banner, interstitial, native, and video ads perform and cost across the user funnel, drawing on 1,395 apps, 353 billion impressions, and 4.86 billion clicks from November 2018 to October 2019.
- Native ads achieve conversion rates as high as 52.8%, making them the most effective format for driving long-term user retention and high-value in-app purchases.
- Acquiring an in-app purchase via native ads on iOS costs $218.09, which is nearly triple the $73.62 cost required on Android.
- Disciplined A/B testing and dynamic creative strategies, as utilized by brands like Credit Karma and Groupon, can increase click-to-install rates by more than 120%.


Store Intelligence Data Digest: Q2 2020
Mobile app markets in Q2 2020 were reshaped by COVID-19, producing record activity worldwide.
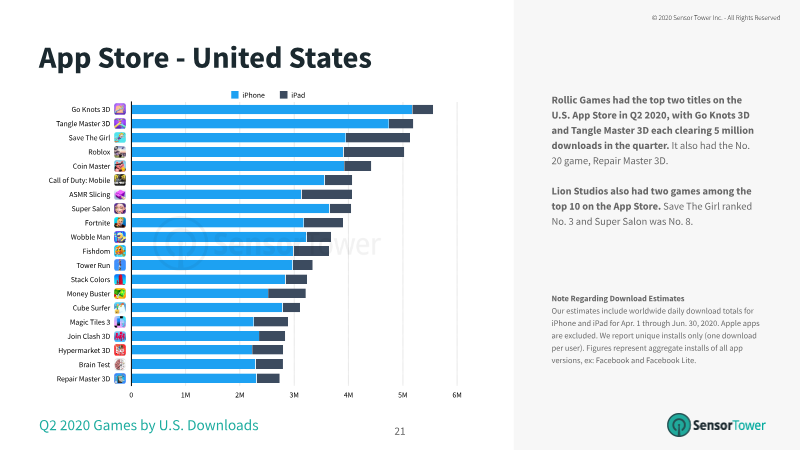
- Worldwide mobile app downloads reached a record 37.8 billion in Q2 2020, a 31.7 percent year-over-year increase driven by pandemic-related shifts in work, education, and entertainment.
- Google Play game downloads surged by over 50 percent to 12.4 billion, with hypercasual titles leading in volume and Sandbox and Battle Royale genres flourishing as social hubs.
- Business category app installations peaked at 176 percent above pre-pandemic levels, with Zoom becoming the third app in history to surpass 300 million installs in a single quarter.

Store Intelligence Data Digest: Q1 2020
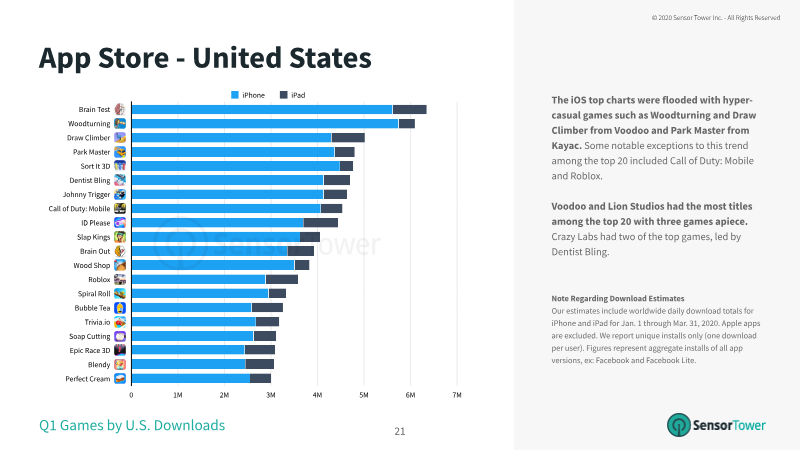
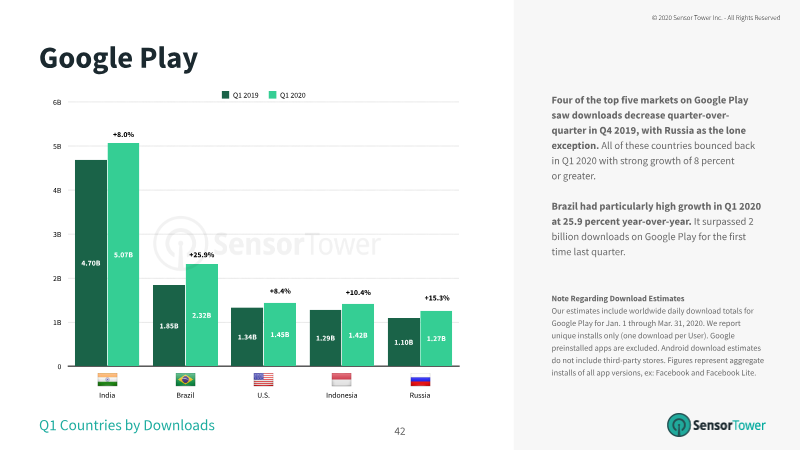
Sensor Tower's Q1 2020 data shows the strongest quarter on record for mobile app and game downloads, with the COVID-19 pandemic reshaping usage patterns worldwide.
- Worldwide mobile app downloads reached a record 33.6 billion in Q1 2020, a 20.3% year-over-year increase driven by pandemic-related digital activity.
- Mobile gaming installs exceeded 13 billion for the first time, with a notable shift toward social and sandbox titles like Roblox and Minecraft.
- Non-gaming app categories saw radical structural shifts, as Business and Education downloads more than doubled while Travel and Navigation installs fell by over 50%.