Skip to main content
Game Industry
Library
Library
Search
Ask AI
News
Connect your AI
Browse
The Catch Up
Topics
Collections
Writers
Help
Subscribe
Game Industry
Library
Library
Search
Ask AI
Saved
Library
1,733 game-industry reports — read the key insights or open the source.
All Types
Reports
Articles
Presentations
Whitepapers
Financial
Legal
Other
Search
Market Analysis
Global
Mobile
Game Development
Marketing
Monetization
Investment
PC
User Acquisition
Game Publishing
Europe
Player Behavior
Console
Advertising
Germany
Employment
Steam
Game Design
Filters
Recently added
Newest first
Oldest first
Title A–Z
Title Z–A
Report
4 pages
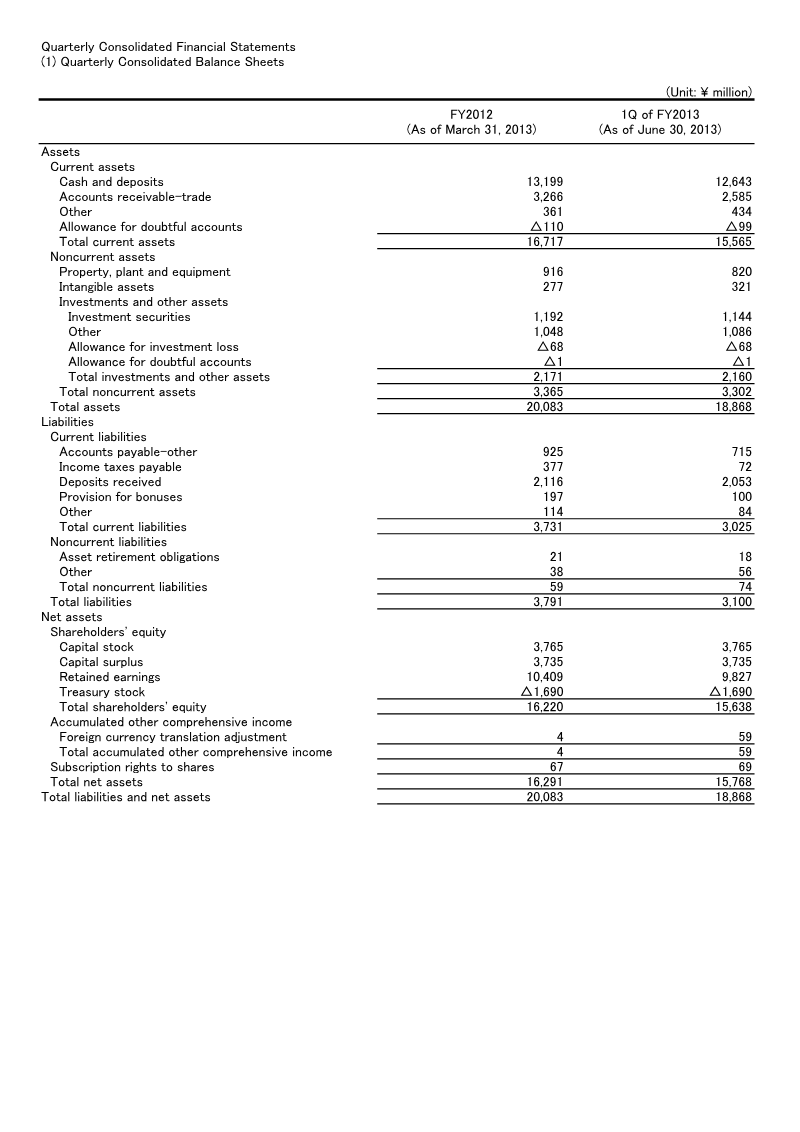
Quarterly Consolidated Balance Sheets: 1Q of FY2013
The company shifted from an operating profit of ¥889 million in 1Q 2012 to an operating loss of ¥84 million in 1Q 2013.
Net sales dropped significantly from ¥3,539 million to ¥2,144 million, while gross profit fell from ¥2,554 million to ¥1,448 million year-over-year.
Net income reversed from a profit of ¥562 million in 1Q 2012 to a net loss of ¥253 million in 1Q 2013, exacerbated by a ¥34 million impairment loss.
Market Analysis
Investment
Japan
mixi
Report
4 pages
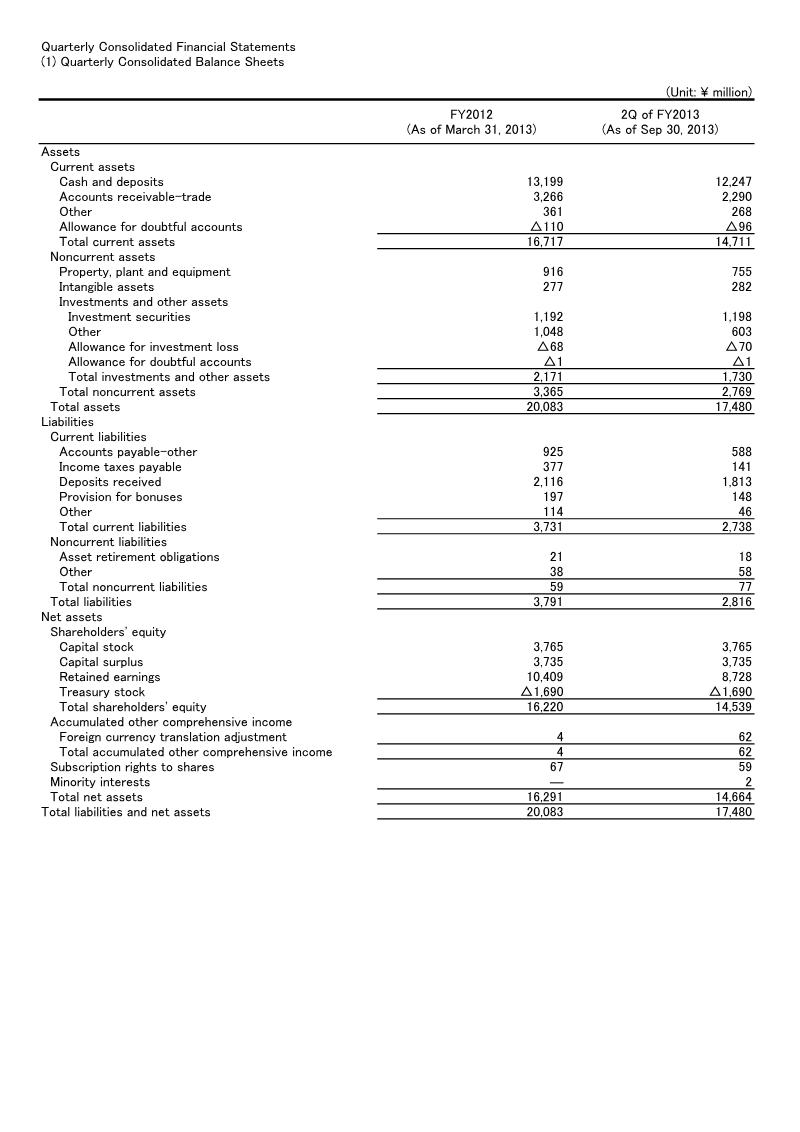
Quarterly Consolidated Balance Sheets: 2Q FY2013
Net sales plummeted 41% year-over-year, falling from ¥6,817 million in 2Q FY2012 to ¥3,979 million in 2Q FY2013.
Operating income shifted from a ¥1,612 million profit in 2Q FY2012 to a ¥398 million loss in 2Q FY2013, driven by high selling, general, and administrative expenses relative to sales.
The company reported a net loss attributable to owners of the parent of ¥1,293 million for 2Q FY2013, a sharp reversal from the ¥1,184 million profit recorded in the same period of the previous year.
Market Analysis
Investment
Japan
mixi
Report
4 pages
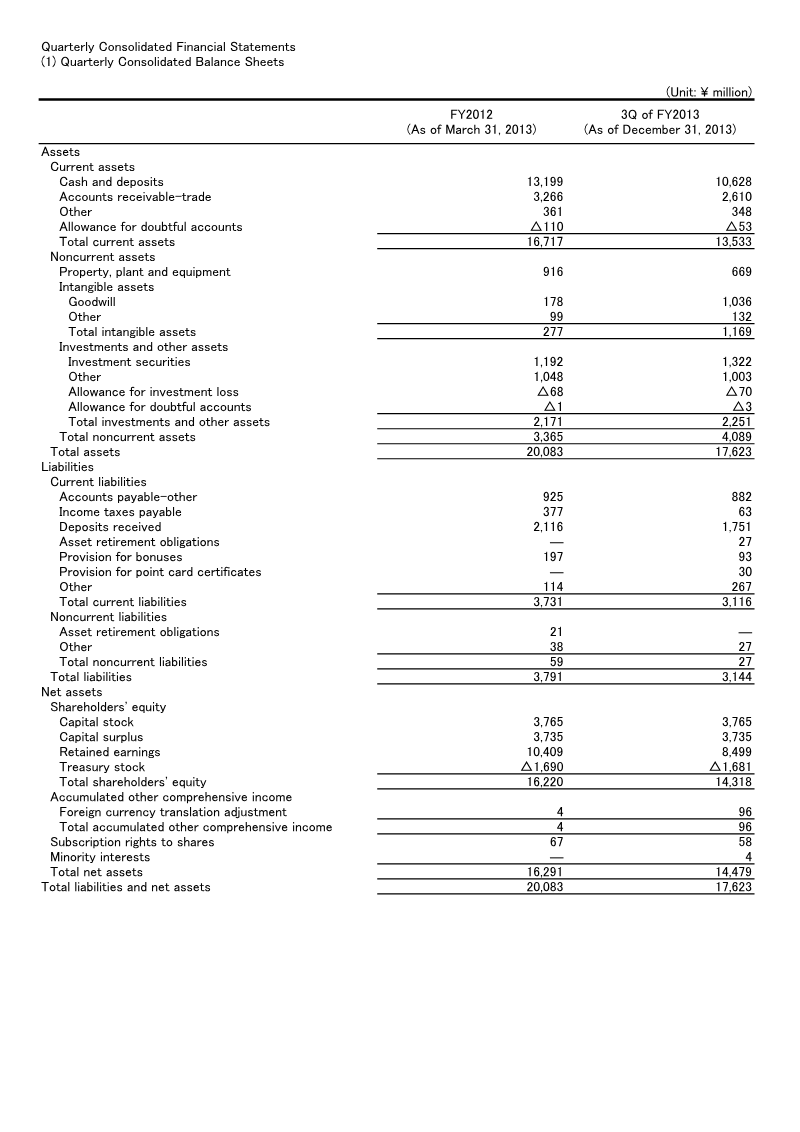
Quarterly Consolidated Balance Sheets: 3Q of FY2013
Net sales plummeted 36% year-over-year, falling from ¥9,922 million in 3Q FY2012 to ¥6,357 million in 3Q FY2013.
Operating income swung from a ¥2,342 million profit to a ¥509 million loss, while net income dropped from a ¥1,621 million profit to a ¥1,573 million loss.
The company’s total assets contracted from ¥20,083 million to ¥17,623 million, accompanied by a decline in shareholders’ equity from ¥16,220 million to ¥14,318 million.
Investment
Japan
Market Analysis
mixi
Report
2 pages
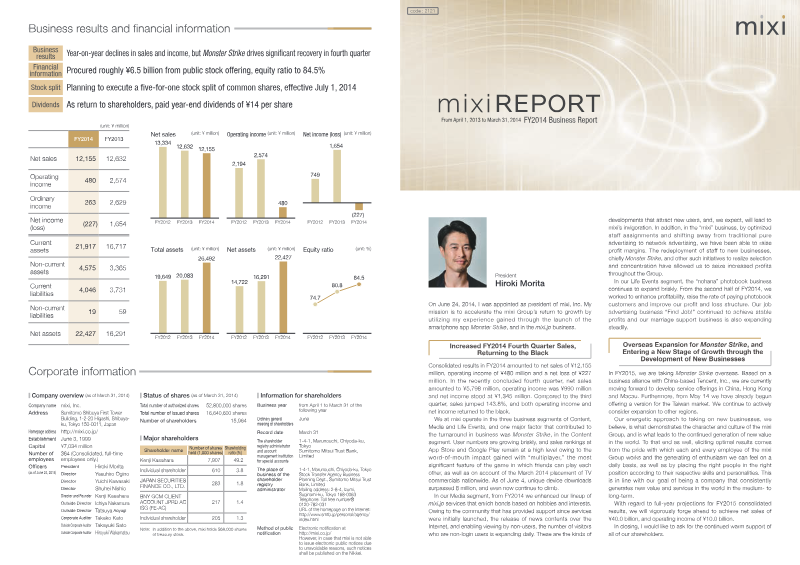
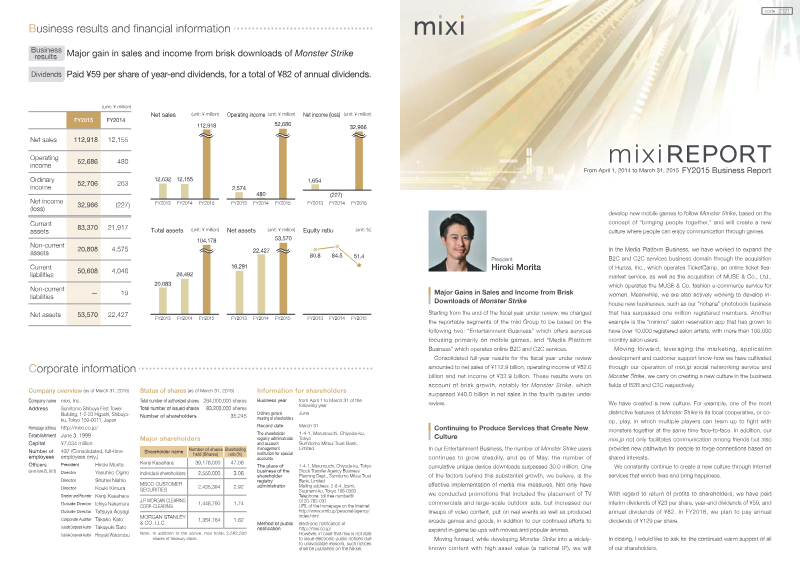
Mixi Report: FY2013 Business Results
Monster Strike drove a major recovery in Q4 FY2014, generating ¥5,798 million in sales—a 143.8% increase—and contributing ¥990 million in operating income.
Mixi experienced an overall net loss of ¥227 million in FY2014, with net sales declining 3% to ¥12,155 million and operating income dropping to ¥480 million due to the decline of the legacy social networking segment.
The company is aggressively expanding Monster Strike internationally through a partnership with Tencent to localize the game for markets in China, Hong Kong, Macau, and Taiwan.
Market Analysis
Monetization
Investment
+2
mixi
Report
2 pages
FY2015 Annual Business Report: MIXI
Monster Strike served as the primary revenue driver, generating ¥112.9 billion in net sales and ¥52.7 billion in operating income, representing a growth of over 30% compared to FY2014.
The company returned to profitability with a net profit of ¥32.9 billion, leading to an increased dividend payout of ¥59 per share.
Monster Strike achieved over 30 million cumulative unique device downloads and expanded its international footprint into China, South Korea, North America, and Hong Kong/Macau.
Market Analysis
Monetization
Mobile
+1
mixi
Report
2 pages
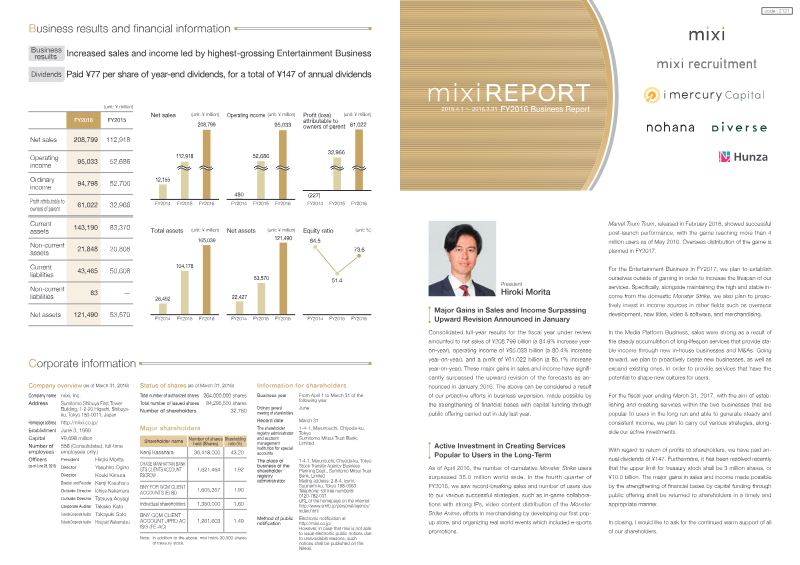
FY2016 Annual Report (Part 1: Business Report)
mixi, Inc. experienced significant FY2016 growth, with net sales rising 84.9% to ¥208.8 billion and operating income increasing 80.4% to ¥95.0 billion.
The Entertainment Business segment, anchored by the continued success of Monster Strike and its 35 million cumulative worldwide users, served as the primary driver of the company's financial performance.
The Media Platform Business contributed ¥112.9 billion in sales and ¥52.7 billion in operating income, maintaining a stable base for long-term user engagement.
Market Analysis
Japan
Mobile
mixi
Report
104 pages
2024 Integrated Report: Value Creation Story
The 2024 Integrated Report outlines a corporate mission focused on entertaining and enriching lives to make the world a better place.
The report identifies a specific event held on April 8, 2023, which recorded an attendance figure of 4,000 participants.
The document references the Kawasaki Brave Thunders, a professional basketball team, as part of its value creation narrative.
Mobile
Live Ops
Sports Games
+1
DeNA Co.
Report
95 pages
2023 Integrated Report: Value Creation Story
The organization has defined its core strategic vision as becoming the world's premier provider of internet and AI technology.
The company's stated mission is to entertain and enrich lives while serving to improve the world.
The business model relies on leveraging individual employee strengths to drive the success of its unique business units.
AI
Japan
Mobile
+1
DeNA Co.
Report
104 pages
2025 Integrated Report: Value Creation Story
The organization aims to establish itself as a premier global provider of internet and technology services.
The company's core mission is to entertain and enrich lives while contributing to broader societal improvements.
Business success is driven by the strategic utilization of individual employee strengths.
Market Analysis
Mobile
Japan
+1
DeNA Co.
Report
1 pages
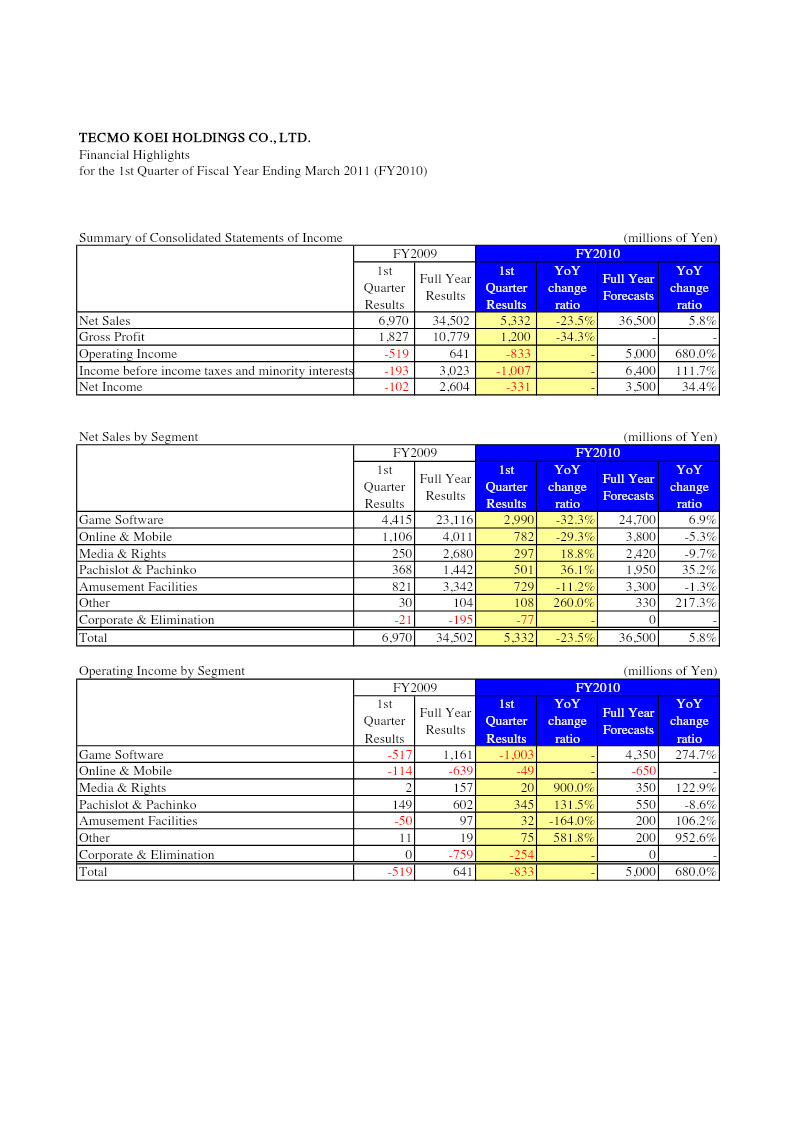
Financial Highlights: 1st Quarter of Fiscal Year Ending March 2011
Tecmo Koei Holdings achieved a significant financial turnaround in Q1 FY2011, shifting from a ¥102 million net loss in the prior year to a ¥2,604 million profit.
Operating income improved by ¥1,160 million year-over-year, moving from a ¥519 million loss to a ¥641 million profit, driven primarily by the game software and online & mobile segments.
Total net sales for the quarter declined 23.5% year-over-year to ¥34,502 million, largely due to a 32.3% drop in game software sales and a 29.3% decrease in online & mobile revenue.
Market Analysis
Investment
Japan
Koei Tecmo
Report
1 pages
Financial Highlights: 1st Half of Fiscal Year Ending March 2011
Tecmo Koei Holdings achieved a significant turnaround in the first half of fiscal year 2010, swinging from a ¥641 million operating loss in the previous year to a ¥641 million operating profit.
Net income reached ¥2.6 billion for the first half of the fiscal year, a substantial recovery from the ¥415 million loss recorded during the same period in 2009.
Despite a 27.5% year-on-year decline in first-half net sales to ¥34.5 billion, the company projects a full-year revenue of ¥36.5 billion, representing a 5.8% increase over the previous year.
Market Analysis
Investment
Japan
Koei Tecmo
Report
1 pages
Financial Highlights: 3rd Quarter of Fiscal Year Ending March 2011
The company achieved a significant financial turnaround in Q3 FY2010, swinging from an operating loss of ¥1,842 million in the prior year to an operating profit of ¥641 million.
Net sales for the quarter reached ¥34,502 million, representing an 11.1% increase over the same period in FY2009, though this figure fell slightly short of the ¥36,500 million forecast.
Net income rebounded to ¥2,604 million, marking a 34.4% gain compared to the previous year's third quarter.
Market Analysis
Investment
Japan
+1
Koei Tecmo
Report
1 pages
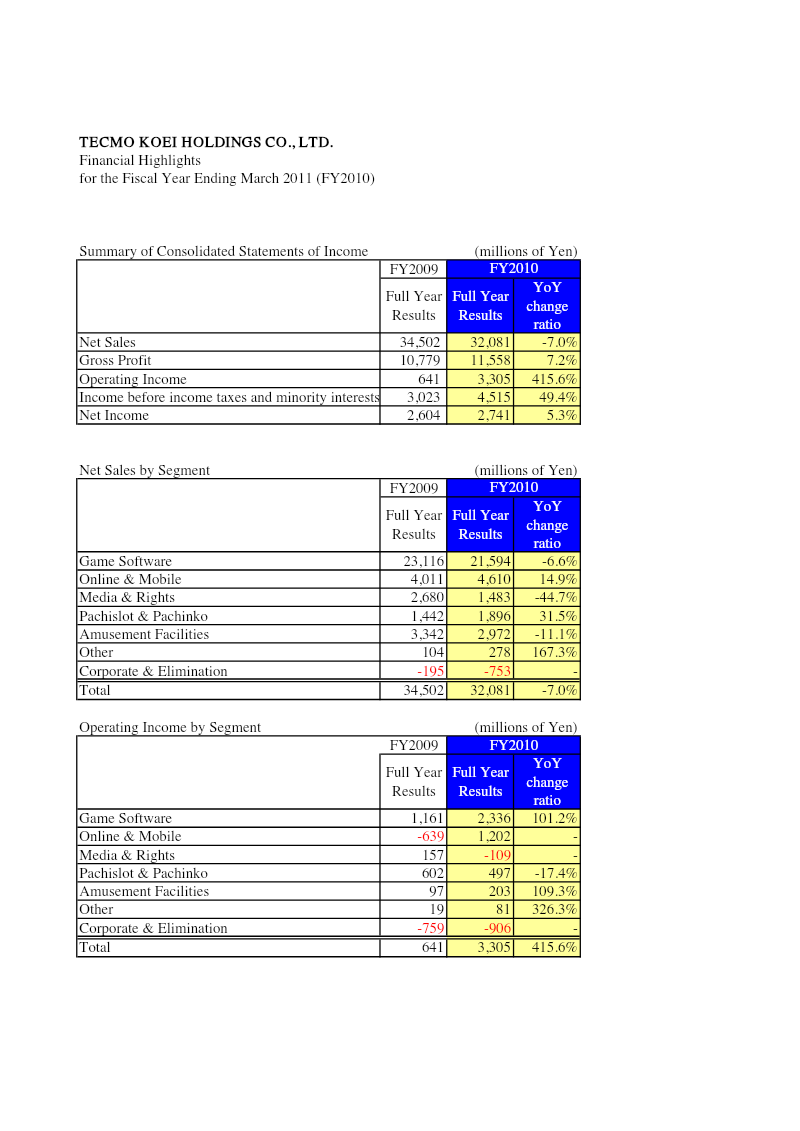
Financial Highlights: Fiscal Year Ending March 2011
Tecmo Koei Holdings achieved a 415.6% surge in operating income to ¥3,305 million for the fiscal year ending March 2011, despite a 7% decline in net sales to ¥32,081 million.
Profitability improved significantly through cost efficiencies and high-margin performance, resulting in a 49.4% increase in income before taxes and minority interests to ¥4,515 million.
The core game software segment saw a 6.6% decline in sales but experienced a 101.2% jump in operating income, indicating a shift toward more profitable operations.
Market Analysis
Investment
Japan
+1
Koei Tecmo
Report
1 pages
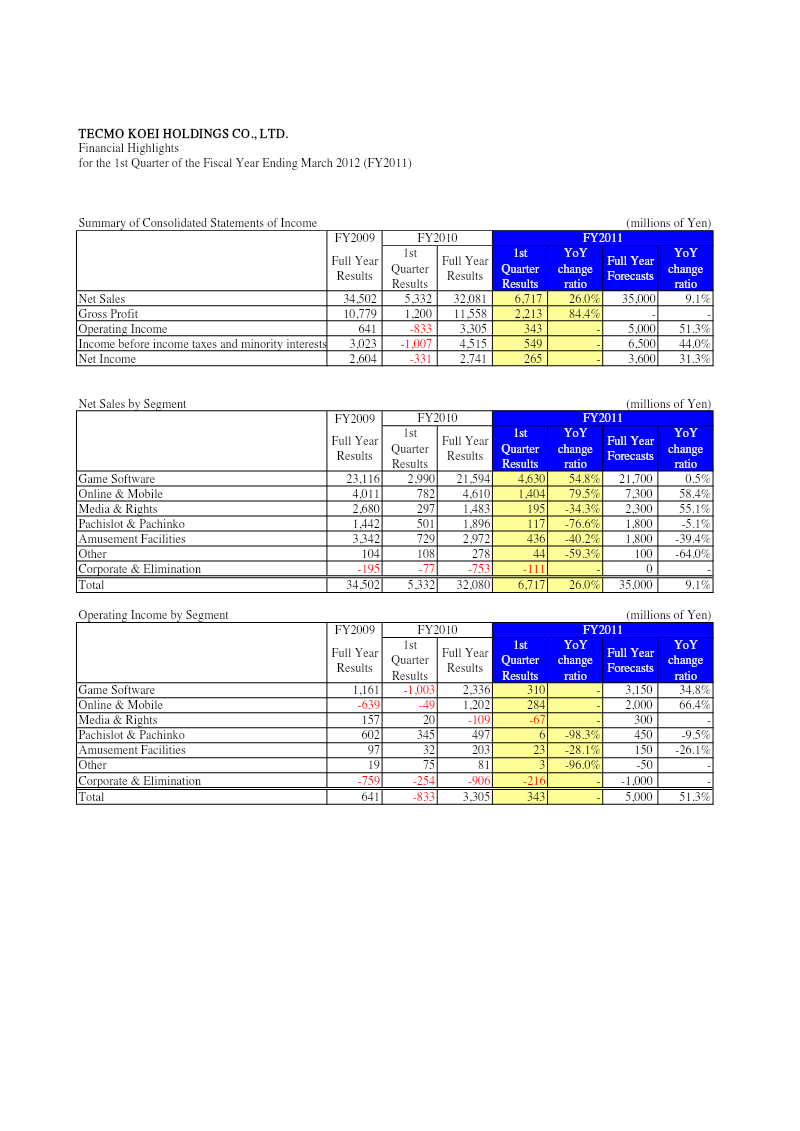
Financial Highlights: 1st Quarter of the Fiscal Year Ending March 2012
Tecmo Koei Holdings reported a 26% year-over-year increase in net sales to ¥34.5 billion and a 31.3% rise in net income to ¥2.6 billion for the first quarter of the fiscal year ending March 2012.
The Game Software segment was the primary growth driver, generating ¥23.1 billion in sales—a 54.8% increase compared to the same period in the previous year.
The Online & Mobile segment experienced significant expansion, with sales rising 79.5% to ¥4.6 billion and contributing ¥1.20 billion to operating income.
Market Analysis
Investment
Japan
+1
Koei Tecmo
Report
1 pages
Financial Highlights: 1st Half of Fiscal Year Ending March 2012
Tecmo Koei Holdings returned to profitability in the first half of fiscal year 2012, reporting ¥412 million in net income compared to a ¥571 million loss in the same period the previous year.
Operating income reached ¥641 million, a significant turnaround from the ¥1,656 million loss recorded in the first half of the prior fiscal year.
Net sales grew 23.2% year-over-year to ¥11,069 million, fueled by strong performance in the Game Software segment (+40.7%) and the Online & Mobile segment (+57.2%).
Market Analysis
Investment
Japan
Koei Tecmo
Report
1 pages
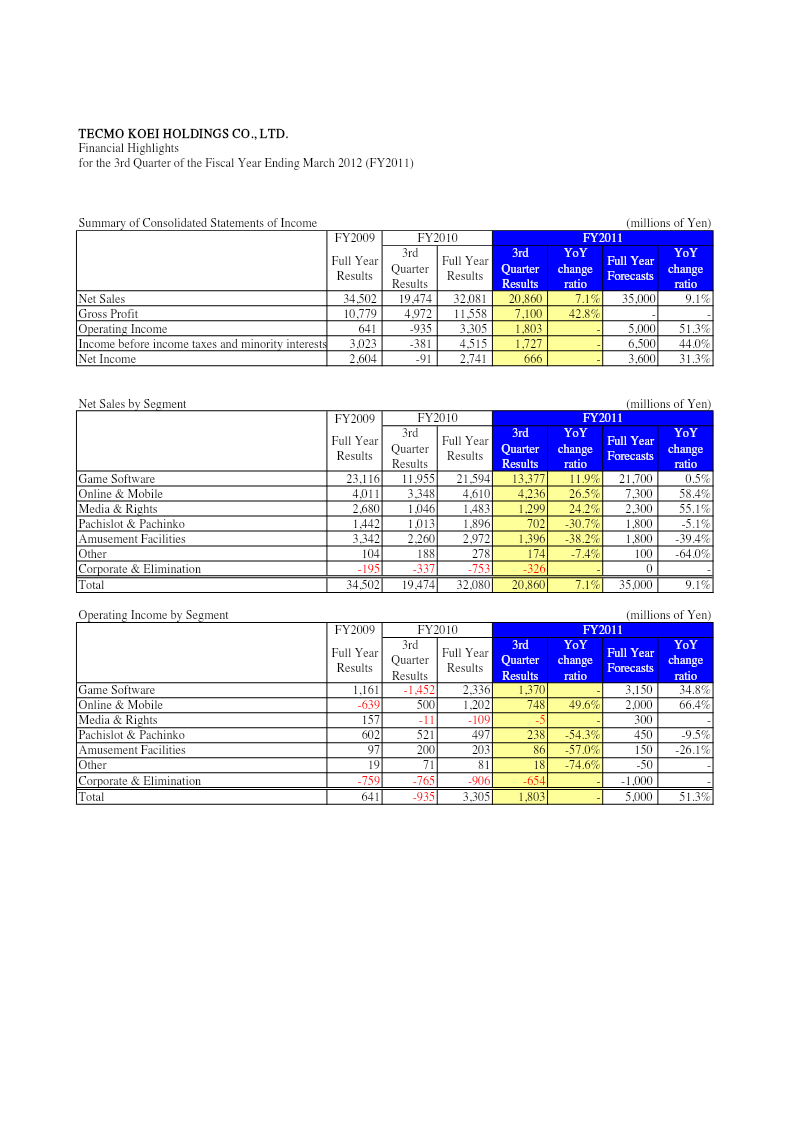
Financial Highlights: 3rd Quarter of the Fiscal Year Ending March 2012
Consolidated net sales for Q3 of the fiscal year ending March 2012 rose 7.1% to ¥32,080 million, while operating income surged 51.3% to ¥3,305 million.
The Game Software segment remains the primary driver of profitability, growing 11.9% to ¥21,594 million in sales and contributing ¥2,336 million in operating income.
The Online & Mobile segment achieved a turnaround, growing 26.5% to ¥4,610 million in sales and generating ¥1,202 million in operating income after posting a loss in the prior year.
Market Analysis
Investment
Japan
+1
Koei Tecmo
Report
1 pages
Financial Highlights: FY2011
Tecmo Koei Holdings achieved a 74.2% surge in operating income to ¥5,758 million and a 69.3% increase in net income to ¥4,640 million for the fiscal year ending March 2012.
Net sales grew 10.7% to ¥35,525 million, driven primarily by a 15.2% increase in Game Software sales to ¥24,883 million.
Game Software operating profit more than doubled, jumping 105.4% to ¥4,797 million, which served as the primary catalyst for the company's overall profit growth.
Market Analysis
Investment
Japan
Koei Tecmo
Report
27 pages
Management Policy & Strategy: Fiscal Year Ended March 2013
Tecmo Koei achieved record-high profitability in FY2012, with operating profit reaching ¥6.21 billion (17.9% of sales) and net income margin increasing to 16.3%.
Total sales grew 2.5% year-over-year to ¥34.6 billion, driven primarily by strong performance in game software titles like 'One Piece: Dynasty Warriors 8' and 'Fist of the North Star.'
The company maintains a heavy reliance on the domestic market, with Japan accounting for approximately 84% of total sales, while overseas segments (North America, Europe, and Asia) grew by only 1.6%.
Market Analysis
Investment
Japan
Koei Tecmo
Report
1 pages
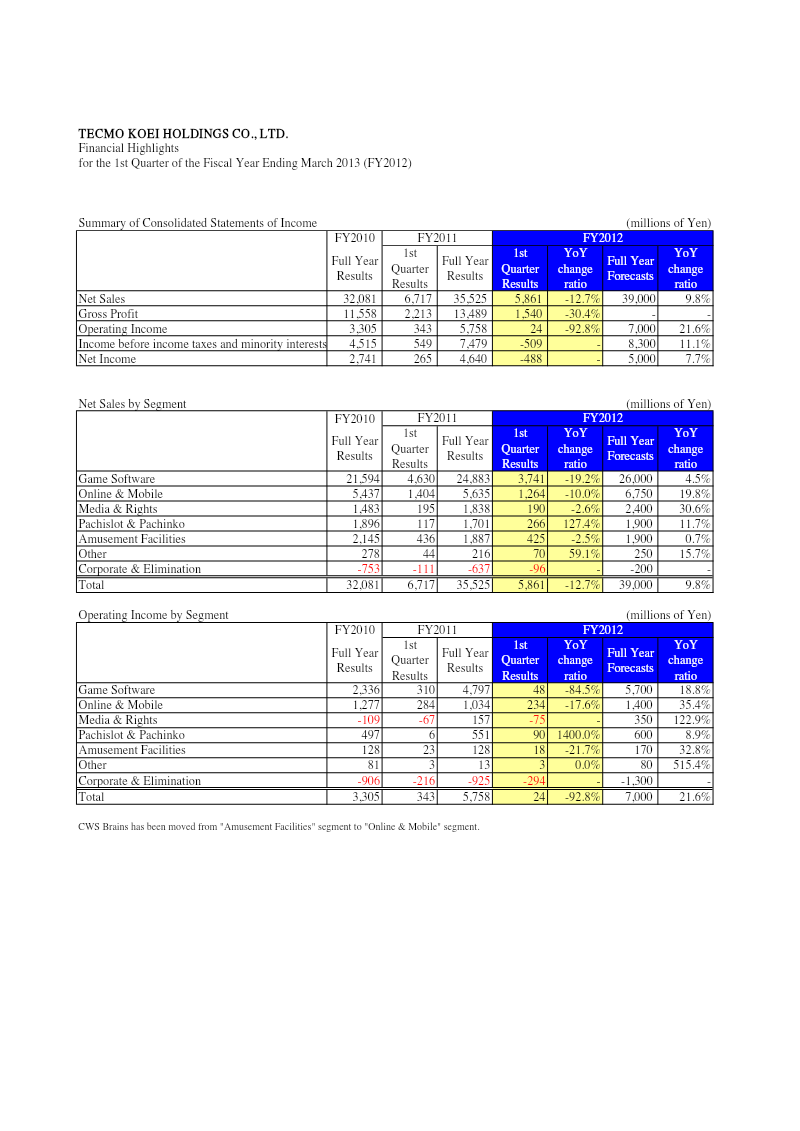
Financial Highlights: 1st Quarter of Fiscal Year Ending March 2013
Tecmo Koei Holdings experienced a significant financial downturn in Q1 FY2013, with net sales falling 12.7% year-over-year to ¥35,525 million and operating income plummeting 92.8% to ¥5,758 million.
The core Game Software segment, the company's primary revenue driver, saw a 19.2% decline in sales and an 84.5% collapse in operating income.
Online & Mobile operations underperformed, recording a 10.0% drop in sales and a 17.6% decrease in operating income.
Investment
Market Analysis
Game Publishing
+1
Koei Tecmo
Report
2 pages
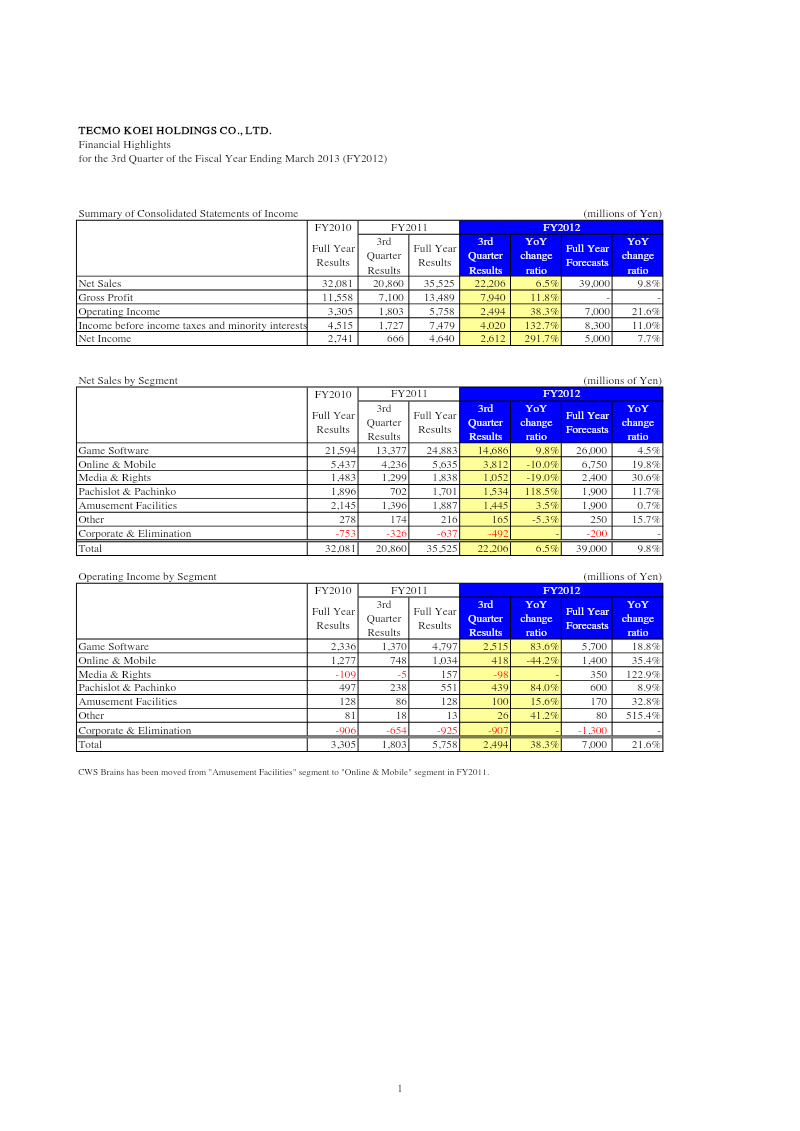
Financial Highlights: 3rd Quarter of the Fiscal Year Ending March 2013
Tecmo Koei Holdings achieved a net income of ¥4,640 million for Q3 FY2012, representing a 291.7% increase over the prior year's ¥666 million.
The Game Software segment was the primary driver of growth, with operating income surging 83.6% year-on-year to ¥4,797 million.
Total net sales rose 6.5% to ¥35,525 million, while overall operating income climbed 38.3% to ¥5,758 million.
Market Analysis
Investment
Japan
+1
Koei Tecmo
Previous
1
…
7
8
9
…
87
Next