Quest
Company
Documents about Quest
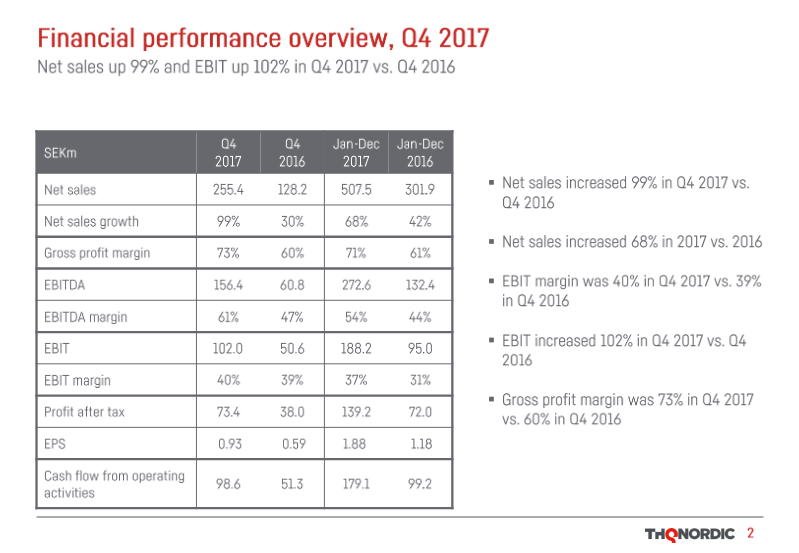
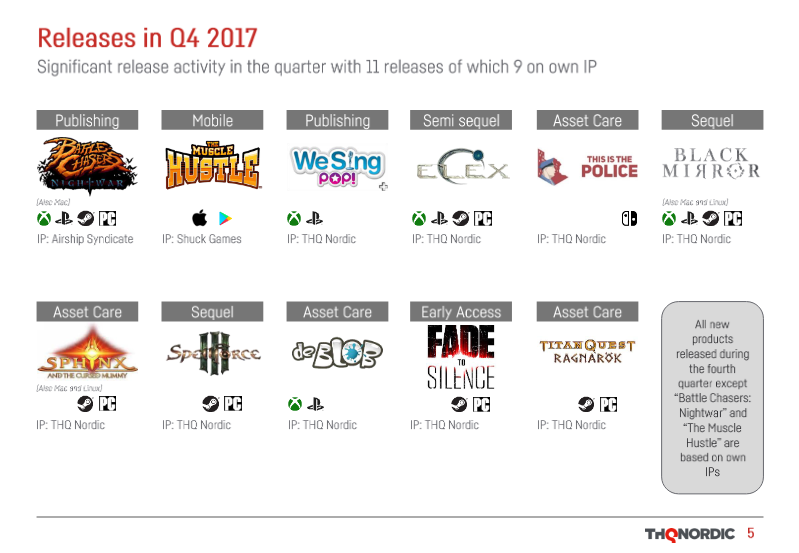
THQ Nordic Q4 2017 Interim Report
THQ Nordic experienced substantial financial growth during the fourth quarter of 2017, characterized by a 99% increase in net sales and a 102% rise in EBIT compared to the same period in 2016.

Legendary: Game of Heroes - A Master Class in Live Operations
The mobile title Legendary: Game of Heroes serves as a primary case study for effective live operations in the match-3 RPG genre.
- Legendary: Game of Heroes achieved consistent month-over-month growth for over 18 months by utilizing a highly sophisticated live operations model that outperformed established competitors like Puzzle & Dragons and Marvel Puzzle Quest.
- The core weekly event loop centers on Slayer and Commander events, where players defeat scaling bosses to earn rewards, driving engagement through a combination of individual league-based leaderboards and global guild rankings.
- Monetization is driven by an aggressive content treadmill featuring weekly 'step gacha' packs, which guarantee specific hero cards at defined steps (e.g., a 3 hero at step 2 and a 5 hero at step 6) to create both low-level currency sinks and high-level spending incentives.
Square Enix Holdings Nine-Month Financial Results: Period Ended December 31, 2017
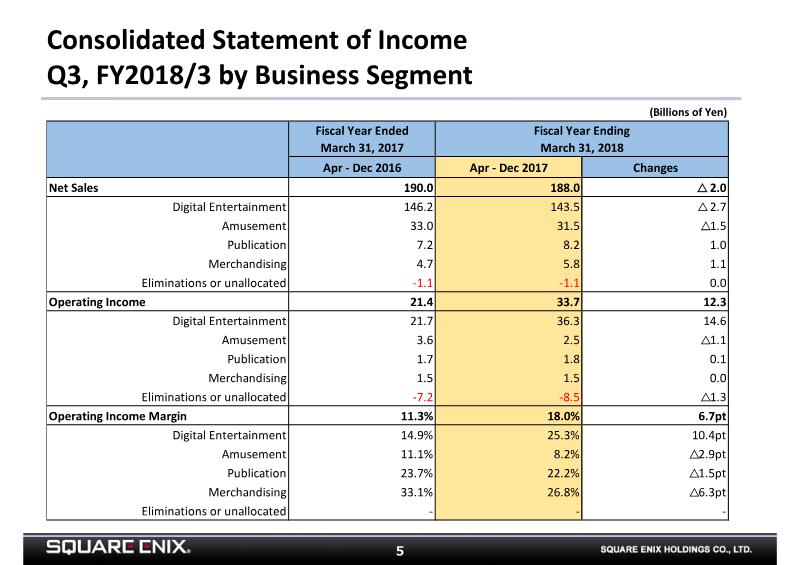
The Square Enix Holdings financial results for the nine-month period ending December 31, 2017, demonstrate a period of significant profit growth driven primarily by the company’s Digital Entertainment segment.
- Square Enix reported a significant increase in operating income for the nine-month period ending December 31, 2017, rising to 33.7 billion yen from 21.4 billion yen in the prior year, representing an operating margin of 18.0%.
- The Digital Entertainment segment was the primary driver of growth, with operating income surging to 36.3 billion yen compared to 21.7 billion yen in the previous year, fueled by strong performance in MMO expansions and mobile titles.
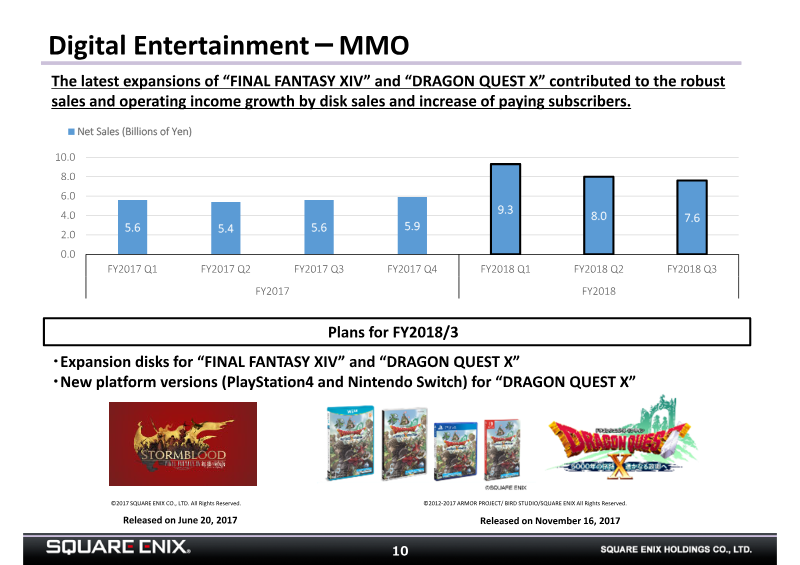
- MMO revenue saw substantial gains due to the release of expansion disks for 'FINAL FANTASY XIV' and 'DRAGON QUEST X' and an increase in paying subscribers.

Top In-App Advertisers of Q4 2017: Android, Game Category
This analysis identifies the leading mobile game advertisers on the Android platform during the fourth quarter of 2017, focusing on in-app advertising impressions.
- In Q4 2017, the mobile gaming advertising landscape on Android was dominated by the Puzzle and Role Playing (RPG) genres.
- Block Puzzle Jewel by Hua Weiwei and Empires & Puzzles: RPG Quest by Small Giant Games maintained stable, leading positions in in-app advertising impressions throughout the quarter.
- New major advertisers entered the top 10 rankings in December 2017, including Coin Master (Moon Active), Lords Mobile (IGG.COM), and Lineage 2: Revolution (Netmarble Games).


2018 Annual Report
Square Enix Holdings concluded the 2018 fiscal year with a robust financial performance, characterized by record-high operating and net income despite a marginal 2.5% decline in consolidated net sales to ¥250.4 billion.
- The Square Enix Group's corporate philosophy is to spread happiness globally by providing unforgettable experiences through high-quality content, services, and products.
- The company aims to be a leader in entertainment, focusing on creating new and creative gaming experiences and hit titles, particularly revisiting development and operation organizations in the fiscal year ending March 2019.
- In the fiscal year ended March 2018, the Amusement segment saw sales decline to ¥41.7 billion and operating income fall to ¥2.4 billion, despite stable arcade operations and new initiatives like renovating Taito Station Mizonokuchi and opening MEGARAGE.
Square Enix Holdings 2Q FY2018/3 Financial Results Briefing
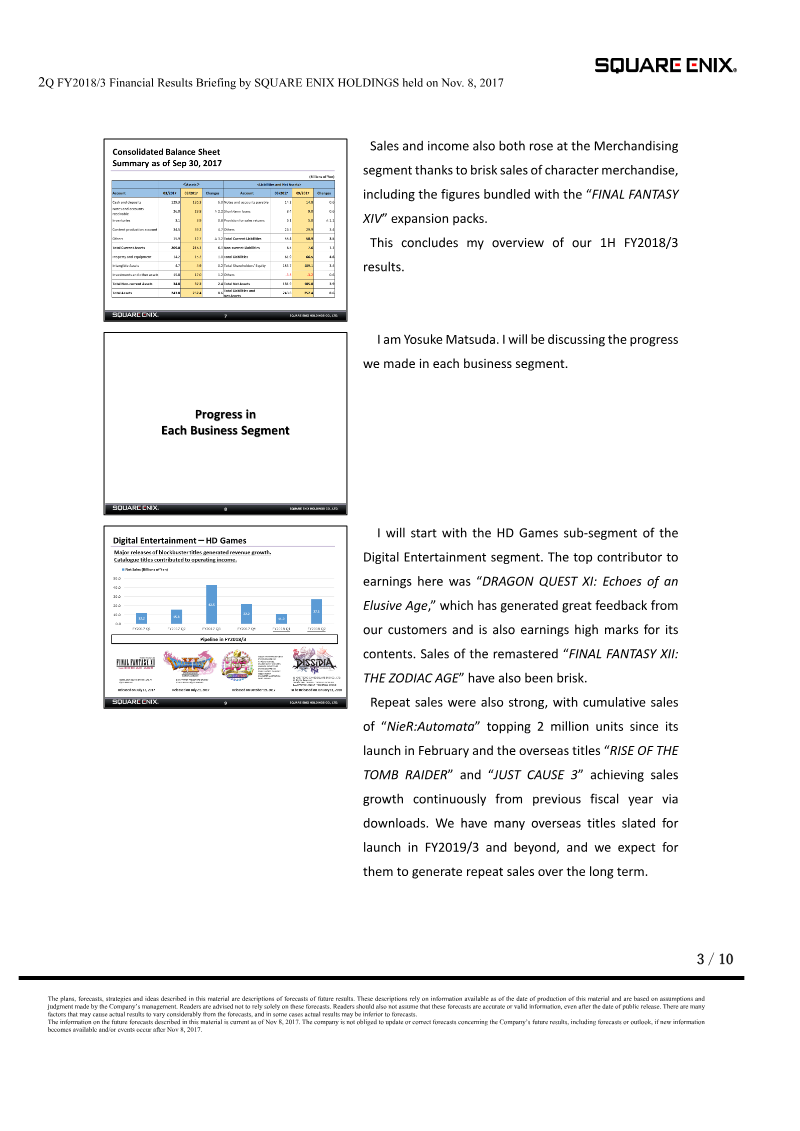
Square Enix Holdings reported strong financial growth for the first half of the fiscal year ending March 31, 2018.
- Square Enix reported strong 1H FY2018/3 financial growth, with net sales reaching ¥132.0 billion (+24.2% YoY) and operating income rising 132.3% to ¥25.8 billion.
- The Digital Entertainment segment drove performance through the launch of 'DRAGON QUEST XI,' increased paying subscribers for 'FINAL FANTASY XIV,' and strong catalog title downloads.
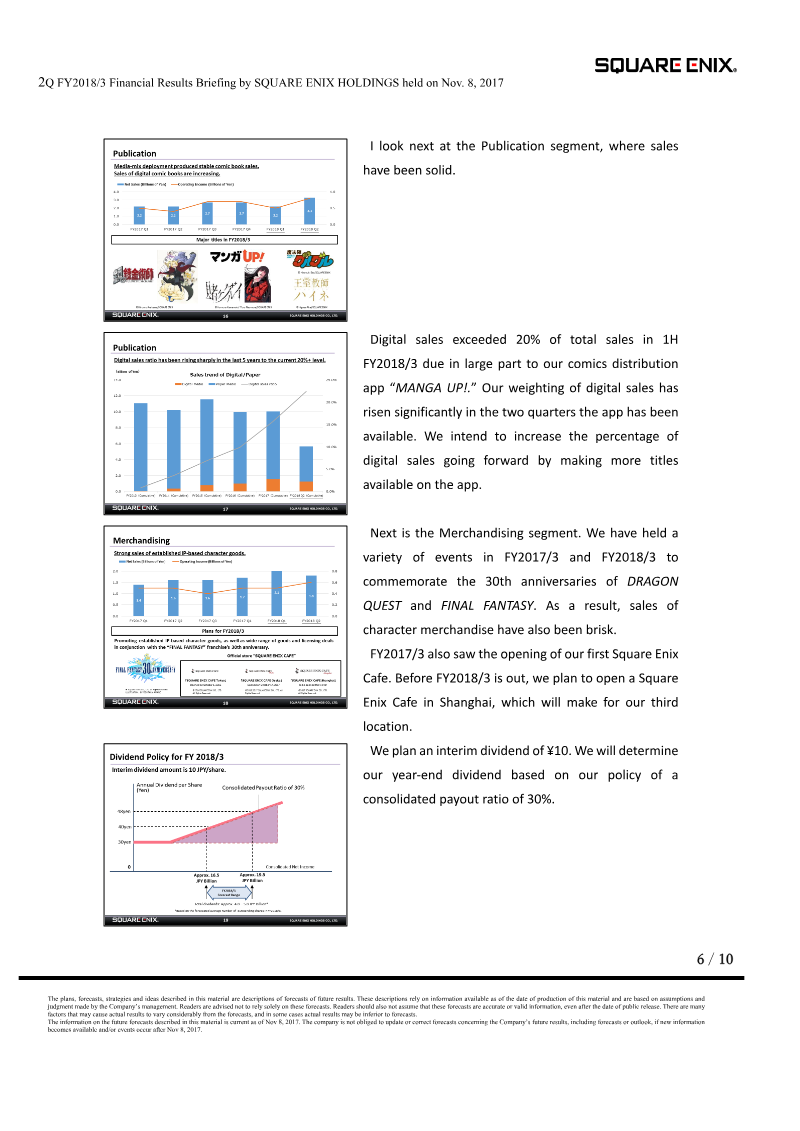
- Digital sales in the Publication segment exceeded 20% of total revenue in 1H FY2018/3, largely attributed to the success of the 'MANGA UP!' distribution app.
Six Months Financial Results Briefing: Fiscal Year Ending March 2018
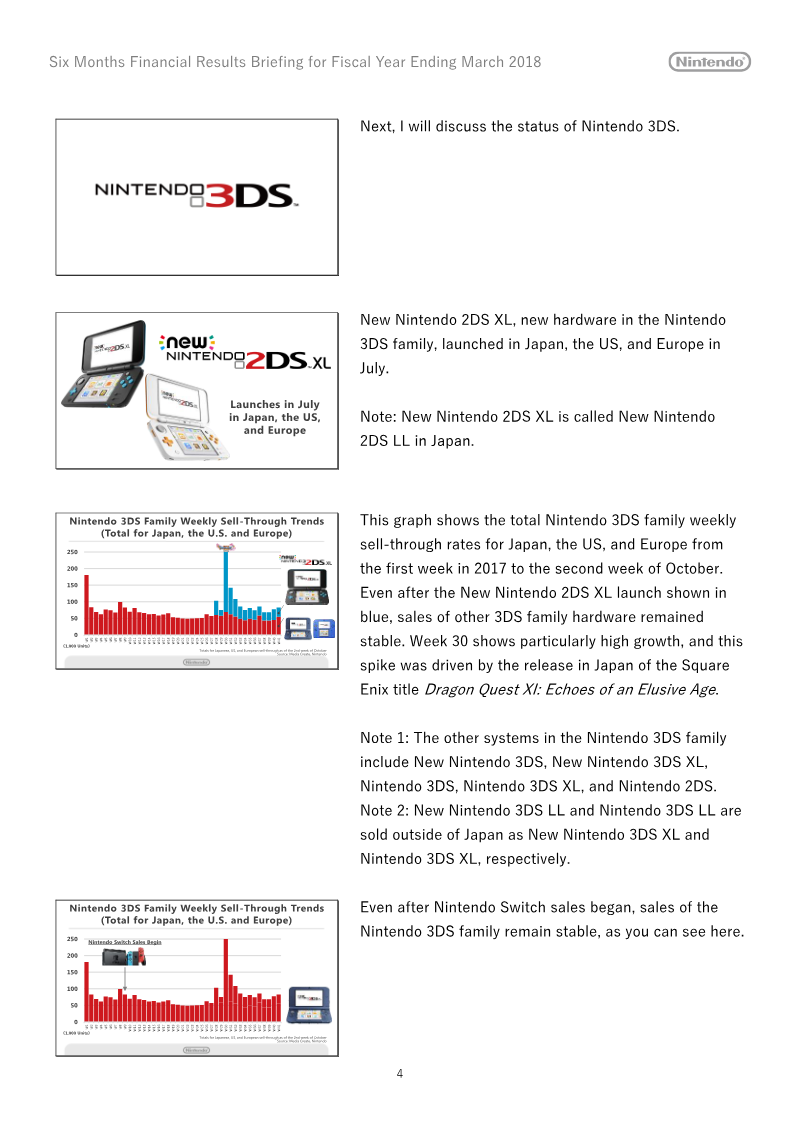
The financial results briefing for the six-month period ending September 2017 outlines Nintendo’s strategic progress across three core pillars: the expansion of its smart-device business, the maintenance of the Nintendo 3DS platform, and the growth of the Nintendo Switch installed base.
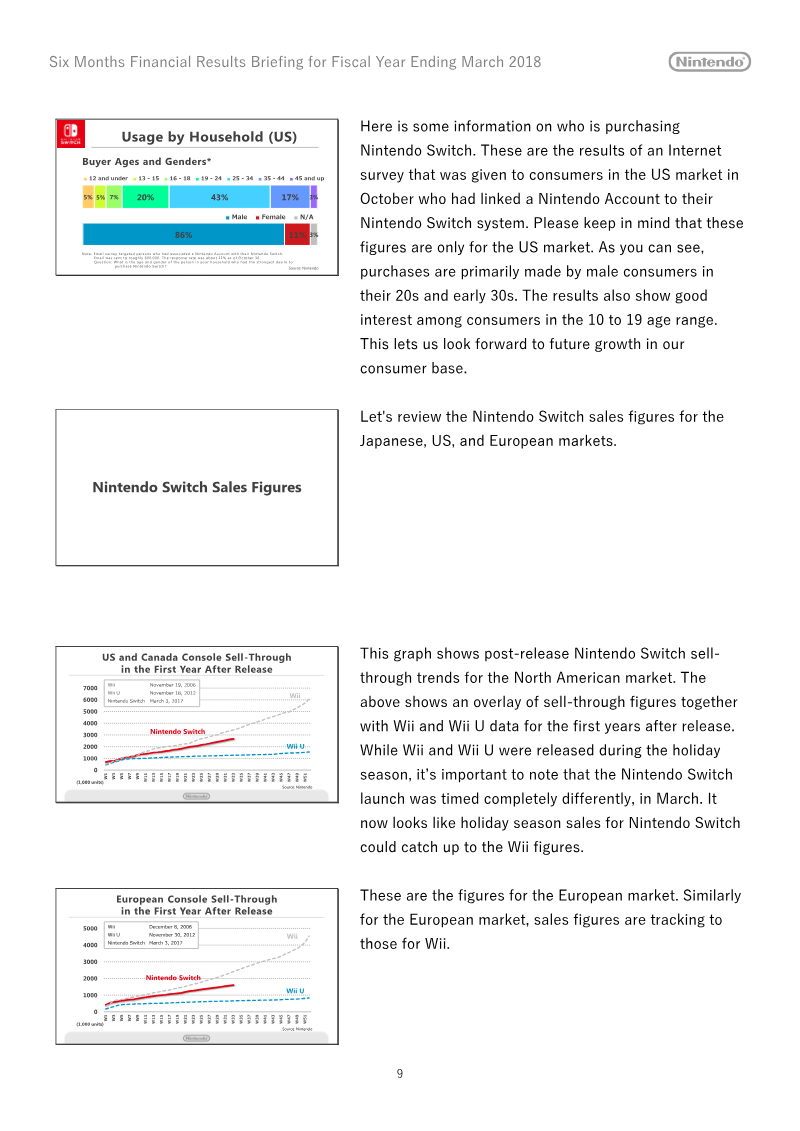
- Nintendo revised its fiscal year 2018 hardware sales projection for the Nintendo Switch to 14 million units, targeting a cumulative sell-in of over 16 million units within the console's first year.
- Super Mario Odyssey achieved rapid commercial success, recording over 2 million units in global sell-through within three days of its October 2017 release.
- The smart-device business saw significant engagement, with Super Mario Run reaching 200 million downloads and Fire Emblem Heroes showing increased overseas sales.

U.K. Road Show Material: February 2017
The February 2017 investor presentation outlines a mid-term growth strategy for Square Enix, centered on achieving six consecutive years of sales growth through the expansion of its Digital Entertainment segment.
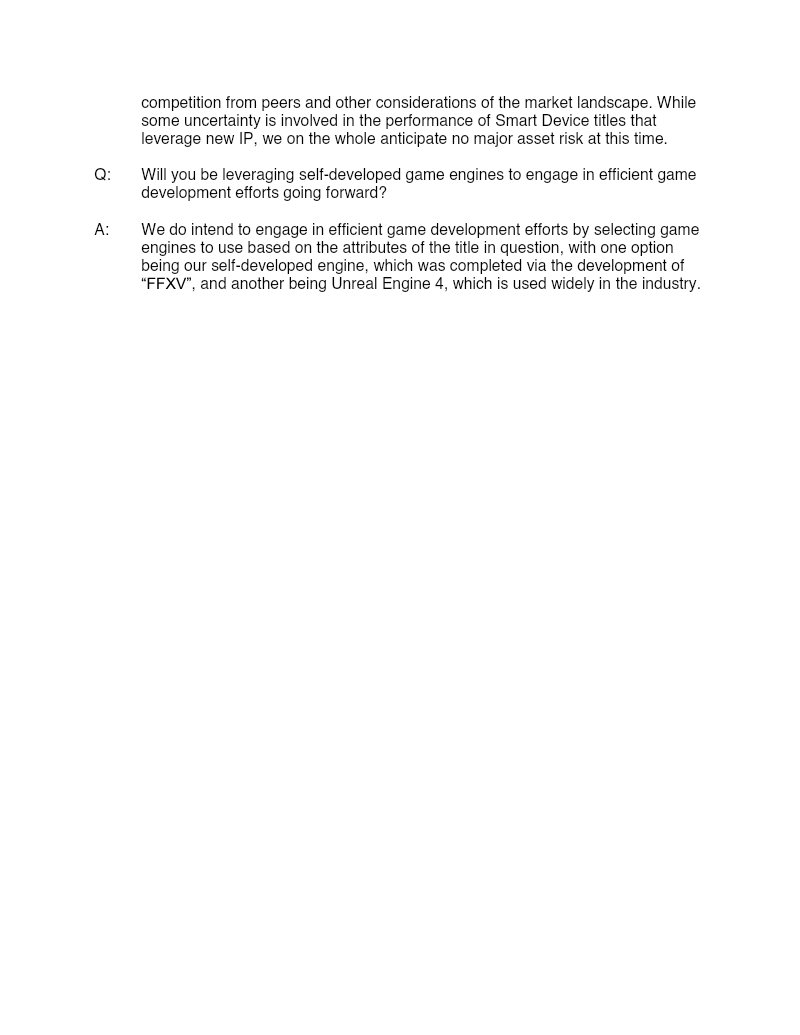
- Square Enix aims to reach 400 billion JPY in sales by fiscal year 2019, targeting six consecutive years of growth in its Digital Entertainment segment.
- The company is prioritizing profitability in its high-definition (HD) gaming division while maintaining a stable revenue foundation through MMOs and smart device games.
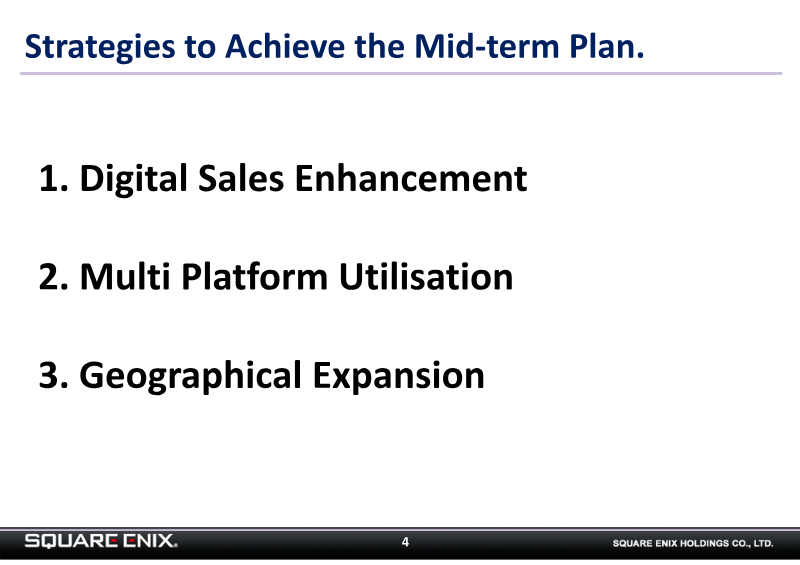
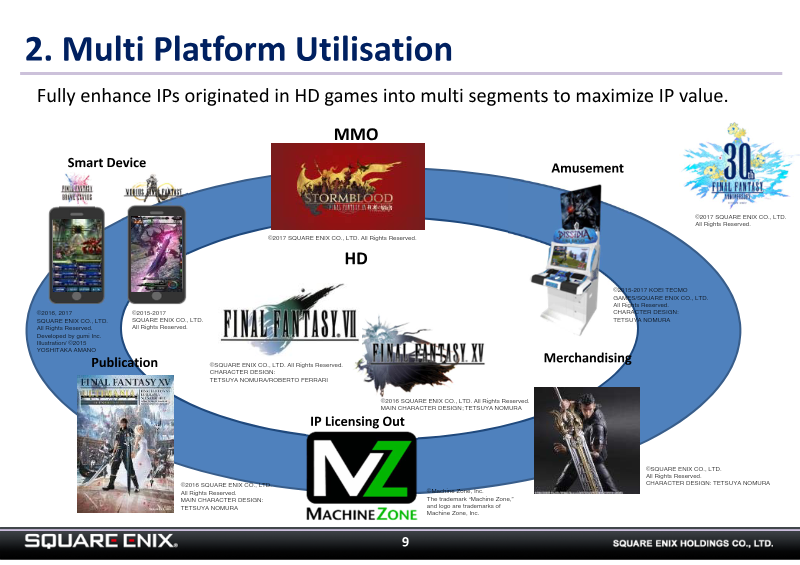
- Strategy focuses on three pillars: enhancing digital sales via a new global website, maximizing multi-platform accessibility across consoles, PC, and mobile, and expanding IP into merchandising and publishing.
Square Enix Holdings 3Q FY2017/3 Financial Results Briefing
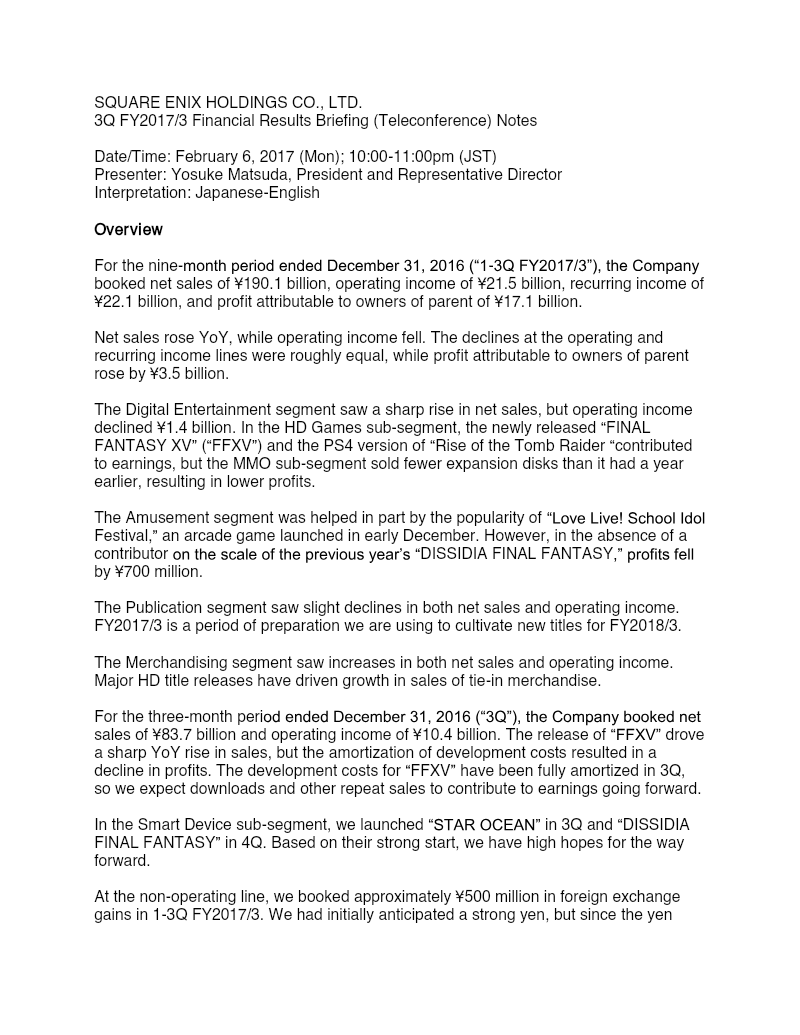
Square Enix Holdings reported financial results for the nine-month period ending December 31, 2016, reflecting a period of high-profile releases balanced by significant development cost amortization.
- Square Enix reported 1-3Q FY2017/3 net sales of ¥190.1 billion and operating income of ¥21.5 billion, with operating income declining year-over-year despite a sharp rise in Digital Entertainment sales.
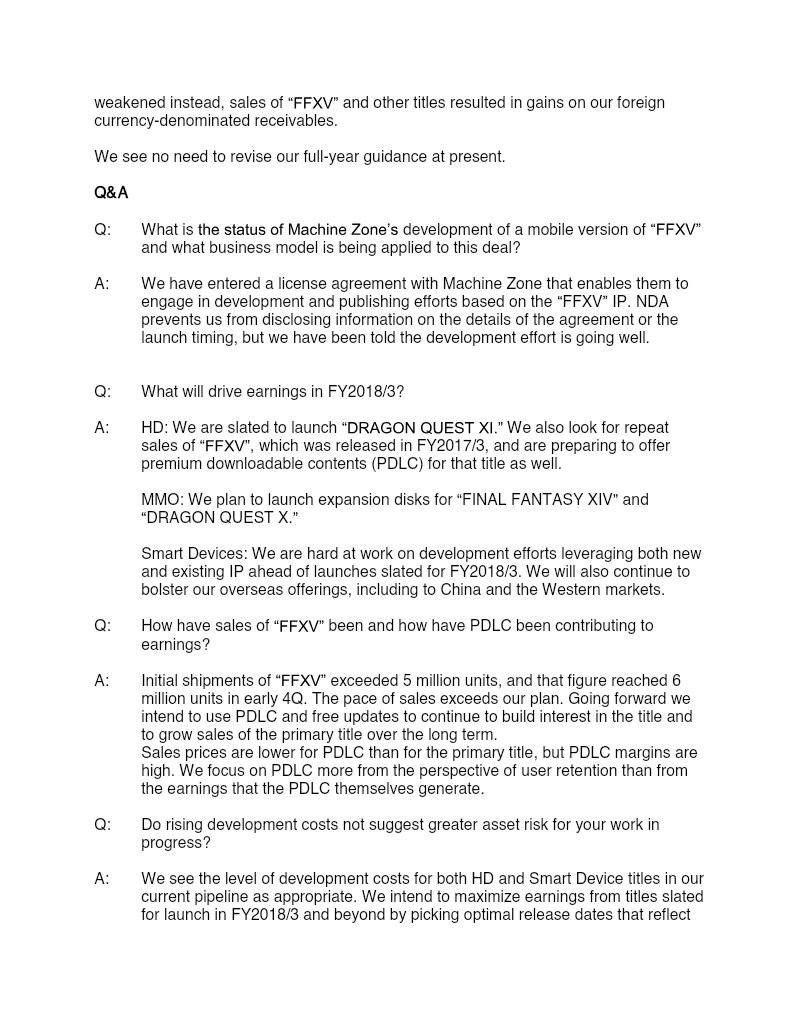
- Final Fantasy XV reached 6 million units in shipments by early 4Q, with development costs fully amortized in 3Q, allowing future downloads and repeat sales to contribute directly to earnings.
- The Digital Entertainment segment experienced a ¥1.4 billion decline in operating income due to lower MMO expansion disk sales compared to the previous year and the heavy amortization of FFXV development costs.
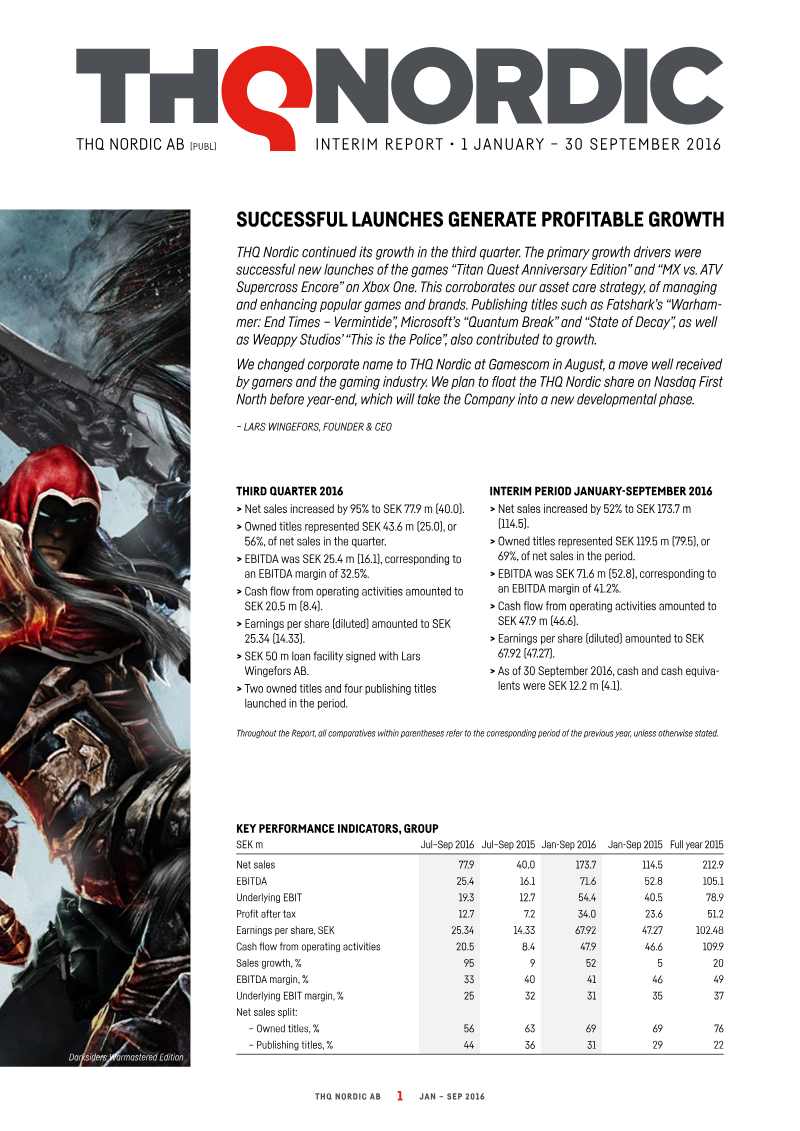
THQ Nordic AB Interim Report: 1 January - 30 September 2016
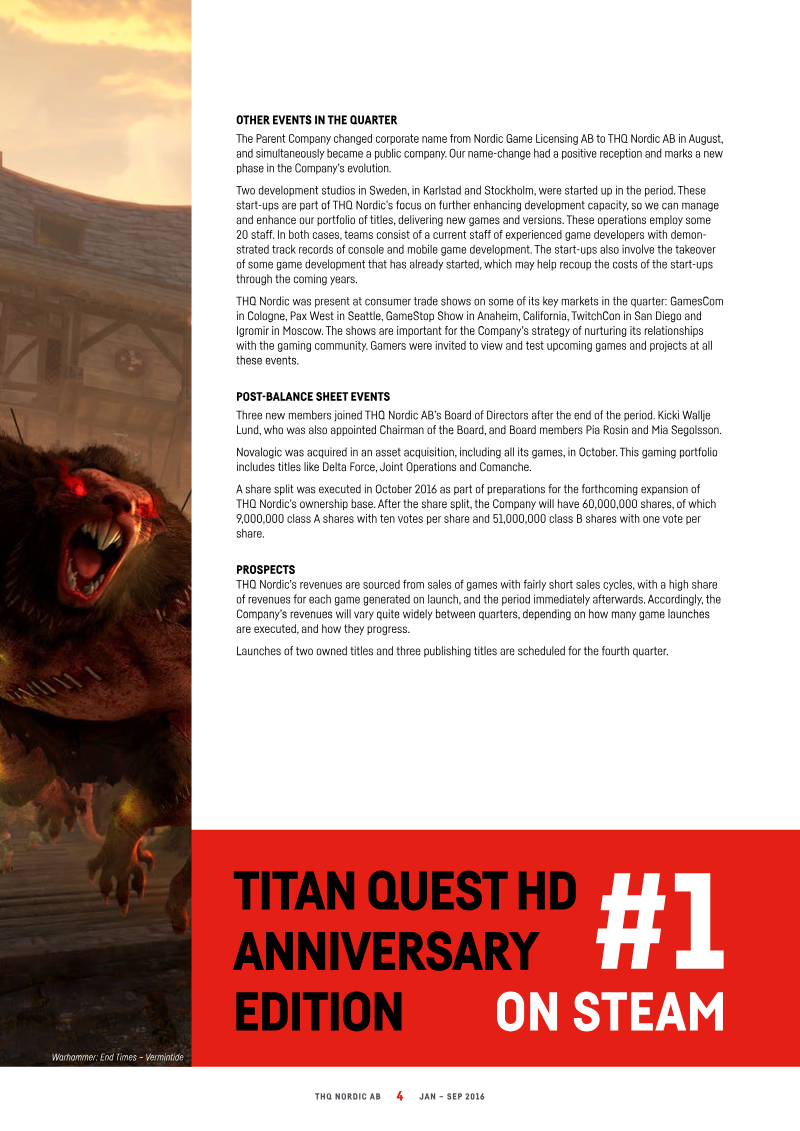
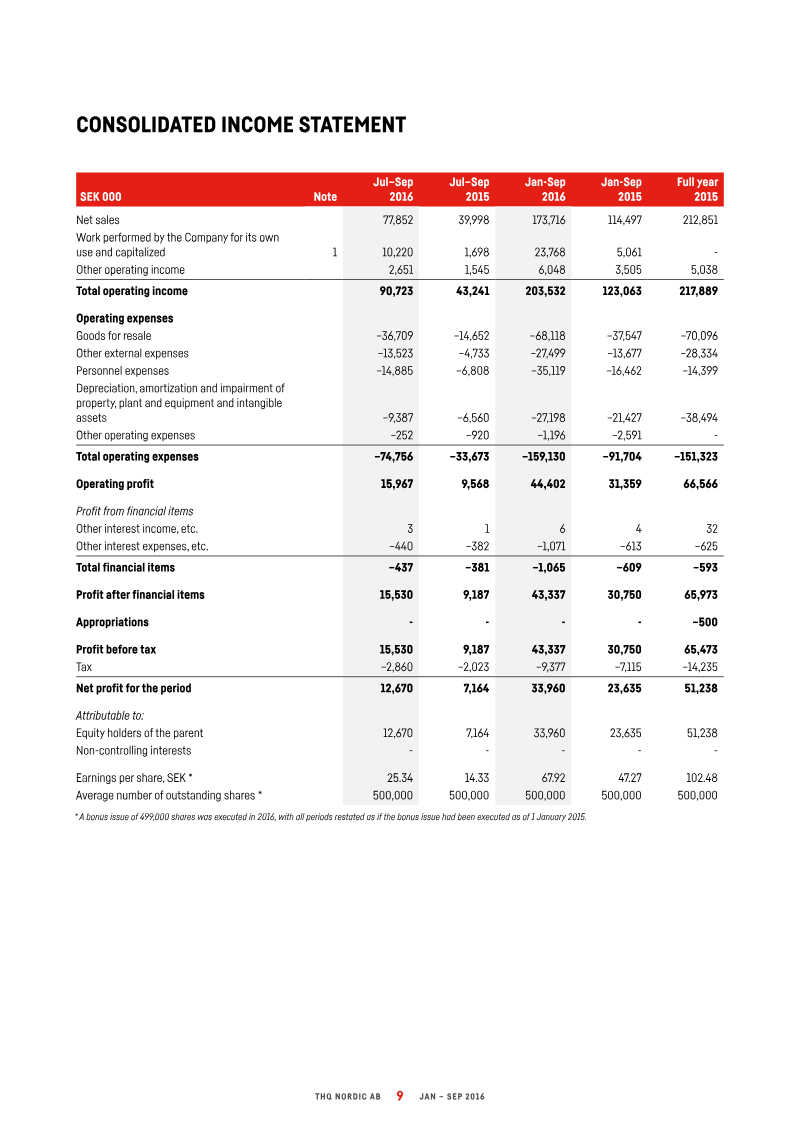
THQ Nordic AB experienced significant financial expansion during the first nine months of 2016, characterized by a 52 percent increase in net sales to SEK 173.7 million compared to the same period in the previous year.
- THQ Nordic AB achieved a 52 percent increase in net sales to SEK 173.7 million for the first nine months of 2016 compared to the same period in 2015.
- The company reported an operating profit of SEK 44.4 million and an EBITDA of SEK 71.6 million for the reporting period.
- Financial growth was driven by an asset care strategy focused on revitalizing existing intellectual property and the commercial success of titles including Titan Quest Anniversary Edition and This is the Police.
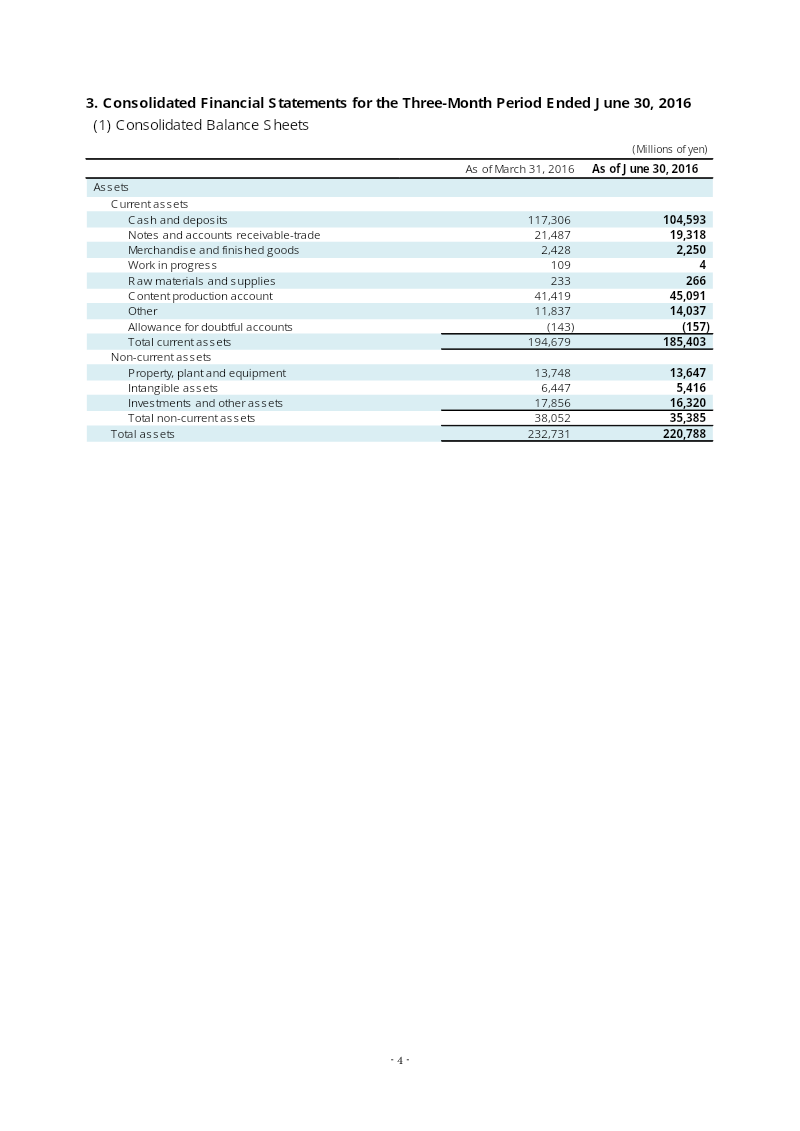
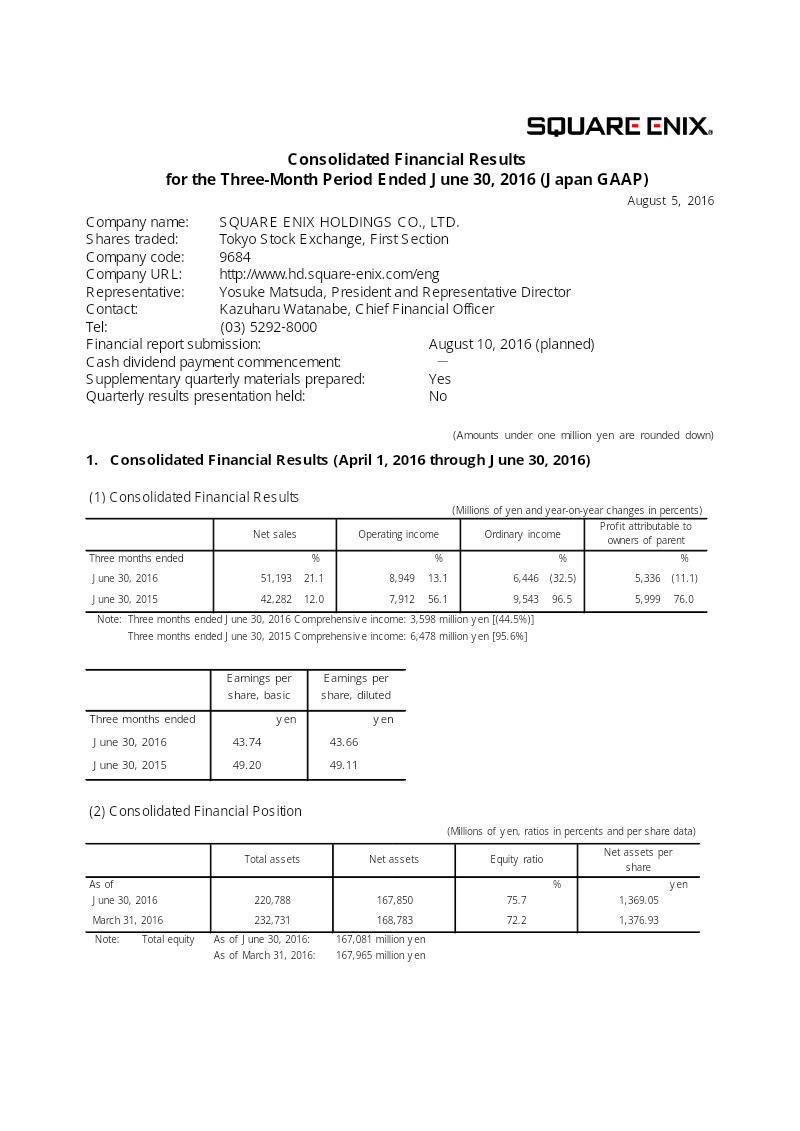
Square Enix Holdings Consolidated Financial Results: Three-Month Period Ended June 30, 2016
Square Enix Holdings reported its consolidated financial results for the three-month period ending June 30, 2016, demonstrating strong top-line growth despite a decline in bottom-line profitability.
- Square Enix reported consolidated net sales of ¥51,193 million for the quarter ended June 30, 2016, a 21.1% increase year-on-year, while operating income rose 13.1% to ¥8,949 million.
- The Digital Entertainment segment, the company's primary revenue driver, saw net sales grow 23.9% to ¥37,541 million and operating income rise 15.6% to ¥9,472 million, fueled by strong performance in smart device, PC browser, and console titles.
- Ordinary income fell by 32.5% to ¥6,446 million, largely impacted by ¥2,520 million in foreign exchange losses compared to the prior year's gains.
2016 Annual Report
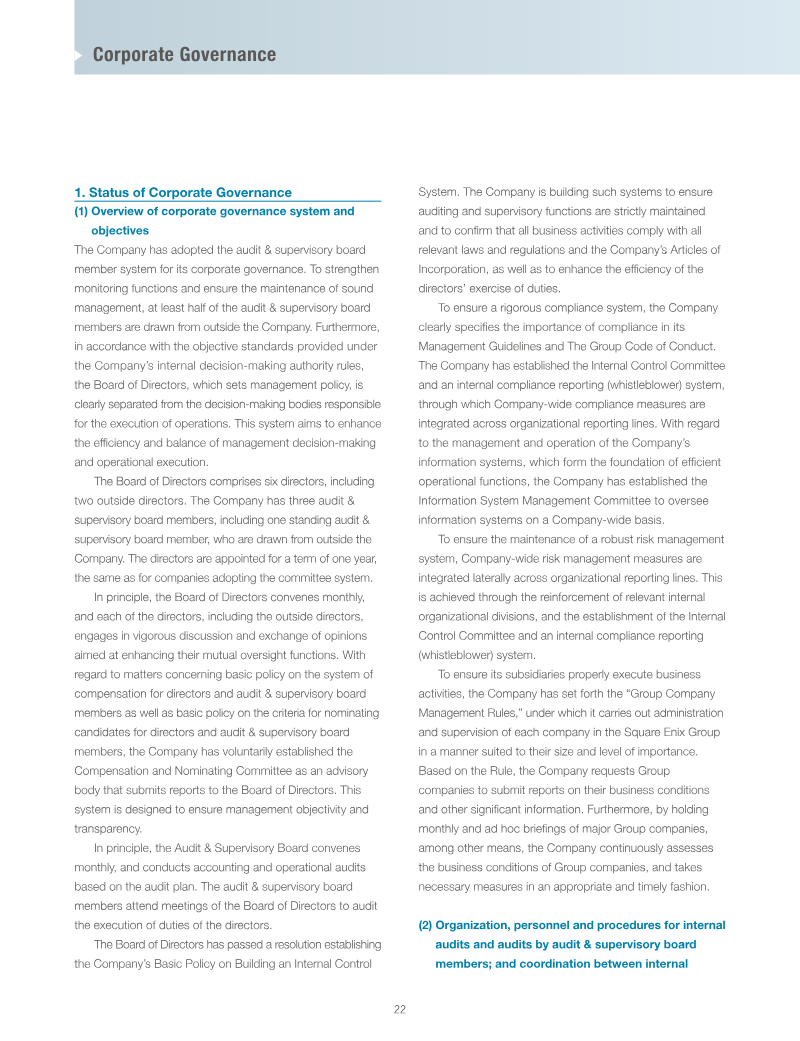
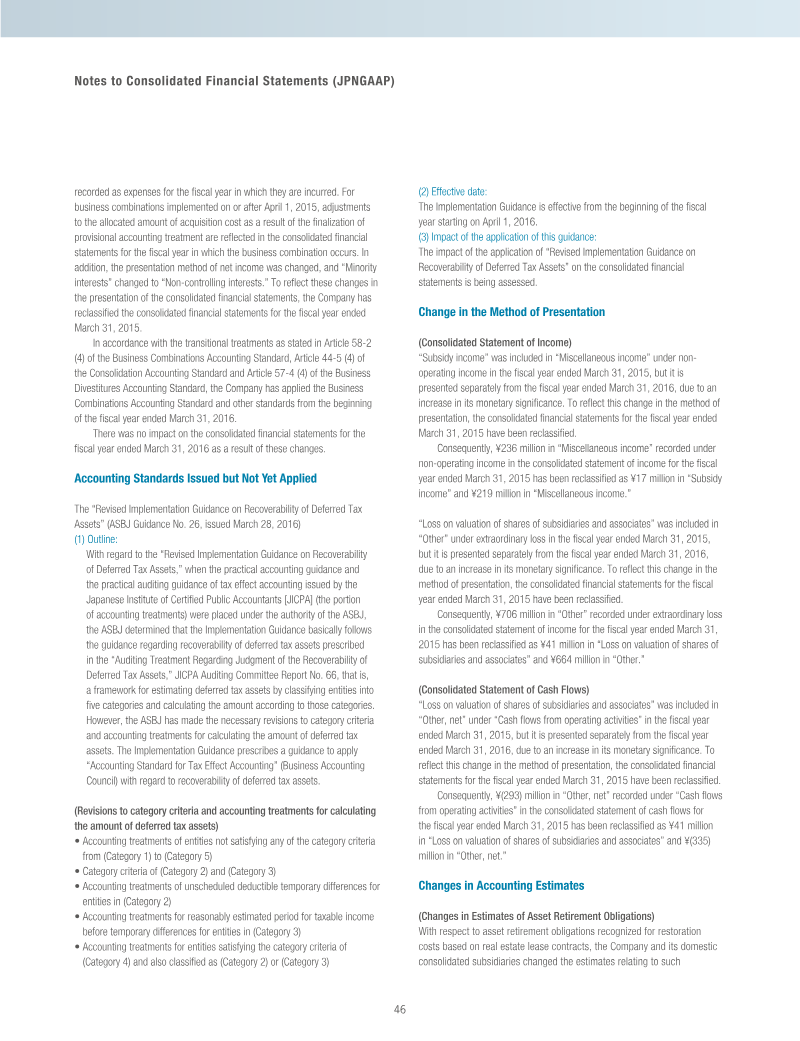
Square Enix achieved record financial performance for the fiscal year ended March 31, 2016, characterized by a 27.5% increase in net sales to ¥214,101 million and a 102.3% surge in profit attributable to owners of the parent.
- Net sales for the fiscal year ended March 31, 2016, exceeded ¥200 billion for the first time, reaching ¥214,101 million, a 27.5% increase from the prior fiscal year, and operating income increased by 58.4% to ¥26,018 million.
- The MMO domain, specifically "DRAGON QUEST X" and "FINAL FANTASY XIV," generated stable earnings, with new content and expansion packs released in the fiscal year ended March 2016 successfully retaining and attracting players.
- The Amusement Business Segment saw brisk performance with year-on-year existing revenue topping 100%, driven by strong demand from foreign tourists, especially from Asia, and the successful rollout of an e-money system.