2015
Company
Documents about 2015

Tencent 2015 Annual Report
Tencent’s 2015 annual performance reflects a period of robust financial expansion and strategic consolidation within the Chinese technology sector.
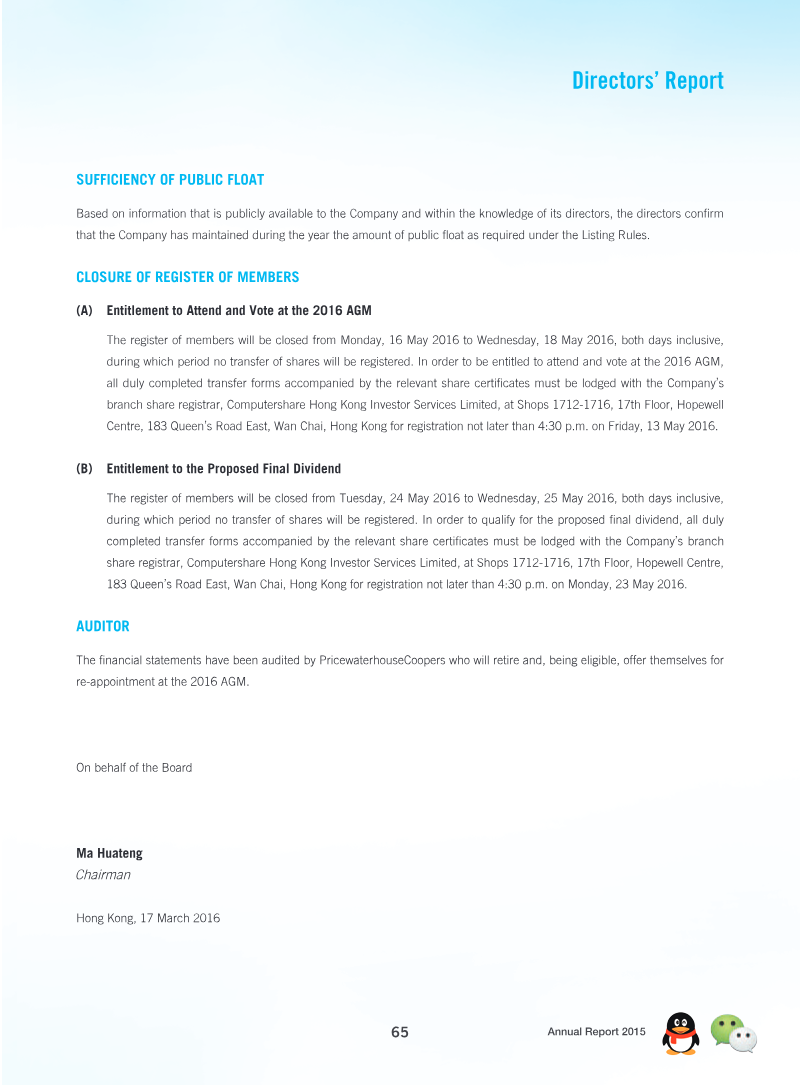
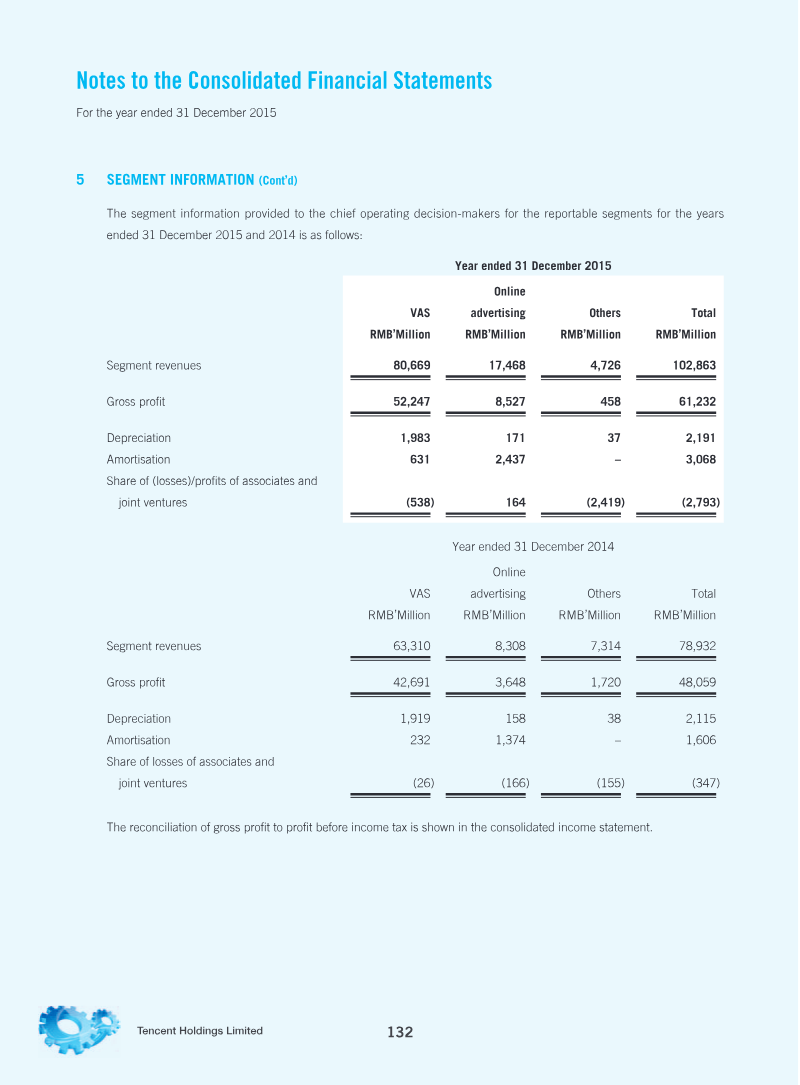
- Tencent achieved a 30% increase in total annual revenue to RMB 102.9 billion and a 21% rise in profit to RMB 28.8 billion in 2015.
- Growth was driven by a 39% increase in combined Weixin and WeChat monthly active users, a 26% rise in online game revenue, and a 110% surge in online advertising.
- The company utilized 'Structure Contracts' to consolidate domestic operating companies in restricted sectors like telecommunications and gaming, while acknowledging inherent regulatory and tax risks.



Q3 2015 Data Digest
This Q3 2015 data digest provides an analysis of the iOS app market, focusing on downloads, revenue, top publishers, and advertising insights.
- Gaming remains the dominant App Store category, generating over 20 times the revenue of the next leading category.
- Clash of Clans maintained its lead in Q3 2015, though Game of War significantly narrowed the revenue gap in the U.S. market.
- Aggressive advertising on the Facebook network, particularly using high-production image and video assets, shows a strong correlation with increased revenue for gaming and lifestyle apps like those from ContextLogic.

The eSports Economy: Trends, Audience and Revenue Growth Towards 2017
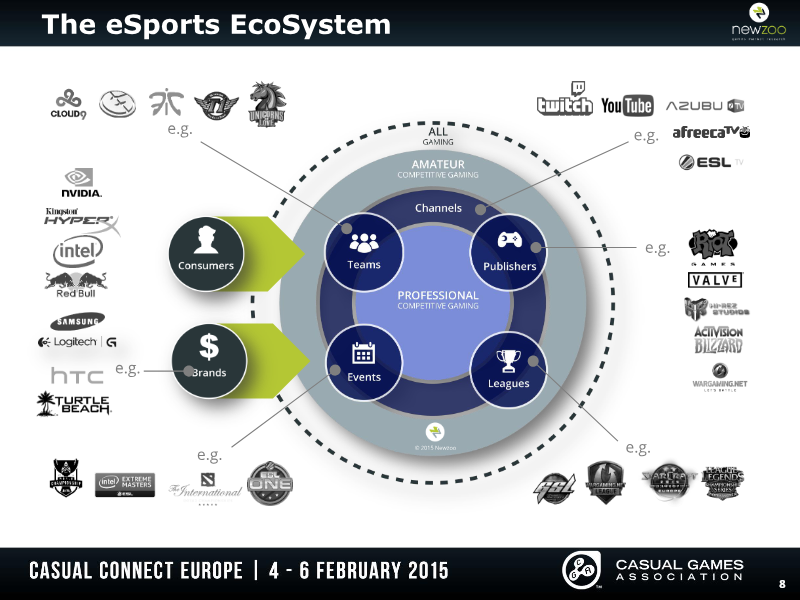
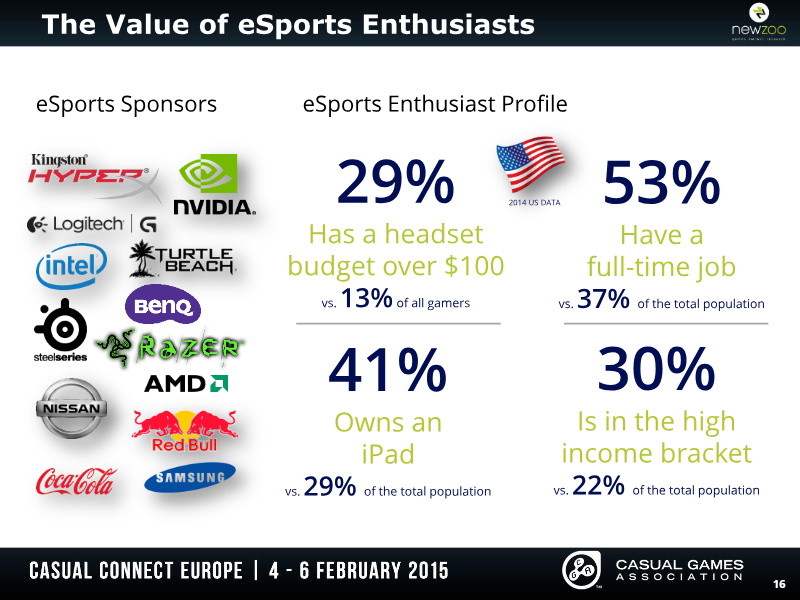
This document, "The eSports Economy: Trends, Audience and Revenue Growth Towards 2017," analyzes the burgeoning eSports market, detailing its audience demographics, revenue streams, and growth projections.
- The eSports enthusiast base is projected to exceed 100 million by 2017, maintaining a 20% compound annual growth rate between 2012 and 2017.
- Approximately 40% of eSports viewers are spectators who do not actively play the games they watch, indicating a shift toward viewing as a standalone entertainment medium.
- Streaming platforms are central to the industry's infrastructure, exemplified by Twitch reaching 100 million unique monthly viewers in 2014.

The Consumer as Producer: How Games & Video Converge to Drive Growth
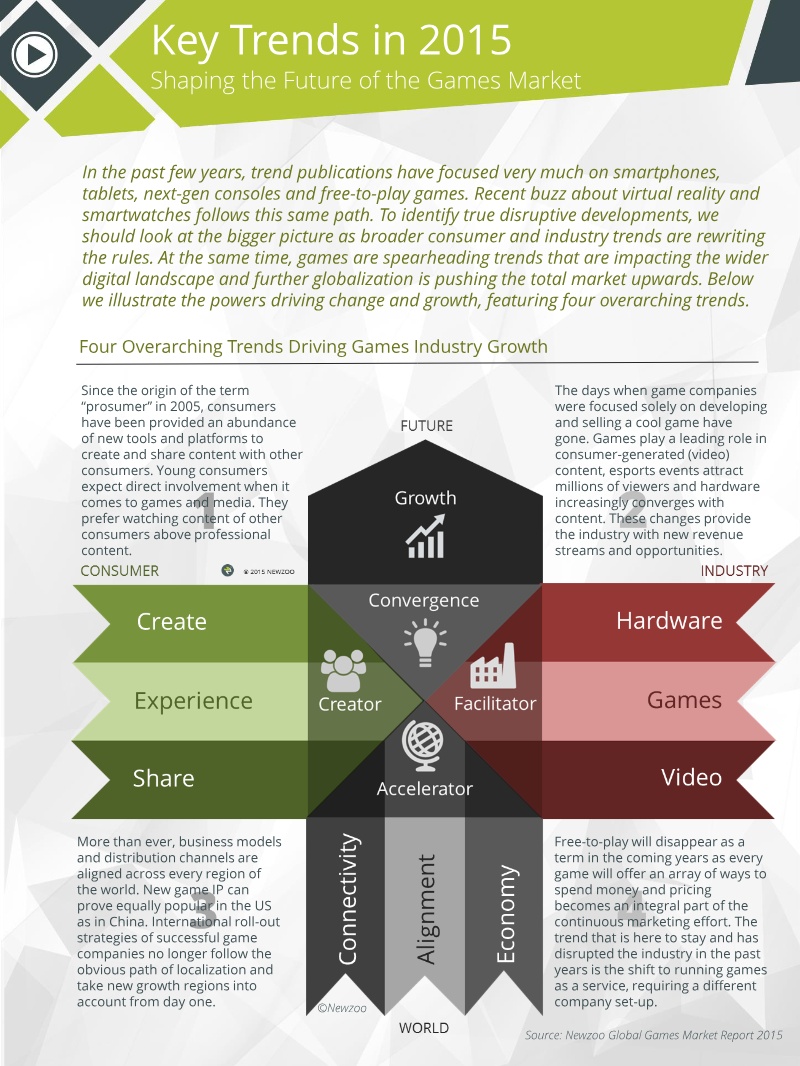
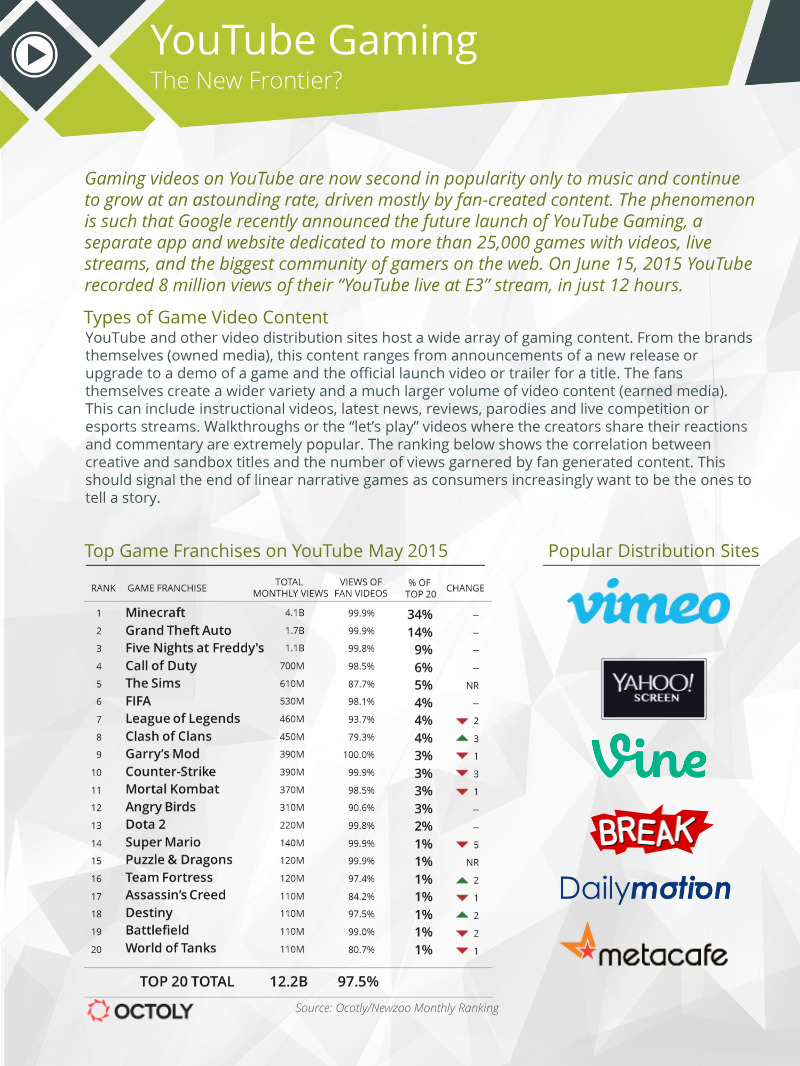
The document, "The Consumer as Producer: How Games & Video Converge to Drive Growth," analyzes the evolving relationship between consumers and content creation within the global games market, emphasizing the accelerating trend of consumer involvement in creating, streaming, and sharing gaming video content.
- The gaming industry is shifting from a one-way consumption model to a collaborative ecosystem where players act as 'prosumers' who create, share, and monetize content.
- Global games revenue is projected to reach $113.3 billion by 2018, growing at a compound annual rate of 7.9% from 2014.
- China and the United States will dominate the market, collectively accounting for 50% of global gaming revenues by 2018.
Spotting the Mobile Spenders: An Analysis of Paying Smartphone and Tablet Gamers
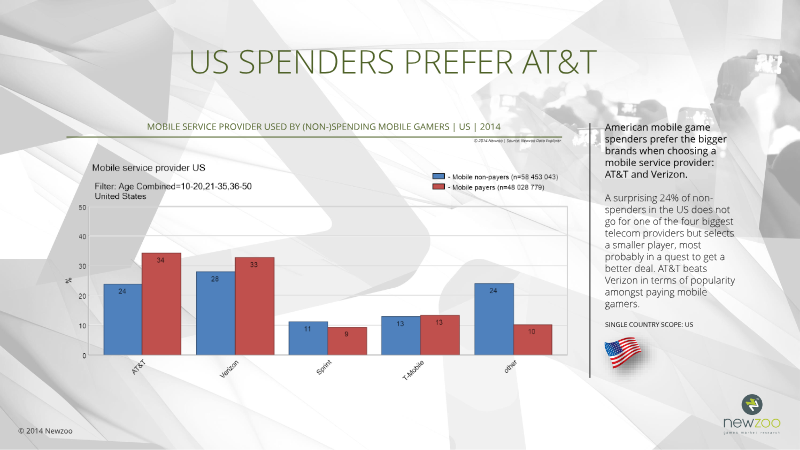
This Newzoo report, "Spotting the Mobile Spenders," analyzes paying smartphone and tablet gamers globally, with a specific focus on the US and Western Europe.
- Mobile gaming is projected to reach $25 billion in global revenue by 2014, with mobile expected to account for 50% of total game revenues by 2017.
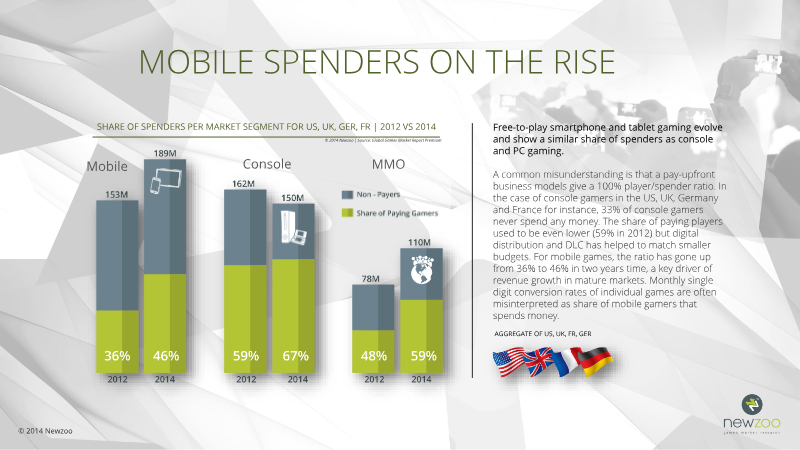
- The share of paying mobile users in Western Europe and the United States grew from 36% to 46% over the last two years, debunking claims of market saturation.
- The Amazon Appstore is an undervalued channel, as its users demonstrate a higher propensity to spend money compared to those on Google Play or Apple platforms.
Publicaciones: DEV
This is the fourth page of the publications archive of DEV, the Asociación Española de Empresas Productoras y Desarrolladoras de Videojuegos y Software de Entretenimiento, which catalogues the association's research reports on the Spanish video game development sector.
- The 'Libro Blanco del Desarrollo Español de Videojuegos' is the primary annual reference for the Spanish game industry, aggregating data from over 100 studios to track employment, revenue, investment, and export performance.
- DEV produces regional white papers for Catalonia (2016, 2018), Valencia (2018), and Andalusia (2019) to provide localized analysis of company composition, talent pipelines, and fiscal incentives.
- Specialized publications such as 'Las 3D de la Financiación de Videojuegos' and 'Informe Incentivos Fiscales' provide targeted analysis on capital market dynamics and tax-related support for the sector.

Le Guide du PEGI: France
Le Guide du PEGI, publié par le Syndicat des Éditeurs de Logiciels de Loisirs (SELL) en 2018, vise à expliquer au grand public le système de classification des jeux vidéo PEGI (Pan European Game Information).
- The PEGI system is an industry-led classification framework officially recognized and homologated by the French Ministry of the Interior since December 2015.
- The system currently operates across 38 European countries to provide standardized age ratings and content descriptors for video games.
- The Interactive Software Federation of Europe (ISFE) developed the PEGI system to address concerns regarding content suitability for younger audiences.

Mobile Game Market
Udonis's mobile game market topic page is a content hub from a mobile marketing agency, collecting its April 2026 articles on the mobile gaming industry.
- Playrix has reached a significant milestone of over $12 billion in total revenue and 2.6 billion downloads as of 2026.
- Playtika has generated more than $9.3 billion in revenue specifically through in-app purchases.
- Outfit7 has achieved a massive scale in user acquisition, recording over 25 billion total downloads.
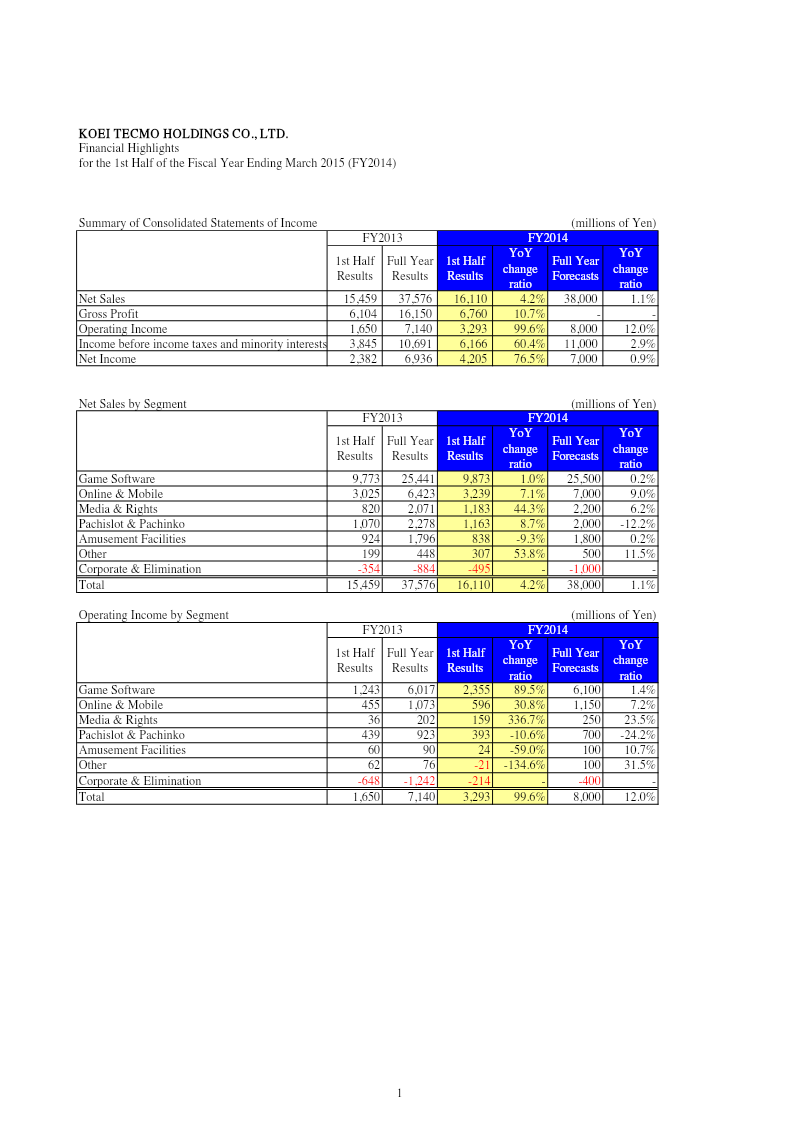
Financial Highlights: 1st Half of the Fiscal Year Ending March 2015
Financial highlights for the first half of fiscal year 2014, ending March 31 2014, show robust growth across KOEI TECMO HOLDINGS’ core segments.
- KOEI TECMO HOLDINGS achieved a 99.6% increase in operating income to ¥7,140 million and a 76.5% rise in net income to ¥6,936 million for the first half of the fiscal year ending March 2015.
- Net sales grew 4.2% year-on-year to ¥37,576 million, fueled by a 1.0% increase in game software sales and a 7.1% rise in online and mobile revenue.
- Profitability in the game software segment surged with an 89.5% increase in operating profit, while the online and mobile segment saw a 30.8% profit gain.
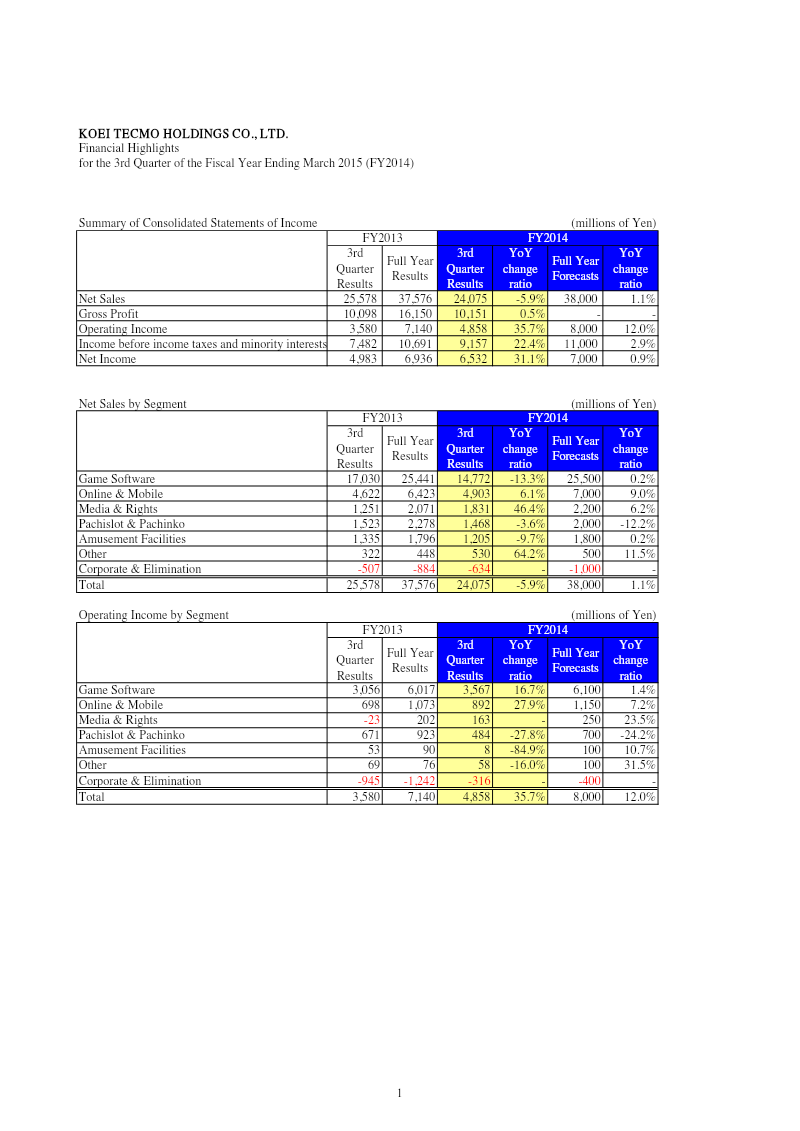
Financial Highlights: 3rd Quarter of the Fiscal Year Ending March 2015
Financial highlights for the third quarter of fiscal year 2014, ending March 31 2015, show a robust performance across KOEI TECMO HOLDINGS’ core segments.
- KOEI TECMO HOLDINGS achieved a 35.7% surge in operating income to ¥7,140 million, significantly outperforming the company's forecast by 12.0%.
- Net income for the third quarter ending March 31, 2015, rose 31.1% year-over-year to ¥6,936 million, despite a 5.9% decline in net sales to ¥37,576 million compared to the prior year.
- The Media & Rights segment experienced a sharp 46.4% revenue expansion to ¥2,071 million, successfully shifting from a loss to a profit of ¥202 million.
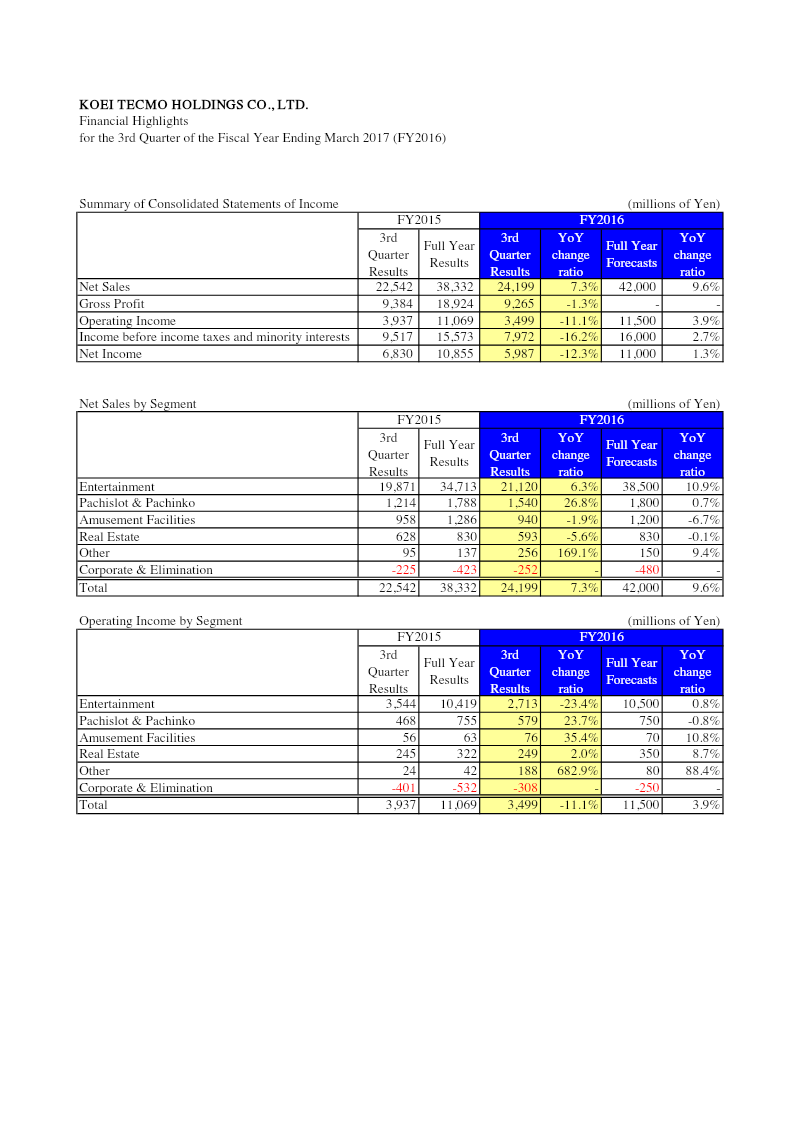
Financial Highlights: 3rd Quarter of the Fiscal Year Ending March 2017
Financial highlights for KOEI TECMO Holdings’ third quarter of fiscal 2016 reveal a robust revenue surge, with net sales rising to ¥38.3 billion from ¥22.5 billion in the same period of fiscal 2015, a 7.3% increase that aligns with the company’s forecast of 9.6%.
- KOEI TECMO Holdings reported a significant revenue increase to ¥38.3 billion for the third quarter of fiscal 2016, up from ¥22.5 billion in the same period of the previous year.
- Operating income rose 11.1% to ¥11.1 billion, while net income grew 12.3% to ¥10.9 billion, tracking closely toward the company's full-year forecast of ¥11 billion.
- The entertainment segment remains the primary driver of financial performance, generating ¥34.7 billion in sales and contributing ¥10.4 billion to the total operating income.