2015
Company
Documents about 2015
Modern Times Group Q2 2016 Interim Report
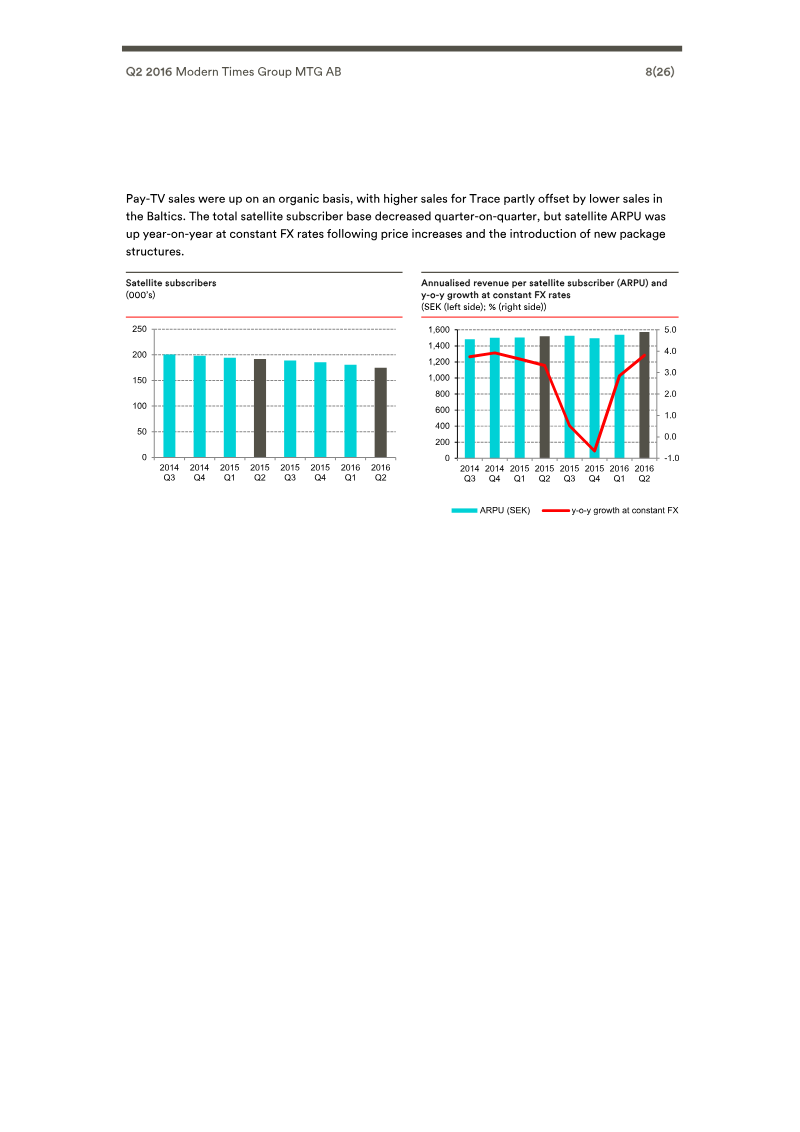
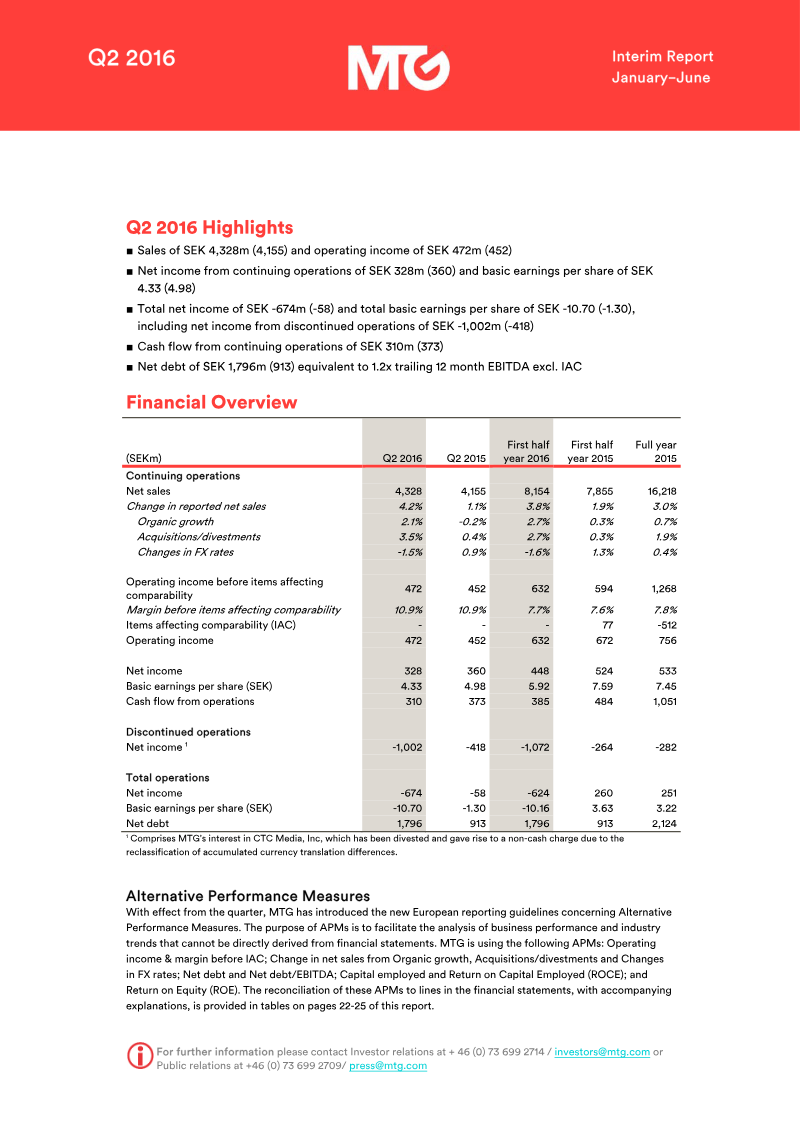
Modern Times Group achieved a period of profitable growth during the second quarter of 2016, reporting net sales of SEK 4,328 million and operating income of SEK 472 million.
- MTG reported Q2 2016 net sales of SEK 4,328 million and operating income of SEK 472 million, driven by a 2.5-fold increase in digital sales.
- The company is aggressively expanding into esports through the launch of a 24/7 channel and the establishment of industry organizations like WESA.
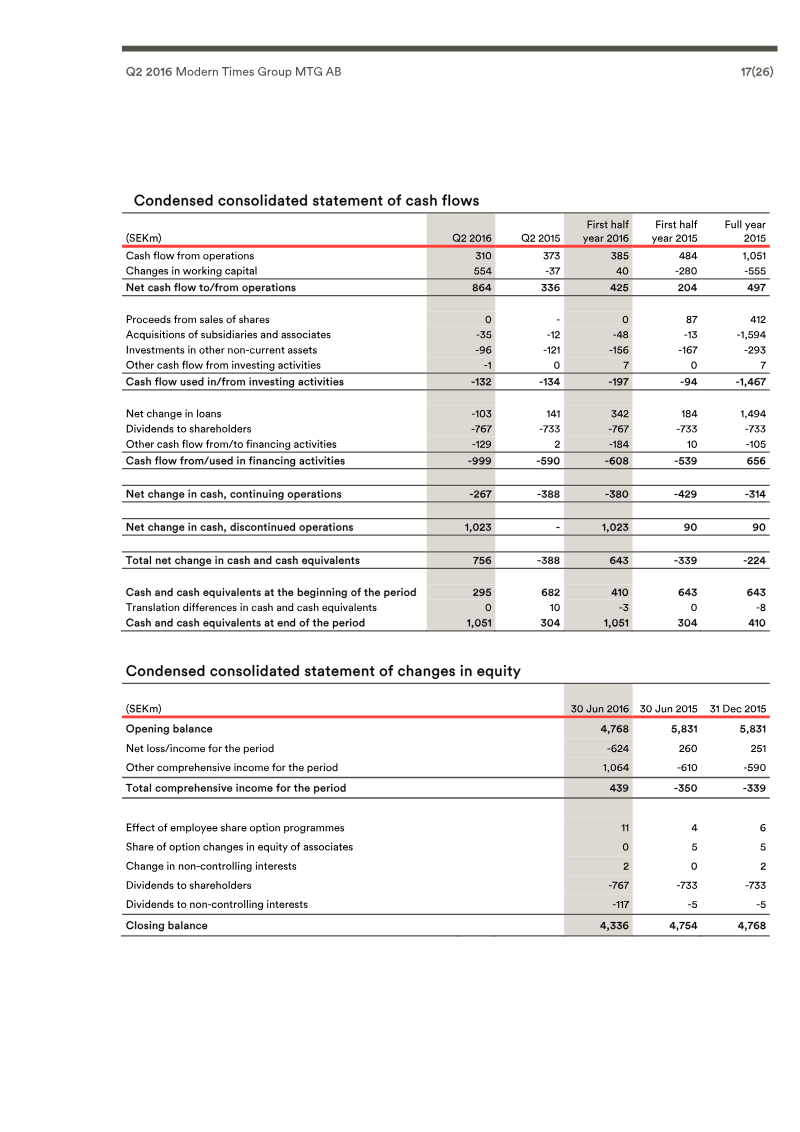
- The net debt-to-EBITDA ratio increased to 1.2 from 0.6 in the prior year, reflecting the capital-intensive nature of the group's digital transformation and expansion strategy.
Programa AEVI Forum 2015
The retrieved content is a download page on the Spanish Video Game Association (AEVI) website for the "Programa AEVI Forum 2015," a file created on 9 October 2015 and last updated on 13 October 2025.
- The AEVI Forum 2015 program document is a restricted file requiring user authentication to access its specific contents.
- The file was originally created on October 9, 2015, and received a system update on October 13, 2025.
- The document is a 655.55 KB file hosted within the digital archive of the Asociación Española de Videojuegos (AEVI).


Nippon Ichi Software: 22nd Business Report (Fiscal Year Ending March 2015)
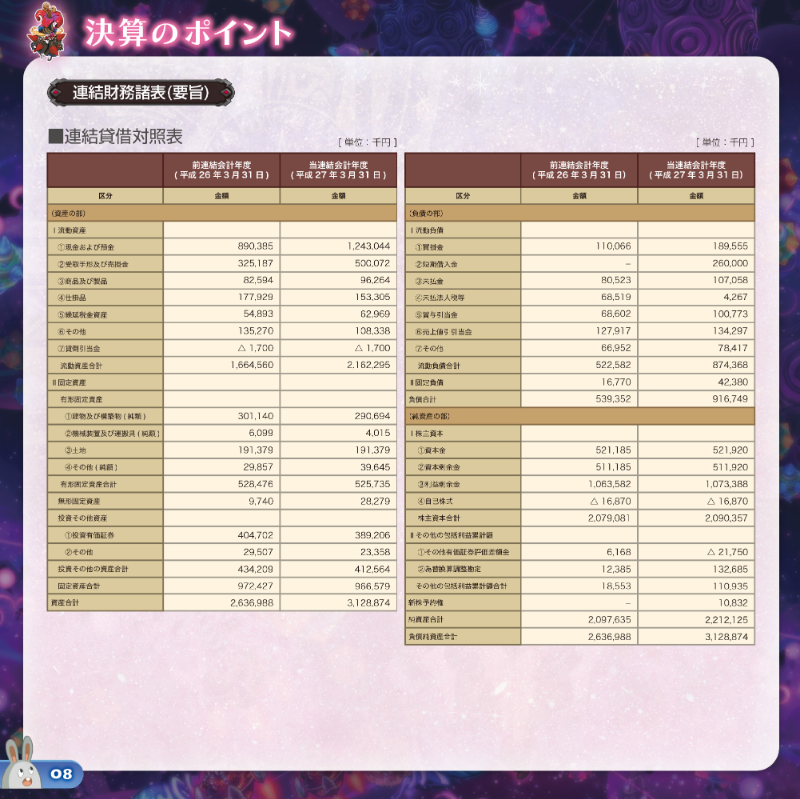
The 22nd Business Report for Nippon Ichi Software, covering the fiscal year ending March 31, 2015, outlines the company’s strategic shift toward cultivating new intellectual property (IP) and expanding its global footprint.
- Nippon Ichi Software reported net sales of approximately 3.67 billion yen for the fiscal year ending March 31, 2015.
- Profitability declined significantly compared to the previous year, with operating profit falling to 139 million yen and net profit to approximately 20 million yen.
- The company launched the 'NEW BRAND' initiative to address a lack of flagship titles, releasing three new games: Harem Tengoku da to Omottara Yandere Jigoku datta, htoL#NiQ, and Oedo Blacksmith.

Koei Tecmo Holdings Annual Report 2015
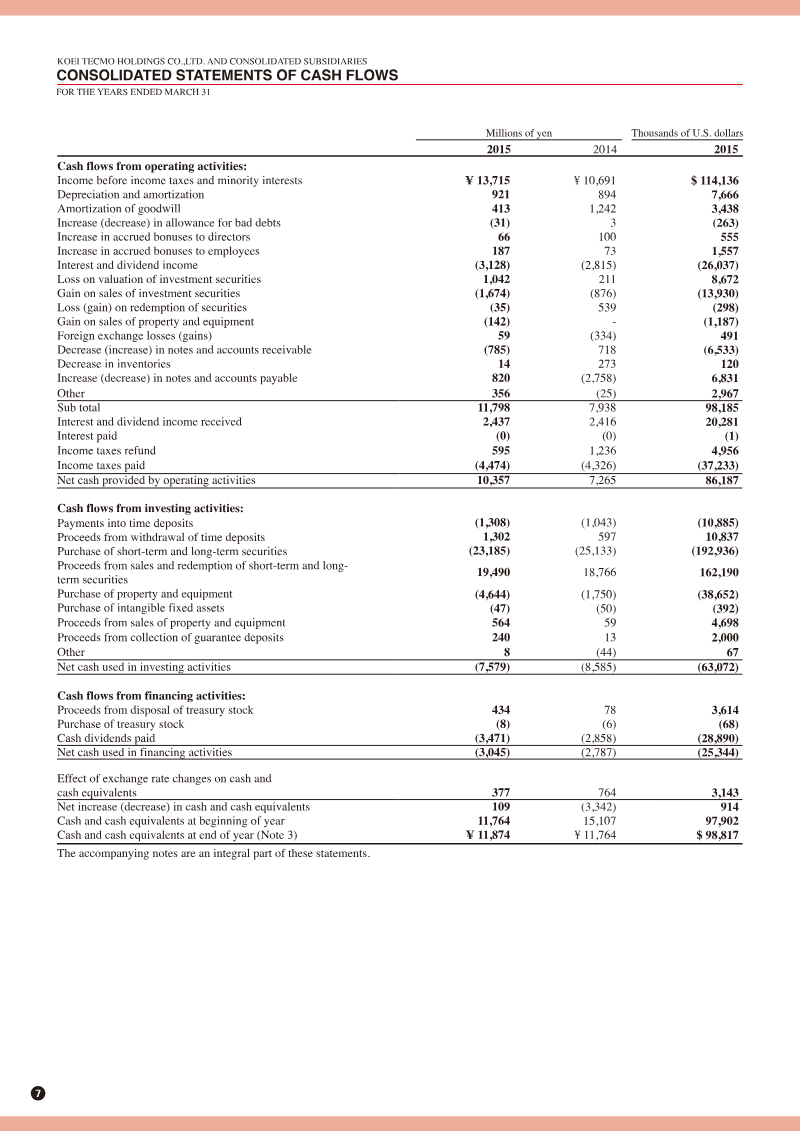
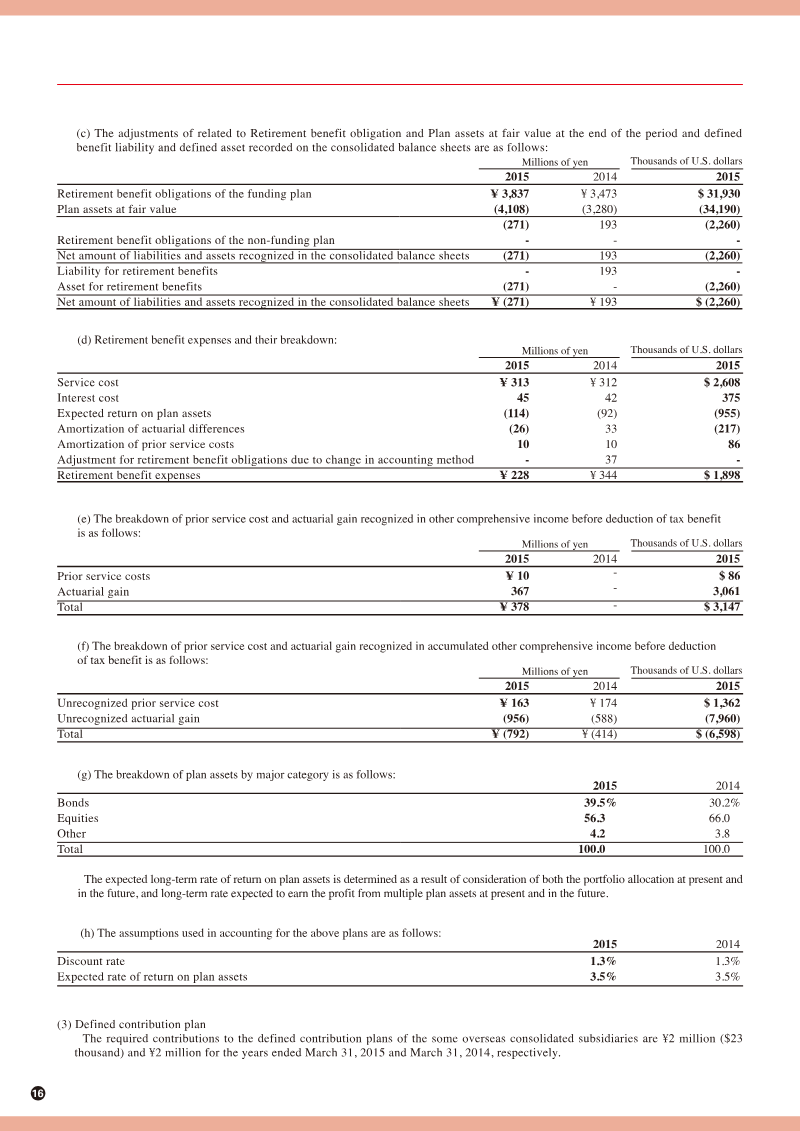
Koei Tecmo Holdings achieved record-breaking financial performance during the 2015 fiscal year, marking a fifth consecutive year of profit growth and a second consecutive year of rising sales.
- Koei Tecmo achieved record financial performance in fiscal year 2015, marking five consecutive years of profit growth and two years of rising sales.
- Consolidated net sales reached ¥37.799 billion, with the Game Software division generating ¥9.942 billion in segment income.
- The company maintains a strong balance sheet with ¥64.7 billion in marketable securities and ¥11.05 billion in investment properties as of March 31, 2015.

Koei Tecmo Holdings Annual Report 2016
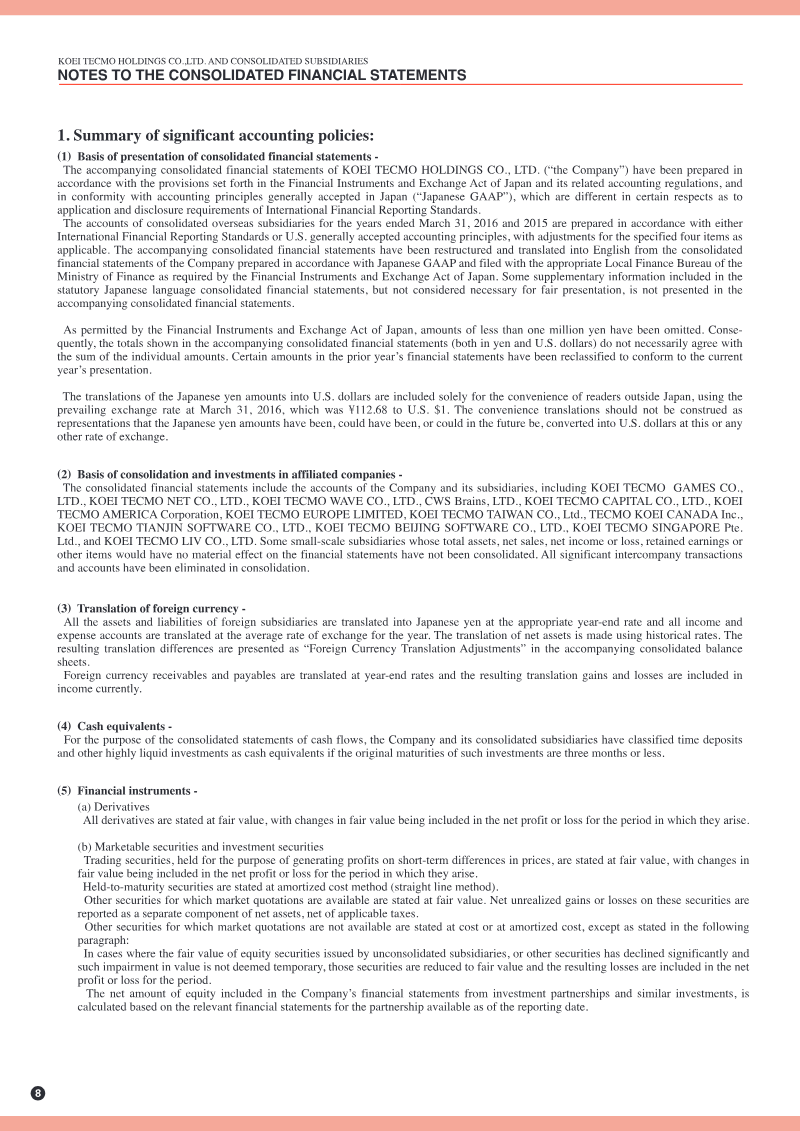
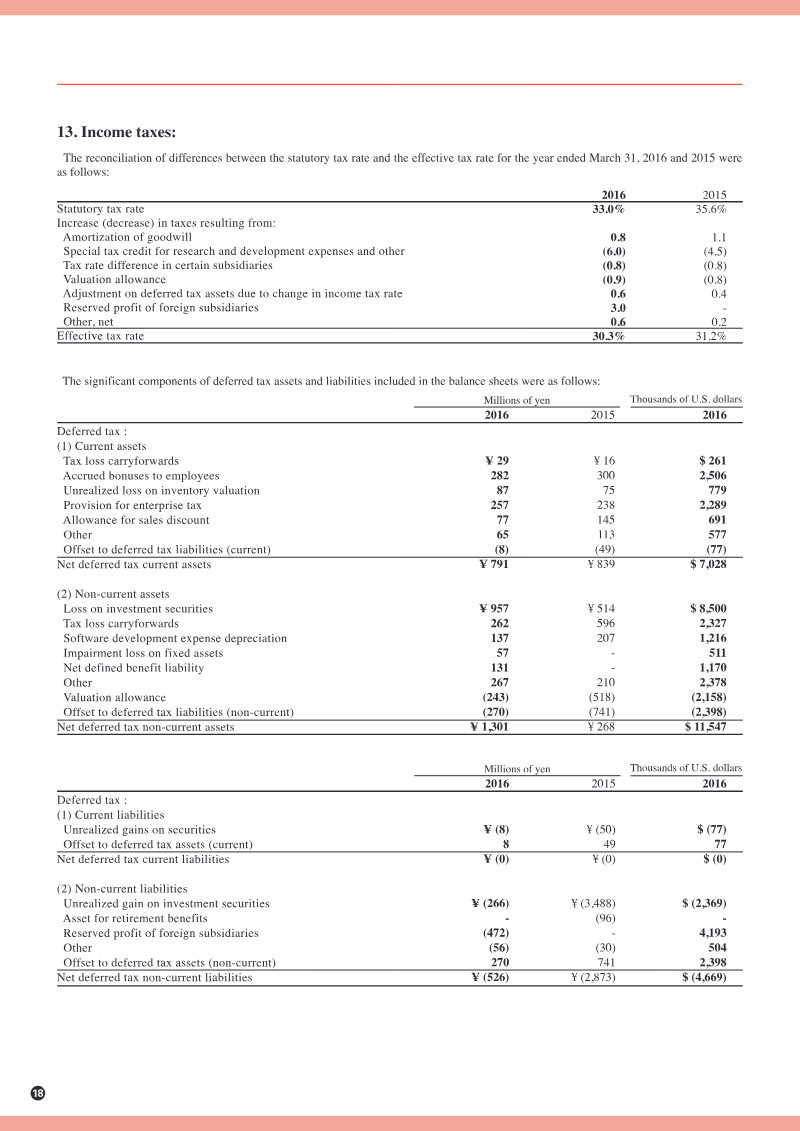
Koei Tecmo Holdings achieved record-breaking financial performance during the 2016 fiscal year, marking a sustained period of growth characterized by three consecutive years of rising sales and six consecutive years of profit expansion.
- Koei Tecmo achieved record financial performance in fiscal year 2016, marking three consecutive years of sales growth and six consecutive years of profit expansion.
- Consolidated net sales reached ¥38.3 billion, supported by a strong asset base that includes ¥59.8 billion in marketable securities.
- Growth was primarily driven by the Game Software segment, with a strategic focus on mobile and online platforms and the development of high-profile titles like Nioh.

Sega Sammy 2014 Interim Report
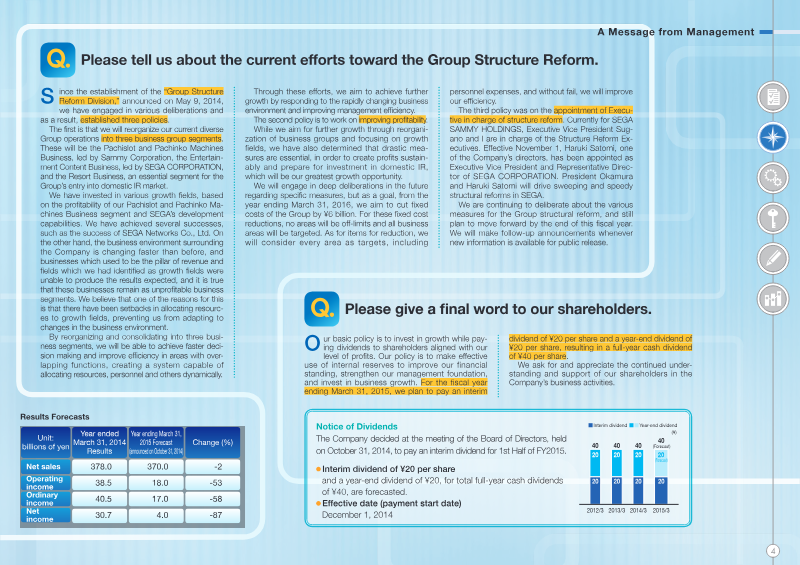
Sega Sammy experienced a period of significant financial contraction during the first half of fiscal year 2015, characterized by a 5% decline in net sales to ¥154.2 billion and a 72% collapse in operating income to ¥3.4 billion.
- Sega Sammy reported a 5% decline in net sales to ¥154.2 billion and a 72% collapse in operating income to ¥3.4 billion for the first half of fiscal year 2015, resulting in a net loss of ¥2.0 billion.
- The financial downturn was primarily caused by regulatory changes in pachislot model testing and reduced demand for packaged software and traditional toys.
- The company is implementing a restructuring plan to reduce fixed costs by ¥6 billion by fiscal year 2016 and has reorganized into a three-segment business structure.

Business Report: Summer 2015
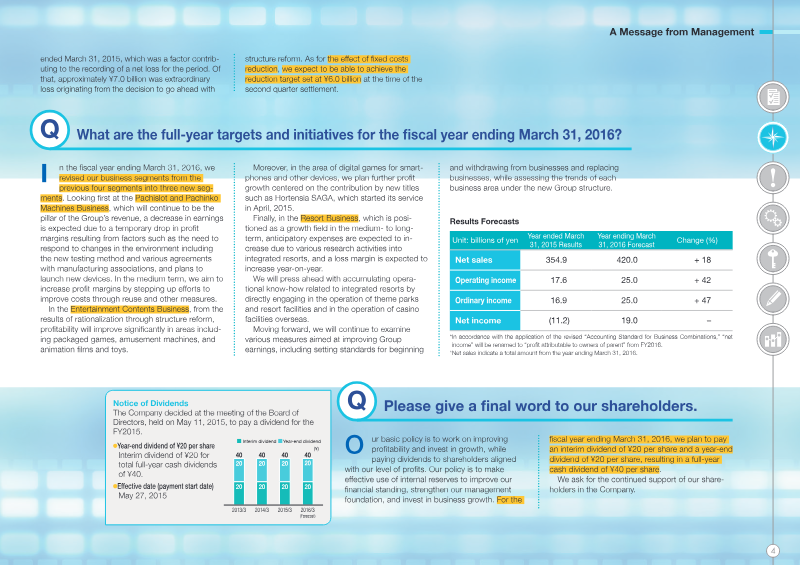
SEGA SAMMY faced a period of significant financial contraction during the fiscal year ending March 31, 2015, recording a net loss of ¥11.2 billion alongside a 6% decline in net sales to ¥354.9 billion.
- SEGA SAMMY reported a net loss of ¥11.2 billion and a 6% decline in net sales to ¥354.9 billion for the fiscal year ending March 31, 2015.
- Management forecasts a return to profitability for the fiscal year ending March 31, 2016, projecting ¥420 billion in net sales and ¥19 billion in net income.
- The company implemented a major restructuring that consolidated operations into entertainment, digital games, and resorts, aiming for ¥6 billion in fixed cost savings through personnel reductions.
Sega Sammy Fiscal 2017 Business Report
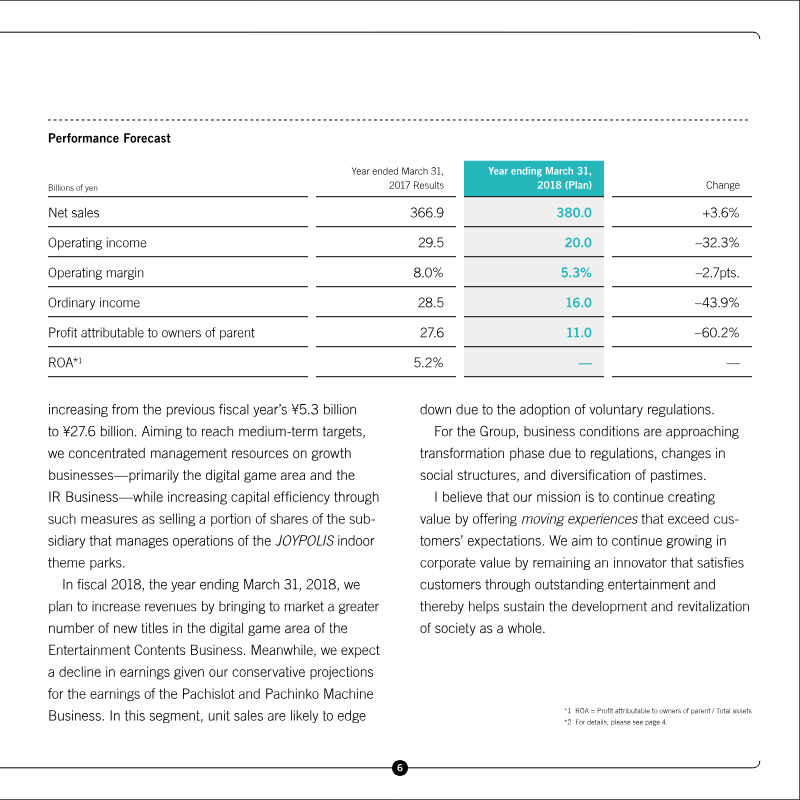
The Sega Sammy Holdings fiscal 2017 business report outlines the company’s financial performance for the period ending March 31, 2017, and details its strategic "Road to 2020" initiative.
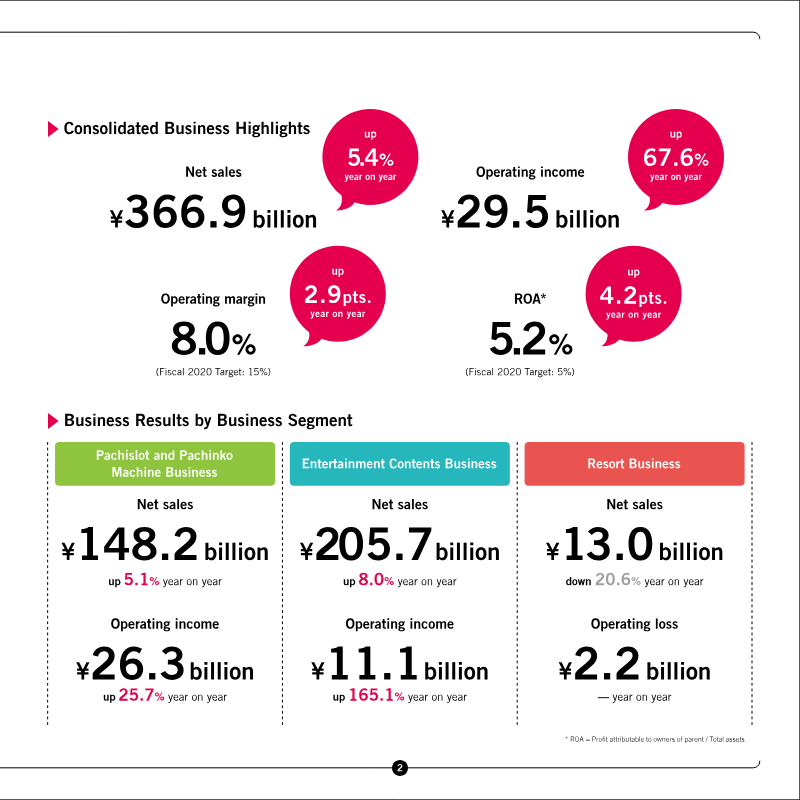
- Sega Sammy achieved consolidated net sales of ¥366.9 billion in fiscal 2017, representing a 5.4% year-on-year increase, while operating income grew 67.6% to ¥29.5 billion.
- The Entertainment Contents segment generated ¥205.7 billion in sales, significantly aided by the global success of Persona 5, which exceeded 1.5 million units sold.
- The Pachislot and Pachinko Machine business contributed ¥148.2 billion in sales, supported by the performance of titles like Pachislot Hokuto No Ken Syura no kuni hen.
Tencent 2015 Annual Report
Tencent’s 2015 annual performance reflects a period of robust financial expansion and strategic consolidation within the Chinese technology sector.
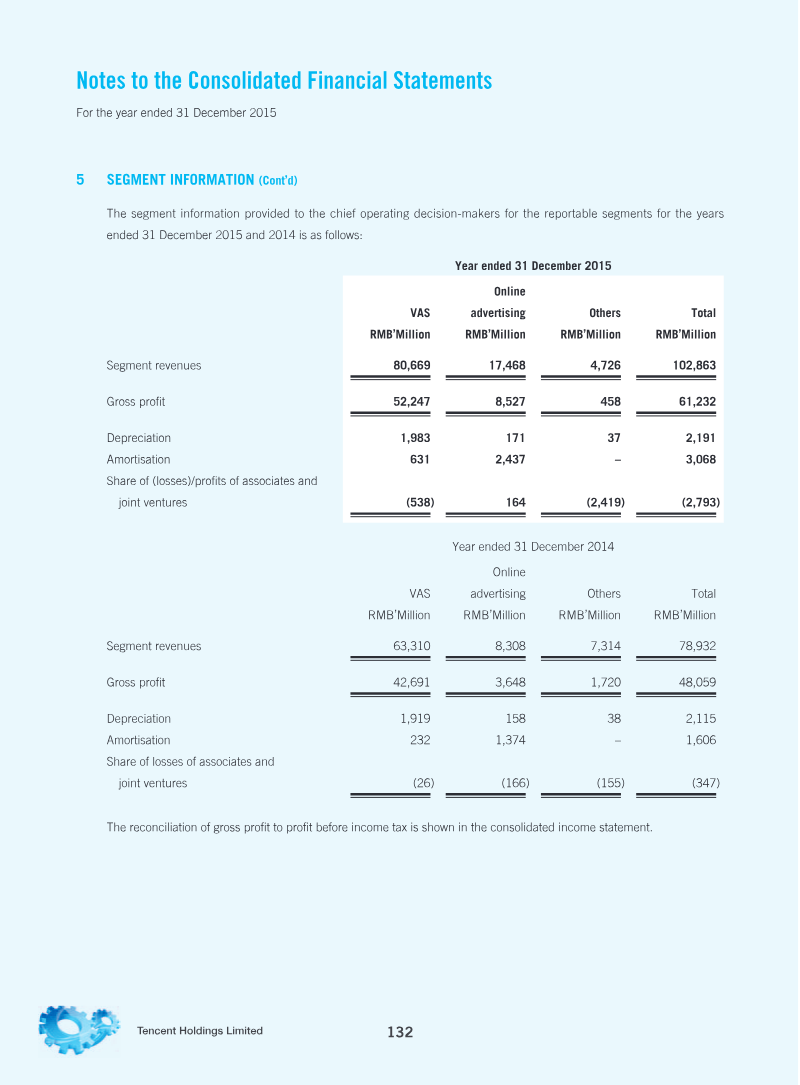
- Tencent achieved a 30% increase in total annual revenue to RMB 102.9 billion and a 21% rise in profit to RMB 28.8 billion in 2015.
- Growth was driven by a 39% increase in combined Weixin and WeChat monthly active users, a 26% rise in online game revenue, and a 110% surge in online advertising.
- The company utilized 'Structure Contracts' to consolidate domestic operating companies in restricted sectors like telecommunications and gaming, while acknowledging inherent regulatory and tax risks.



Q3 2015 Data Digest
This Q3 2015 data digest provides an analysis of the iOS app market, focusing on downloads, revenue, top publishers, and advertising insights.
- Gaming remains the dominant App Store category, generating over 20 times the revenue of the next leading category.
- Clash of Clans maintained its lead in Q3 2015, though Game of War significantly narrowed the revenue gap in the U.S. market.
- Aggressive advertising on the Facebook network, particularly using high-production image and video assets, shows a strong correlation with increased revenue for gaming and lifestyle apps like those from ContextLogic.

The eSports Economy: Trends, Audience and Revenue Growth Towards 2017
This document, "The eSports Economy: Trends, Audience and Revenue Growth Towards 2017," analyzes the burgeoning eSports market, detailing its audience demographics, revenue streams, and growth projections.
- The eSports enthusiast base is projected to exceed 100 million by 2017, maintaining a 20% compound annual growth rate between 2012 and 2017.
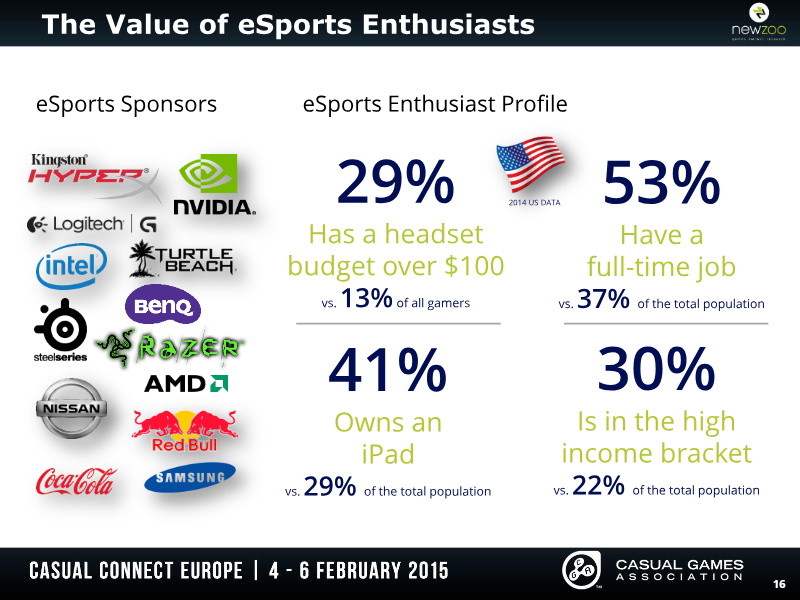
- Approximately 40% of eSports viewers are spectators who do not actively play the games they watch, indicating a shift toward viewing as a standalone entertainment medium.
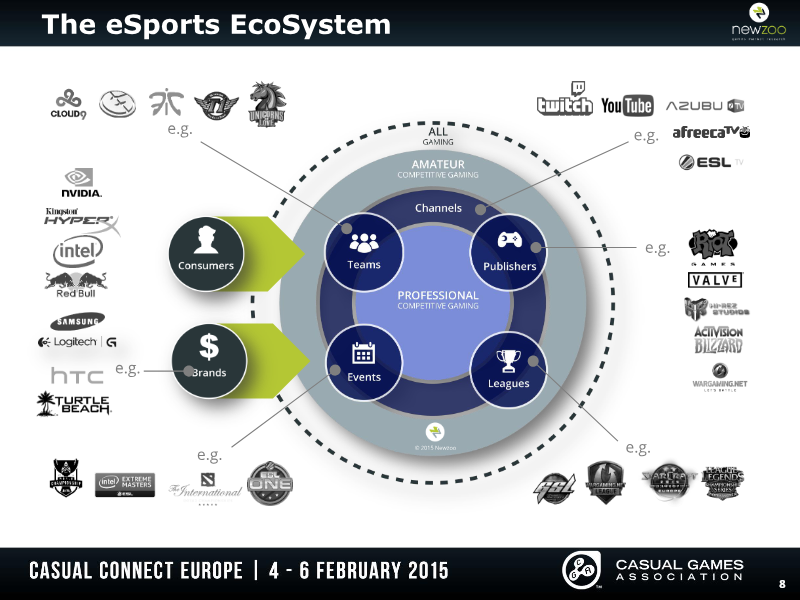
- Streaming platforms are central to the industry's infrastructure, exemplified by Twitch reaching 100 million unique monthly viewers in 2014.

The Consumer as Producer: How Games & Video Converge to Drive Growth
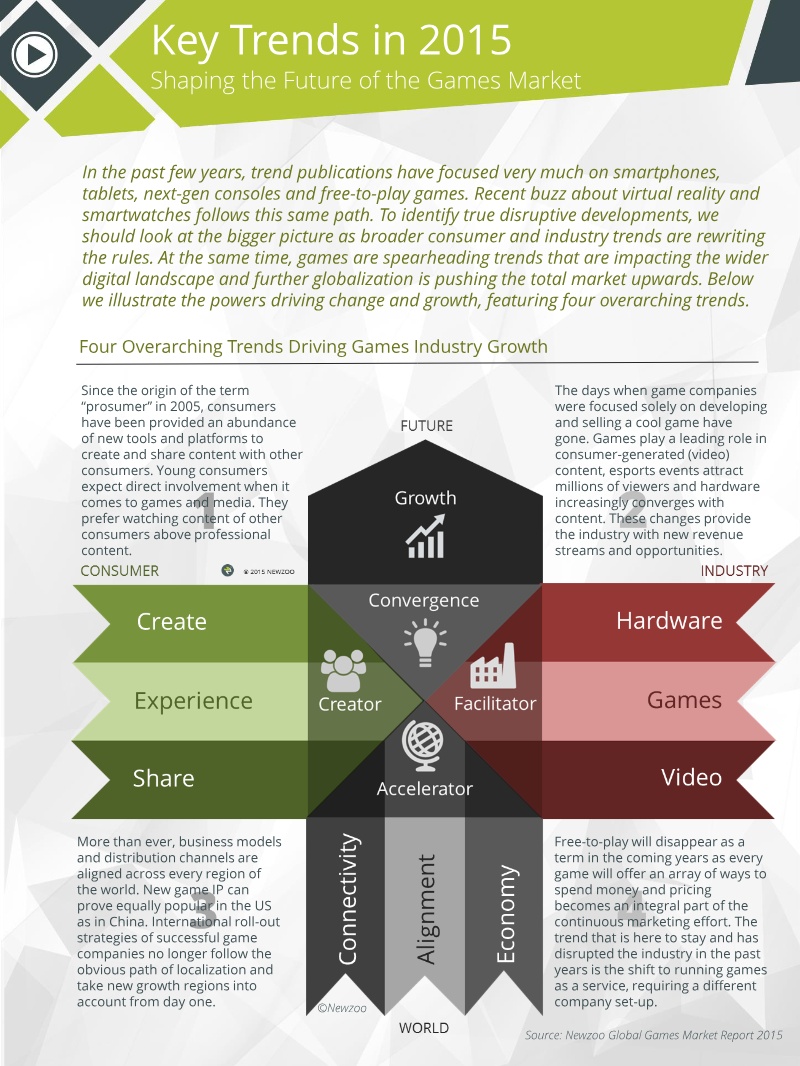
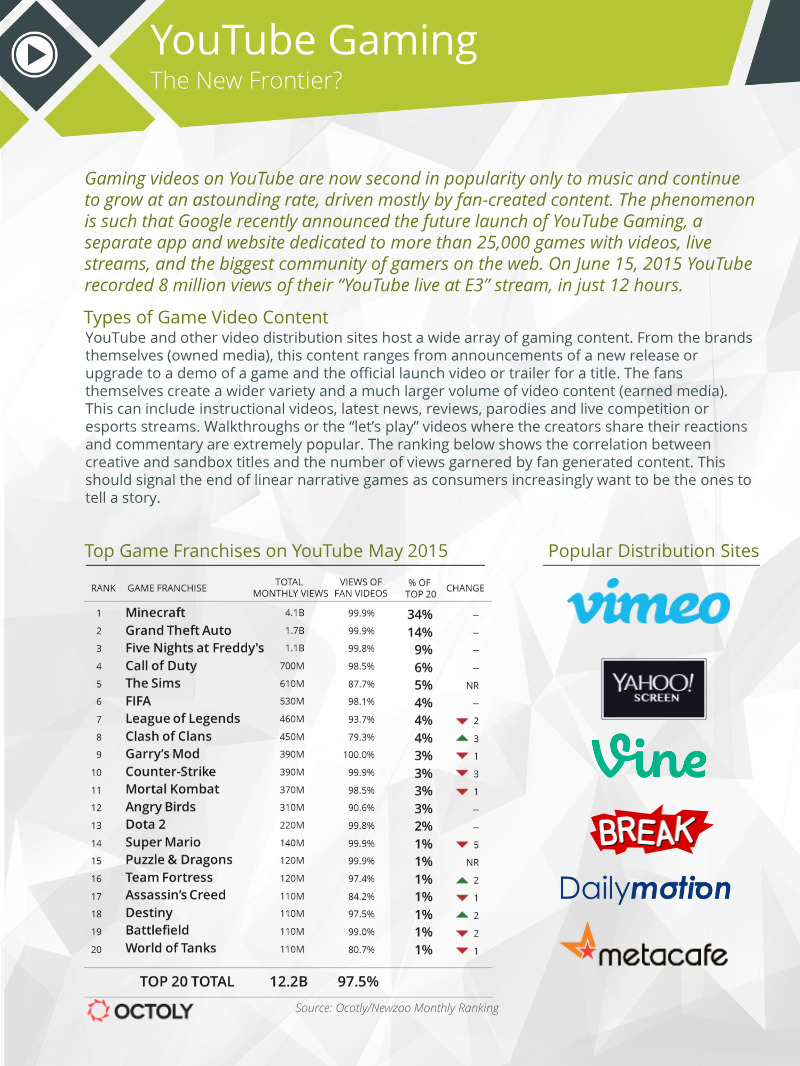
The document, "The Consumer as Producer: How Games & Video Converge to Drive Growth," analyzes the evolving relationship between consumers and content creation within the global games market, emphasizing the accelerating trend of consumer involvement in creating, streaming, and sharing gaming video content.
- The gaming industry is shifting from a one-way consumption model to a collaborative ecosystem where players act as 'prosumers' who create, share, and monetize content.
- Global games revenue is projected to reach $113.3 billion by 2018, growing at a compound annual rate of 7.9% from 2014.
- China and the United States will dominate the market, collectively accounting for 50% of global gaming revenues by 2018.