2015
Company
Documents about 2015
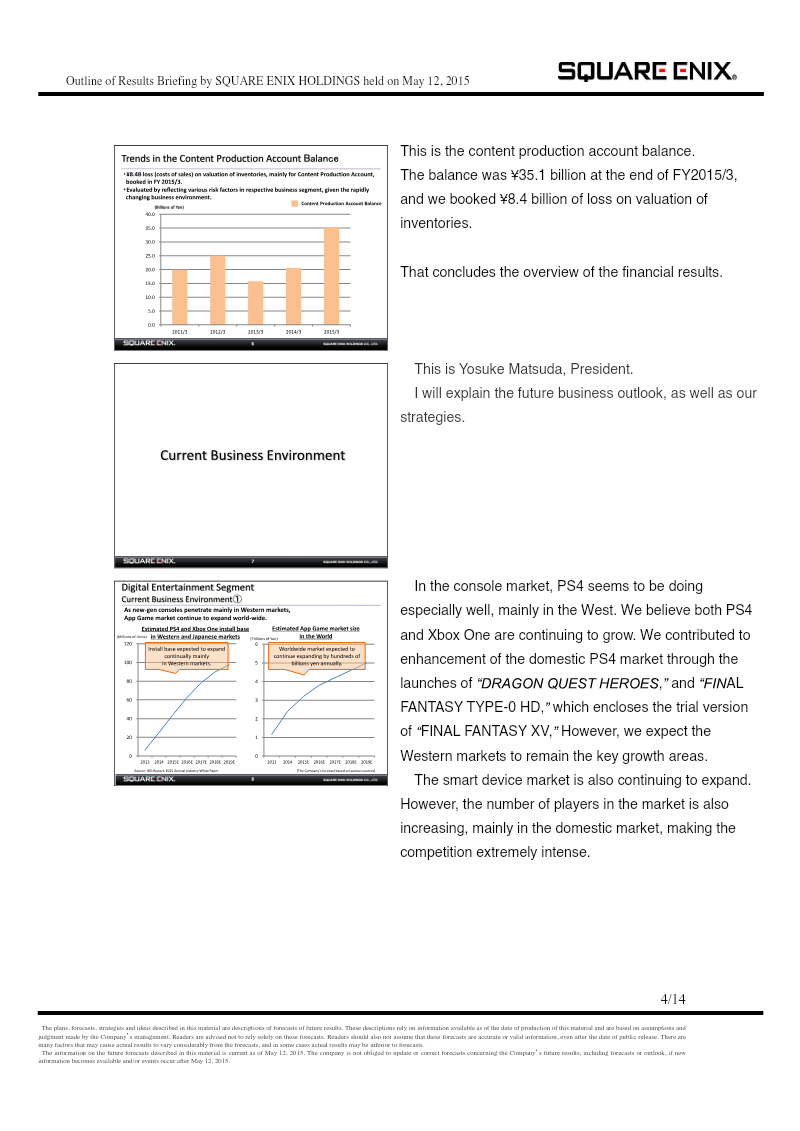
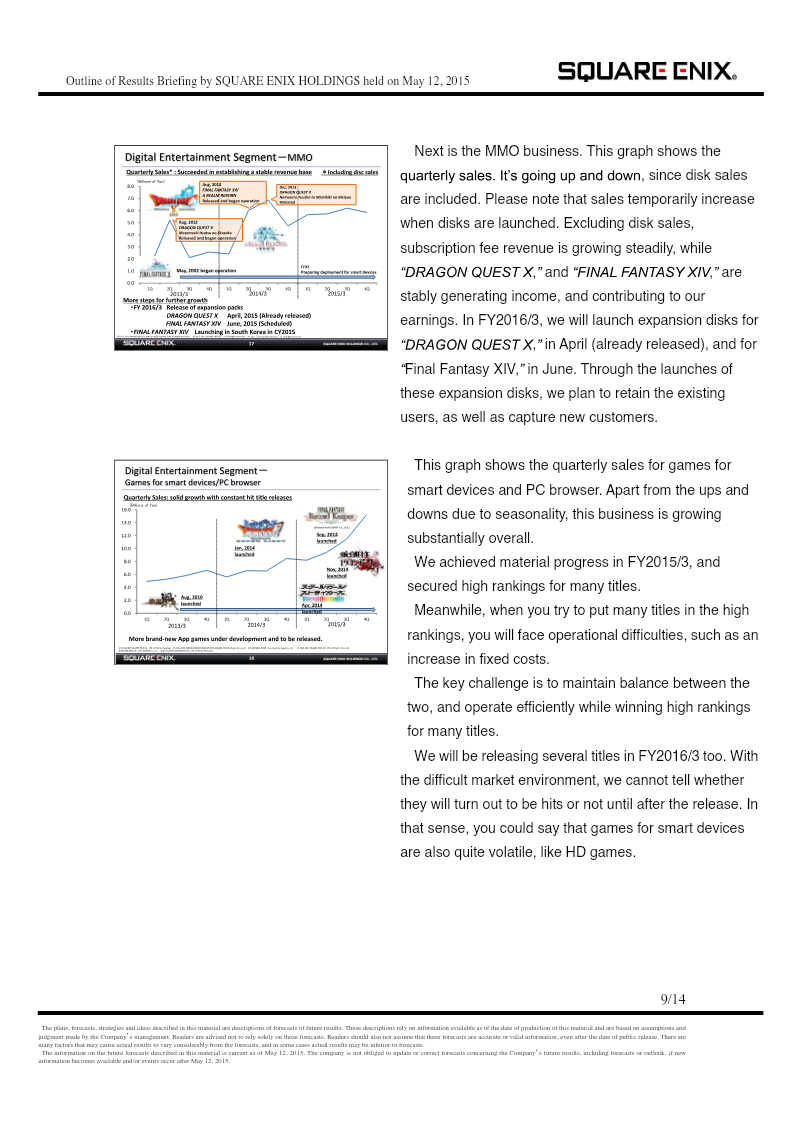
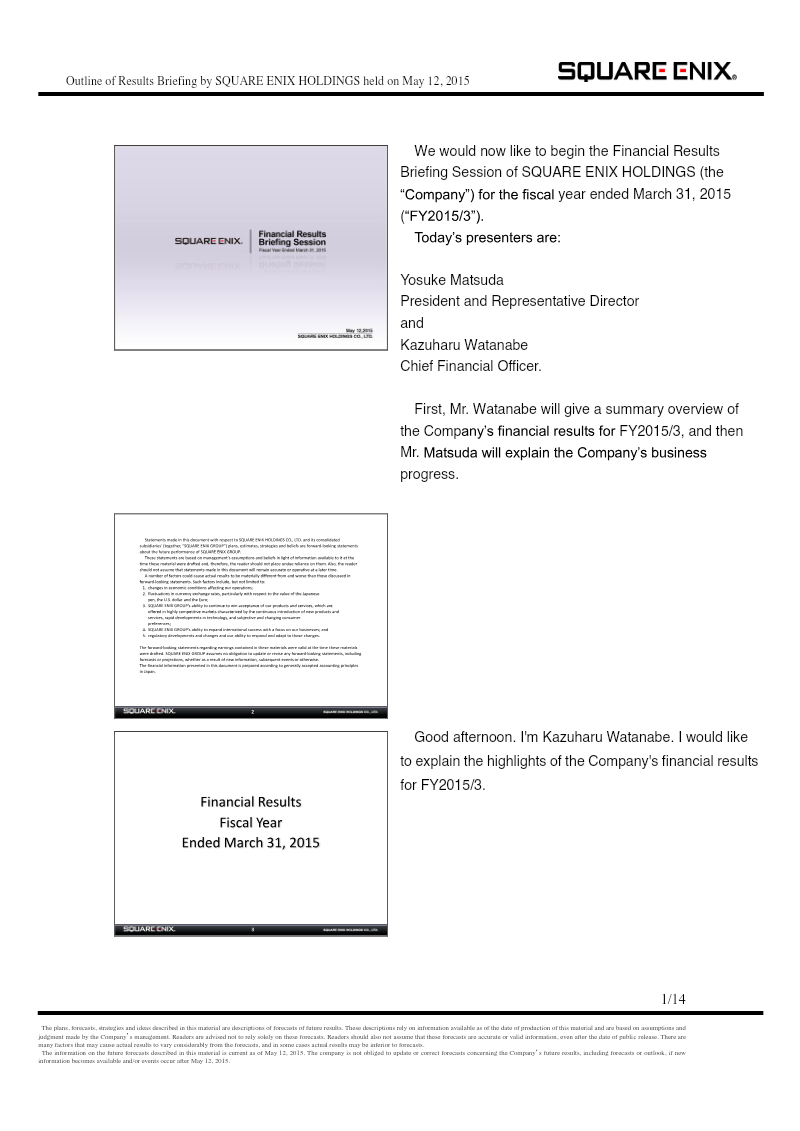
Square Enix Holdings Financial Results Briefing: FY2015/3
Square Enix achieved significant financial growth during the 2015 fiscal year, characterized by an 8.3 percent increase in net sales to 167.9 billion yen and a substantial 55.8 percent rise in operating income to 16.4 billion yen.
- Square Enix reported strong FY2015/3 growth with net sales rising 8.3% to 167.9 billion yen and operating income surging 55.8% to 16.4 billion yen.
- Management projects FY2016 net sales of 200–220 billion yen and operating income of 17–25 billion yen, aiming to surpass the 200 billion yen revenue milestone for the first time.
- Financial performance was driven by mid-sized console titles, sustained profitability in massively multiplayer online games, and growth in the smart device segment.
Marvelous Inc. Fourth Quarter Financial Results: Fiscal Year Ended March 31, 2015
Marvelous Inc. reported strong financial growth for the fiscal year ending March 31, 2015, driven by its multi-content and multi-device strategy within the global entertainment sector.
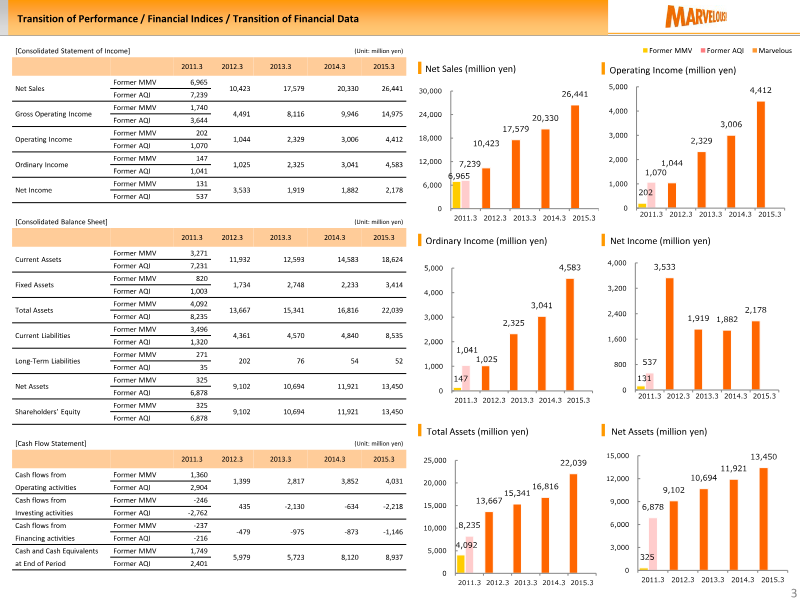
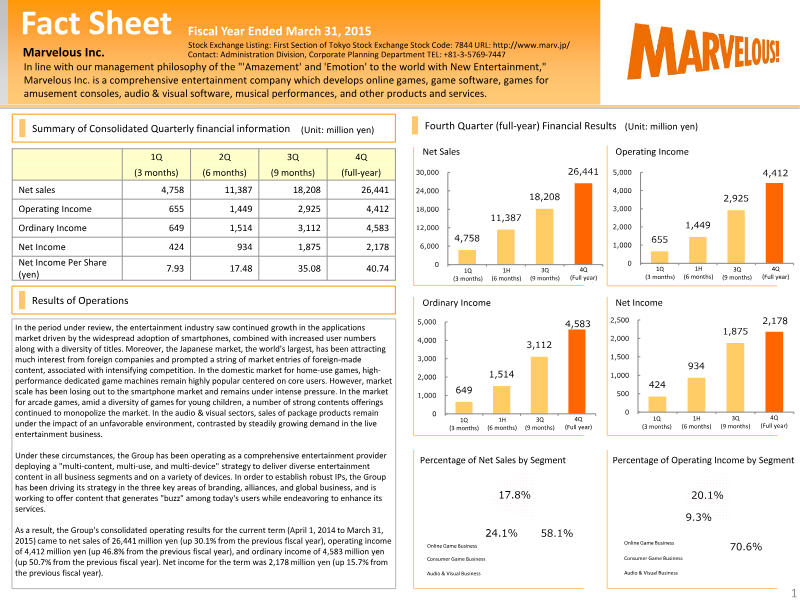
- Marvelous Inc. posted consolidated net sales of 26,441 million yen for the fiscal year ended March 31, 2015, up 30.1% year over year, driven by its multi-content, multi-device strategy.
- Profit growth outpaced sales: operating income rose 46.8% to 4,412 million yen and ordinary income rose 50.7% to 4,583 million yen.
- Net income grew only 15.7% to 2,178 million yen, well below operating and ordinary income growth, partly reflecting asset impairment losses tied to delayed performance of specific arcade titles.

Marvelous Financial Results: Fiscal Year Ended March 31, 2015
Marvelous Inc. reported strong financial growth for the fiscal year ended March 31, 2015, driven primarily by the expansion of its online game business.
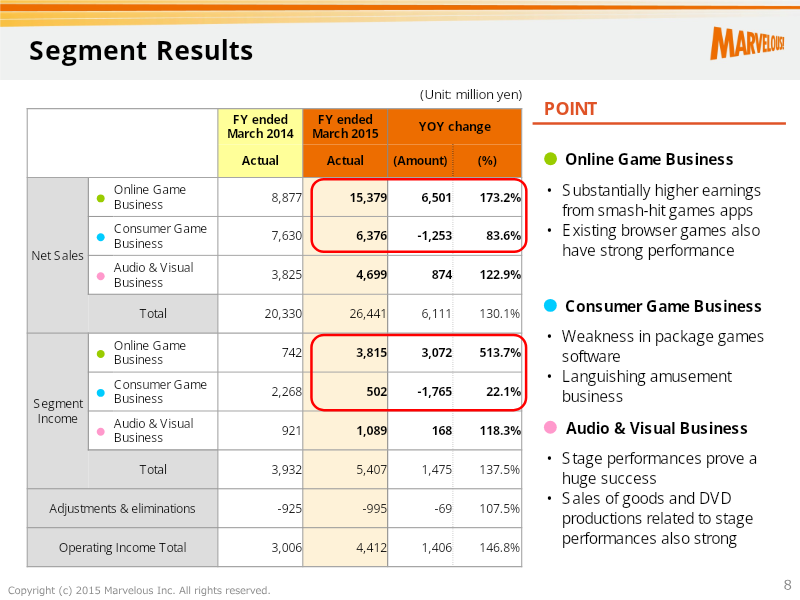
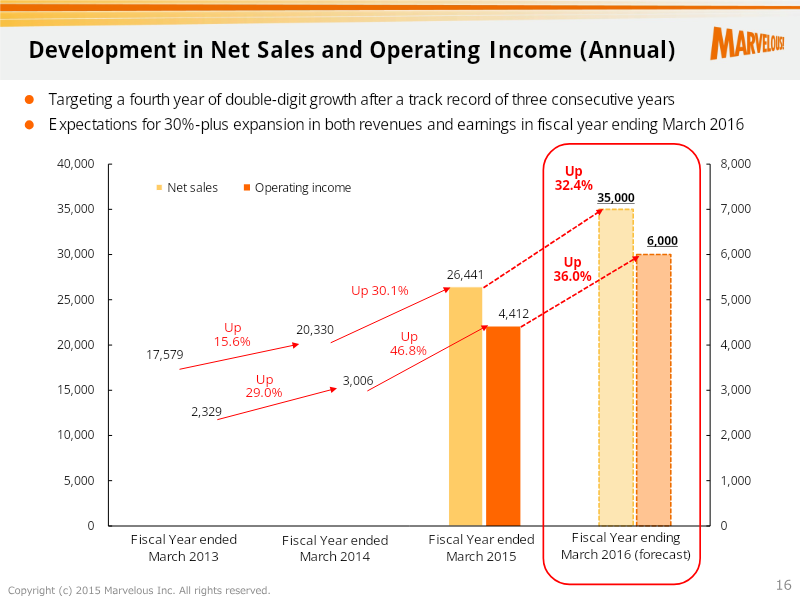
- Marvelous Inc. grew net sales 30.1% to 26,441 million yen in the fiscal year ended March 31, 2015, while operating income rose 46.8% to 4,412 million yen.
- The online game business was the main earnings driver, with sales up 173.2% year-on-year, led by the native app Logres of Swords and Sorcery: Goddess of Ancient.
- Logres of Swords and Sorcery: Goddess of Ancient passed 6 million cumulative downloads and held a top position in app store rankings throughout the year.
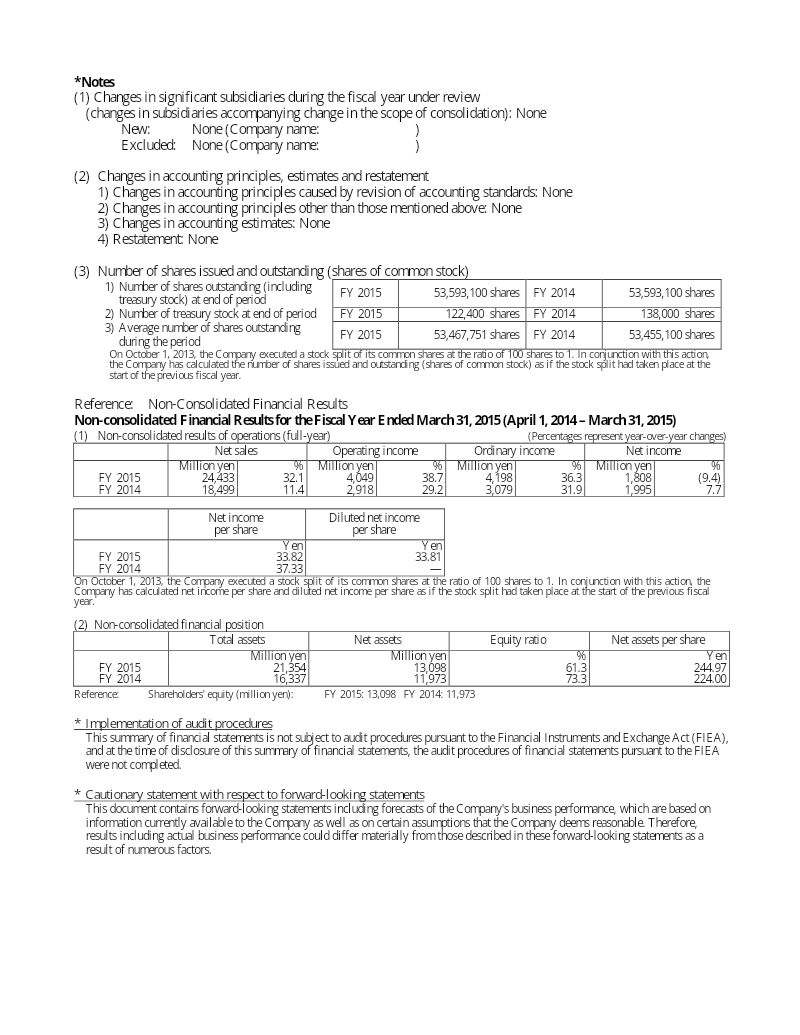
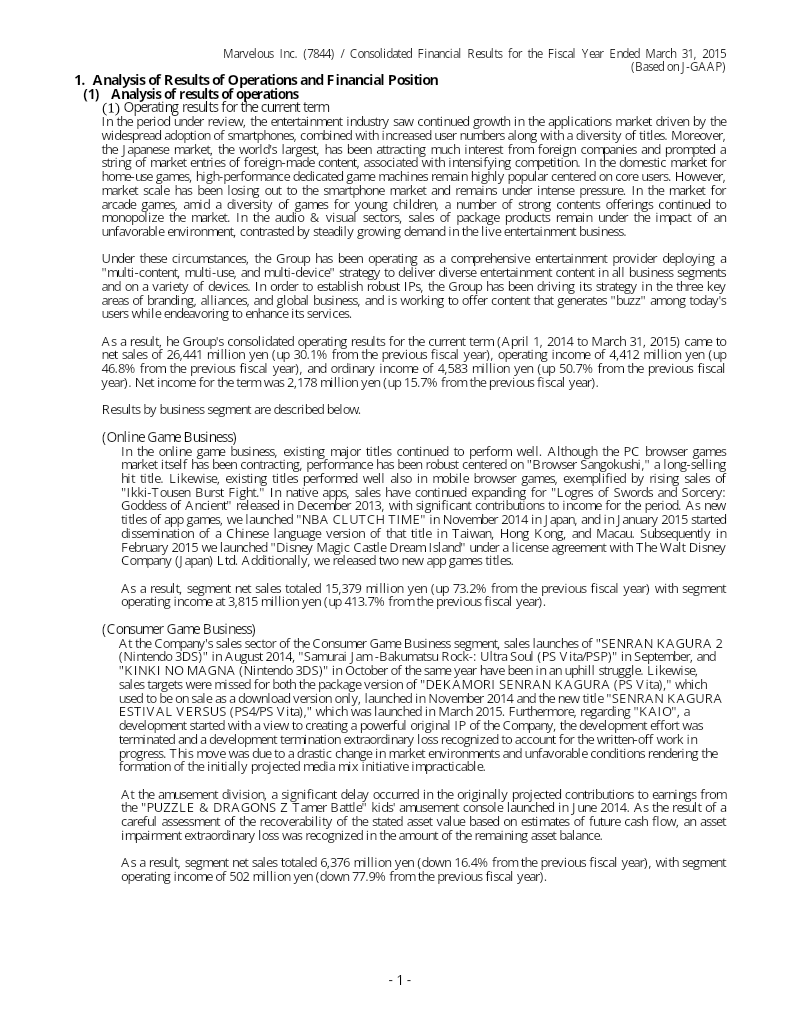
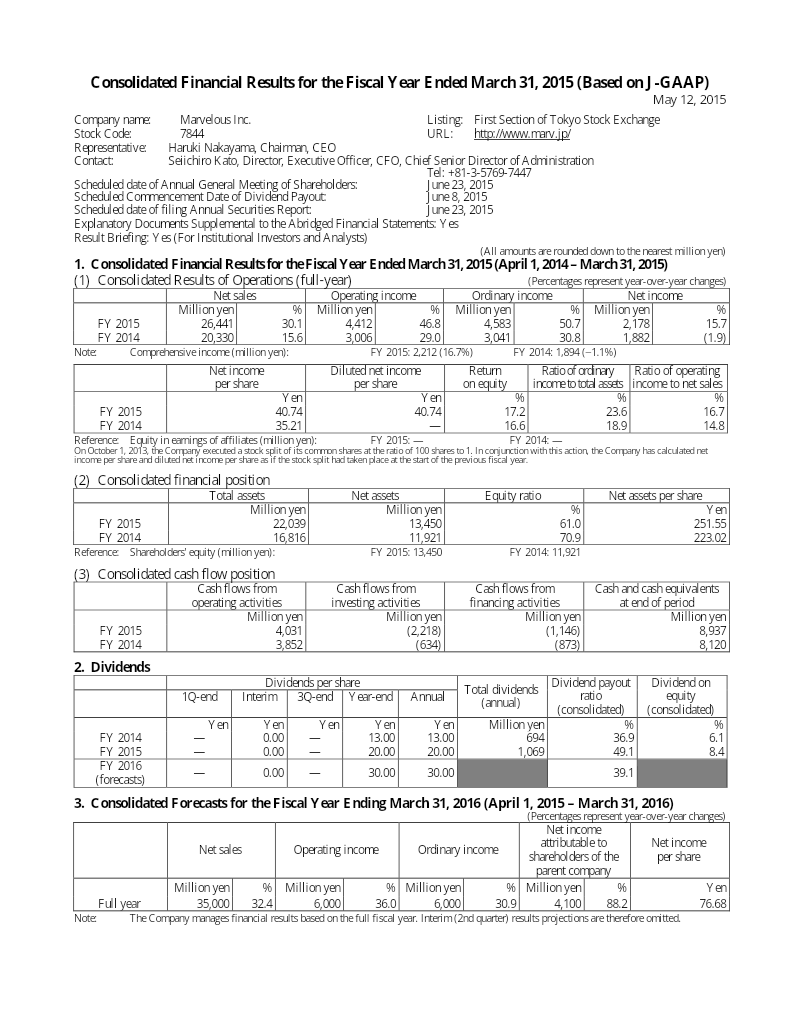
Marvelous Consolidated Financial Results: Fiscal Year Ended March 31, 2015
Marvelous Inc. reported strong consolidated financial results for the fiscal year ended March 31, 2015, characterized by significant growth in net sales and operating income.
- Marvelous Inc. achieved significant fiscal growth for the year ended March 31, 2015, with net sales rising 30.1% to 26,441 million yen and operating income increasing 46.8% to 4,412 million yen.
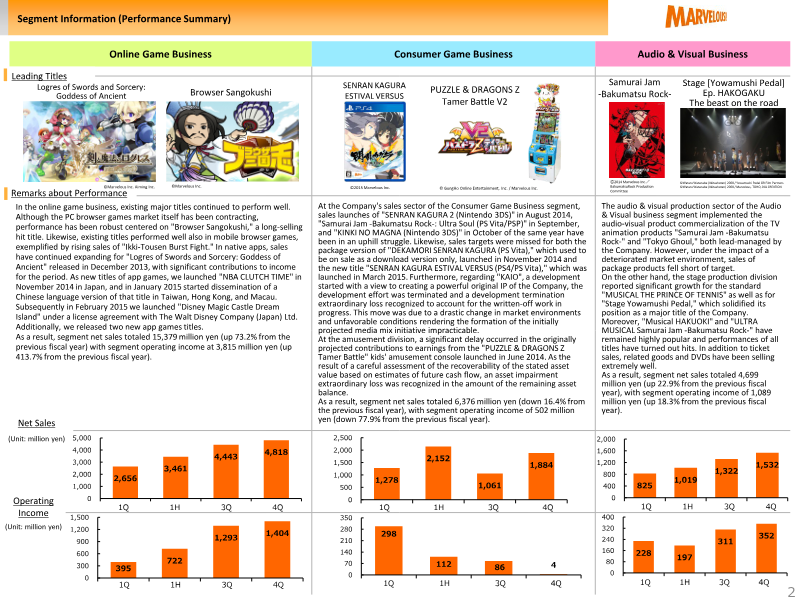
- The Online Game Business was the primary growth driver, reporting a 73.2% increase in net sales and a 413.7% surge in operating income due to strong browser and native app game performance.
- The Consumer Game Business underperformed, with net sales falling 16.4% and operating income dropping 77.9% following missed sales targets and the termination of a major development project.
Take-Two Interactive Form 10-K: FY2015
Take-Two Interactive’s fiscal year 2015 report details a business model defined by high-quality, internally owned intellectual property and a strategic pivot toward digital distribution.
- Digital revenue grew significantly to 42.0% of total net revenue in fiscal year 2015, up from 15.8% in the prior year.
- Recurrent consumer spending, including microtransactions and add-on content, accounted for 49.4% of digital online revenue in fiscal 2015, an increase from 40.4% in 2014.
- Grand Theft Auto products remained a critical revenue driver, contributing approximately 28.0% of the company's total net revenue for the fiscal year ended March 31, 2015.



Aiming Q1 2015 Quarterly Securities Report
The Aiming Inc. Quarterly Securities Report for the first quarter of 2015 covers the period from January 1, 2015, to March 31, 2015.
- Aiming Inc. reported strong Q1 2015 financial results with net sales of 3,243 million yen, operating profit of 1,260 million yen, and a net profit of 811 million yen.
- The success was primarily driven by "Sword and Magic Logres: Ancient Goddesses," which achieved 6 million cumulative downloads by mid-April 2015, supported by TV advertising and in-game events.
- Aiming Inc. completed its initial public offering on the Tokyo Stock Exchange Mothers market in March 2015.
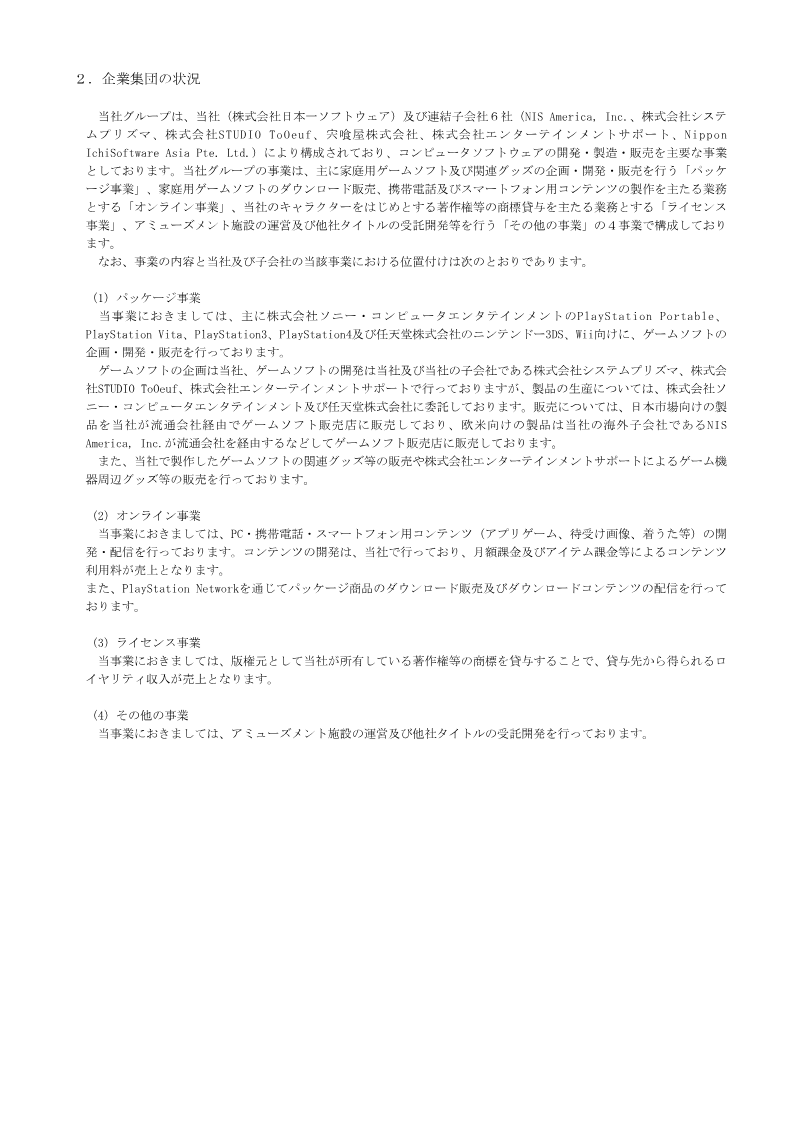
Nippon Ichi Software Financial Results: Fiscal Year Ended March 2015
Nippon Ichi Software’s financial results for the fiscal year ended March 31, 2015, reflect a period of stagnant revenue growth and a significant contraction in profitability.
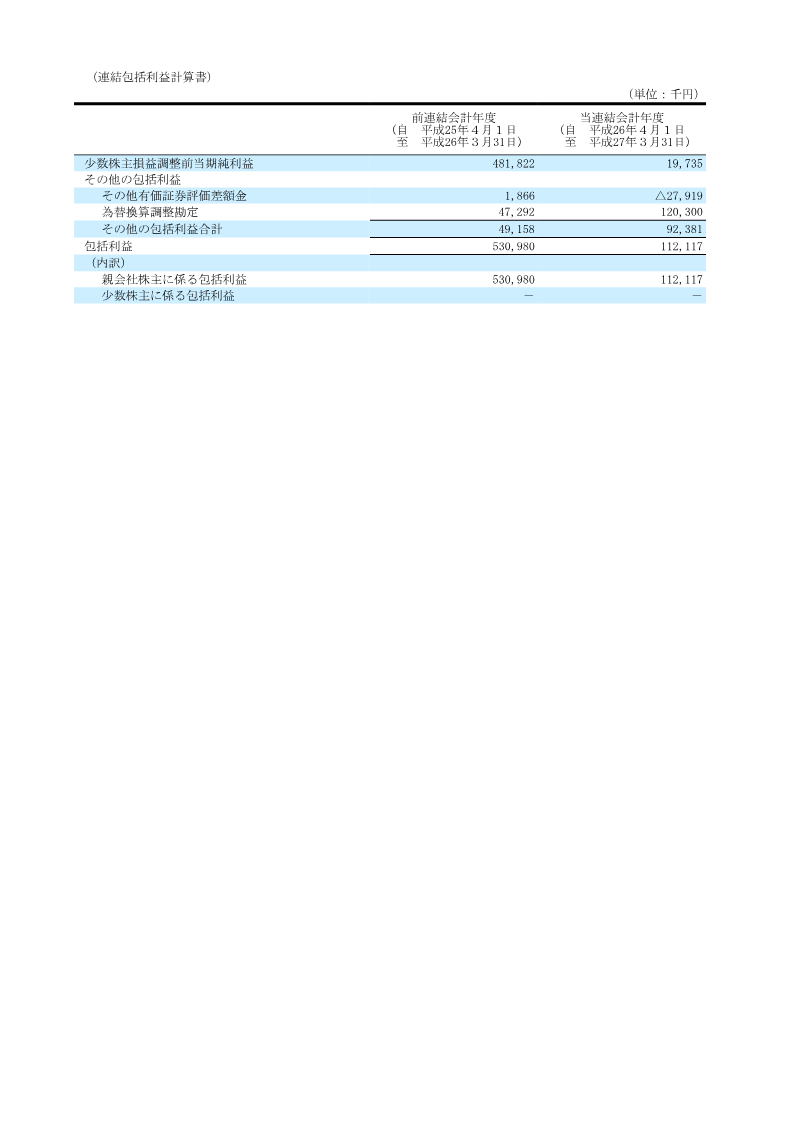
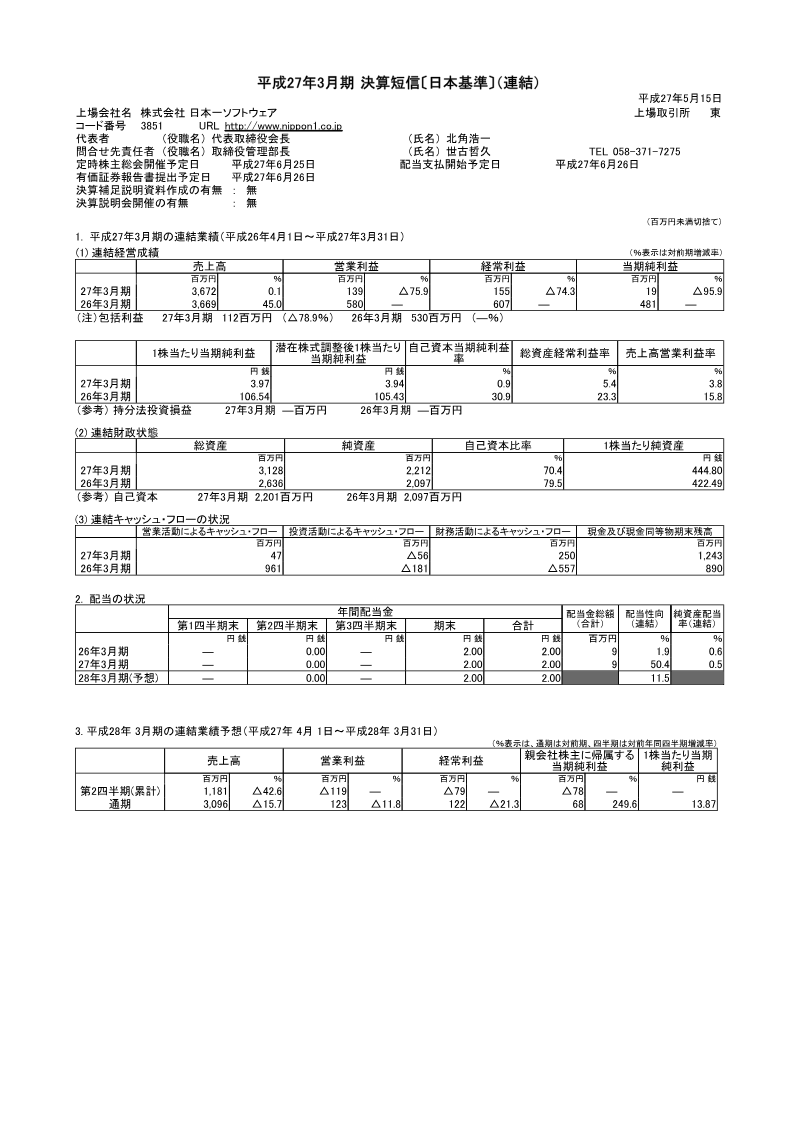
- Nippon Ichi Software experienced a sharp decline in profitability for the fiscal year ended March 31, 2015, with operating profit falling 75.9% to 139 million yen and net income dropping 95.9% to 19.7 million yen.
- Consolidated net sales remained stagnant at 3.67 billion yen, reflecting only a 0.1% increase compared to the previous fiscal year.
- The core Package business segment, which released 19 global titles, recorded an operating loss of 81.3 million yen.
Condensed Interim Consolidated Financial Statement: CD PROJEKT Capital Group Q1 2015
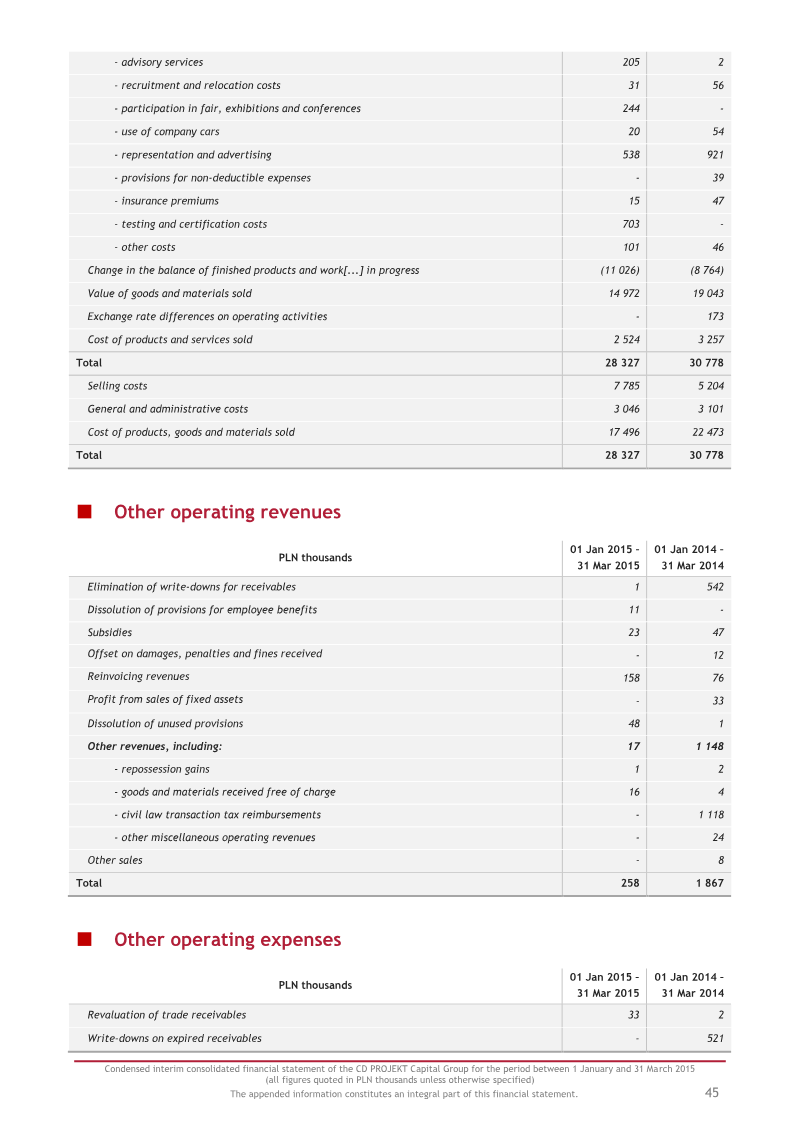
The CD PROJEKT Capital Group’s financial performance for the first quarter of 2015 reflects a period of significant investment and transition, characterized by a net loss of 5.2 million PLN.
- CD PROJEKT Capital Group reported a net loss of 5.2 million PLN for Q1 2015, a decline from the 1.5 million PLN profit recorded in Q1 2014.
- The quarterly loss was primarily driven by heavy development expenditures for 'The Witcher 3: Wild Hunt', with the videogame development segment alone incurring a loss of 4.88 million PLN.
- The GOG.com digital distribution platform remained profitable during the quarter, contributing 0.66 million PLN in earnings.
NEXON Q1 2015 Earnings Call
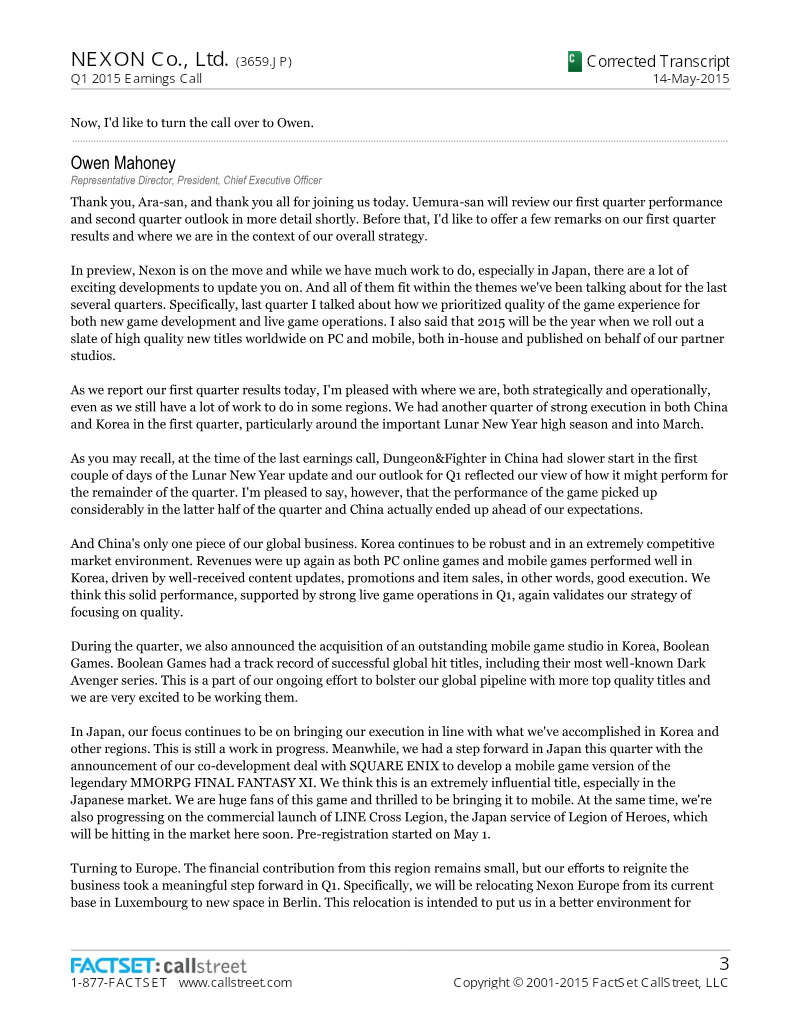
Nexon achieved a strong financial performance in the first quarter of 2015, generating ¥52.0 billion in revenue and ¥22.2 billion in operating income.
- Nexon reported strong Q1 2015 financial results with ¥52.0 billion in revenue and ¥22.2 billion in operating income, exceeding initial projections.
- Growth was primarily driven by high user engagement in the Chinese and Korean markets, supported by a strategic shift toward a mobile-centric development model.
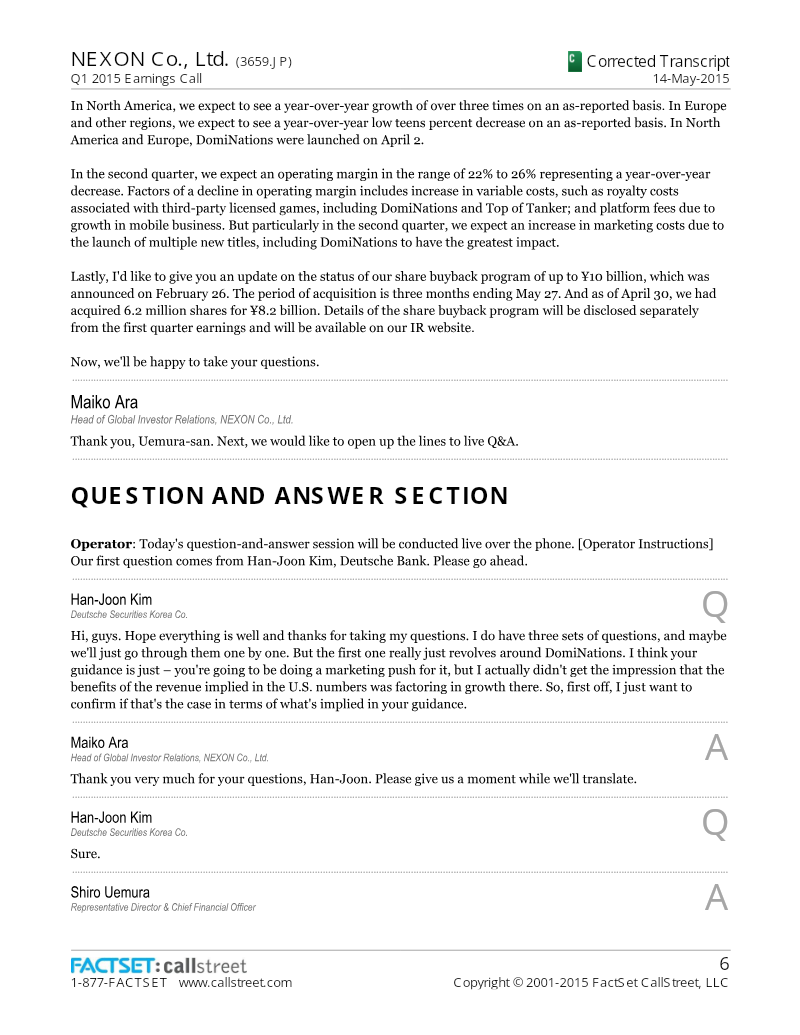
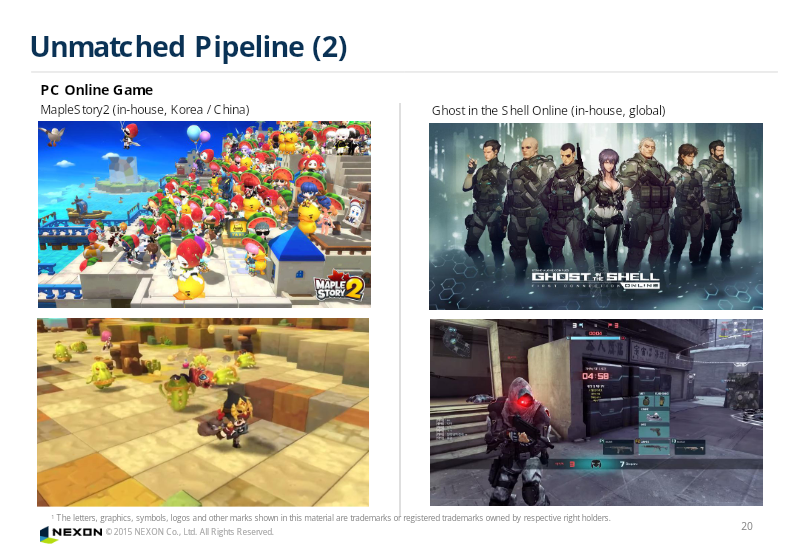
- The company is prioritizing long-term mobile growth through sustained marketing for the title DomiNations and the upcoming releases of MapleStory2 and Durango.
NEXON Consolidated Financial Results: Three Months Ended March 31, 2015
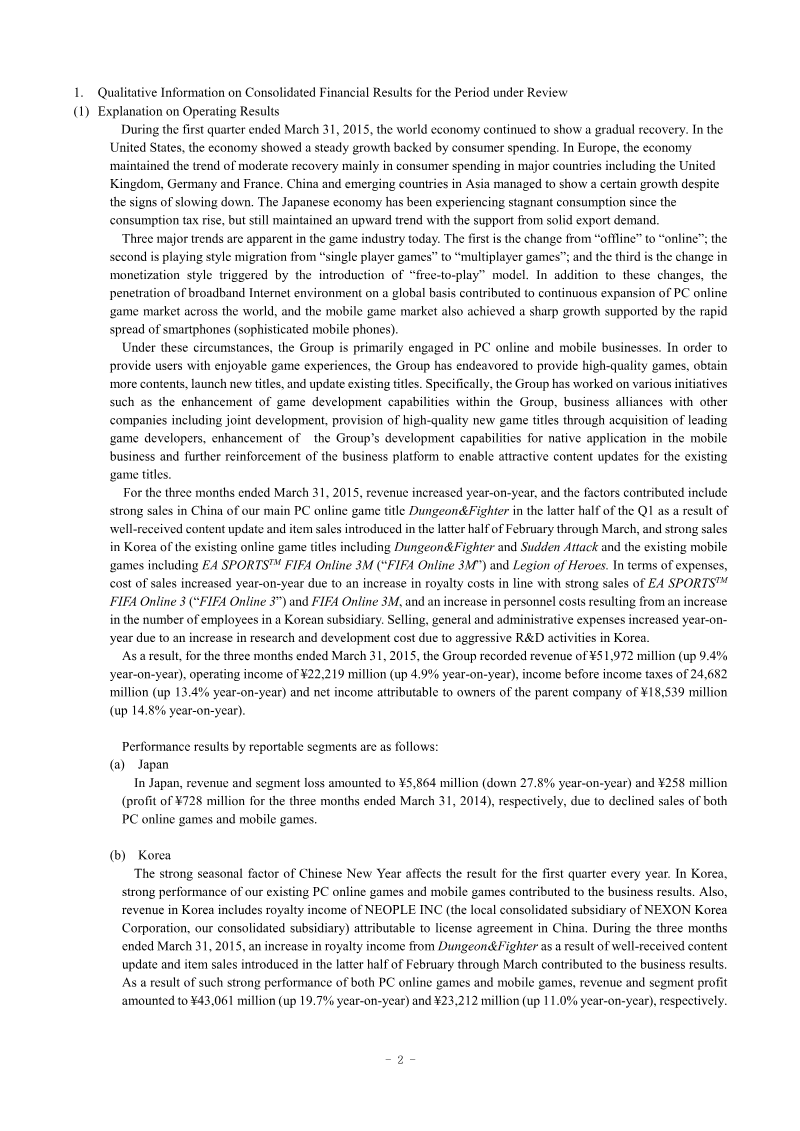
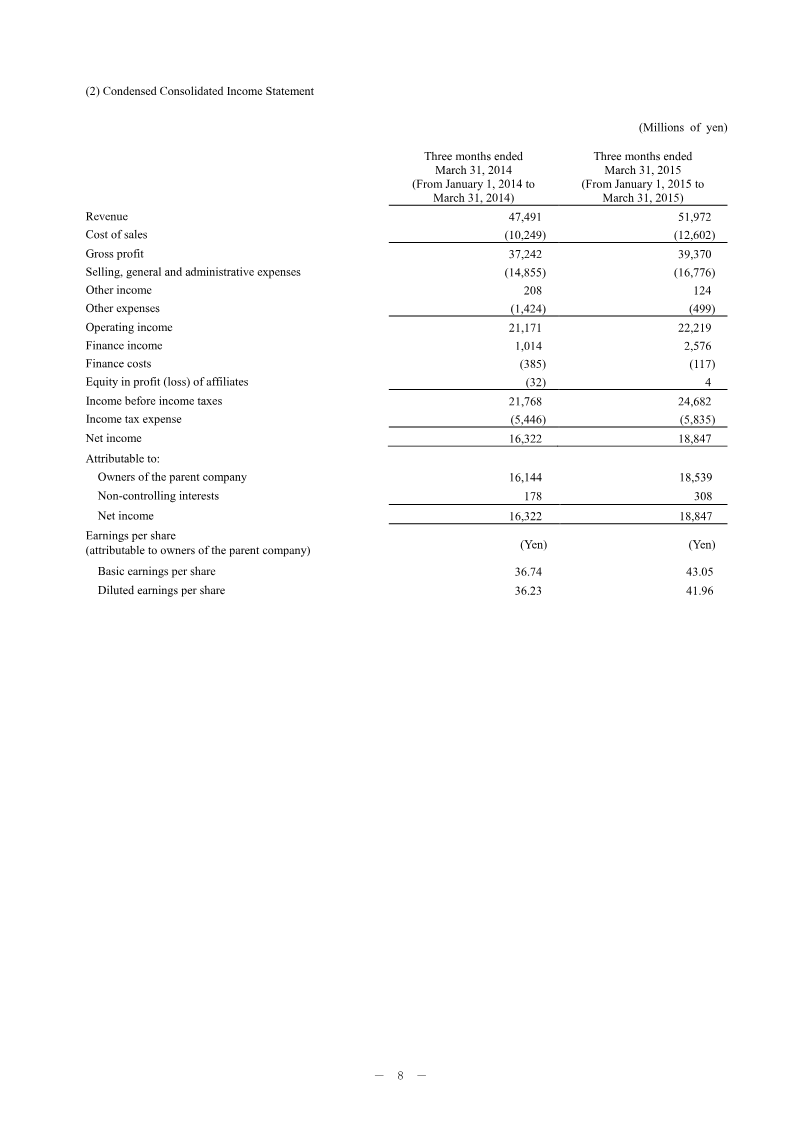
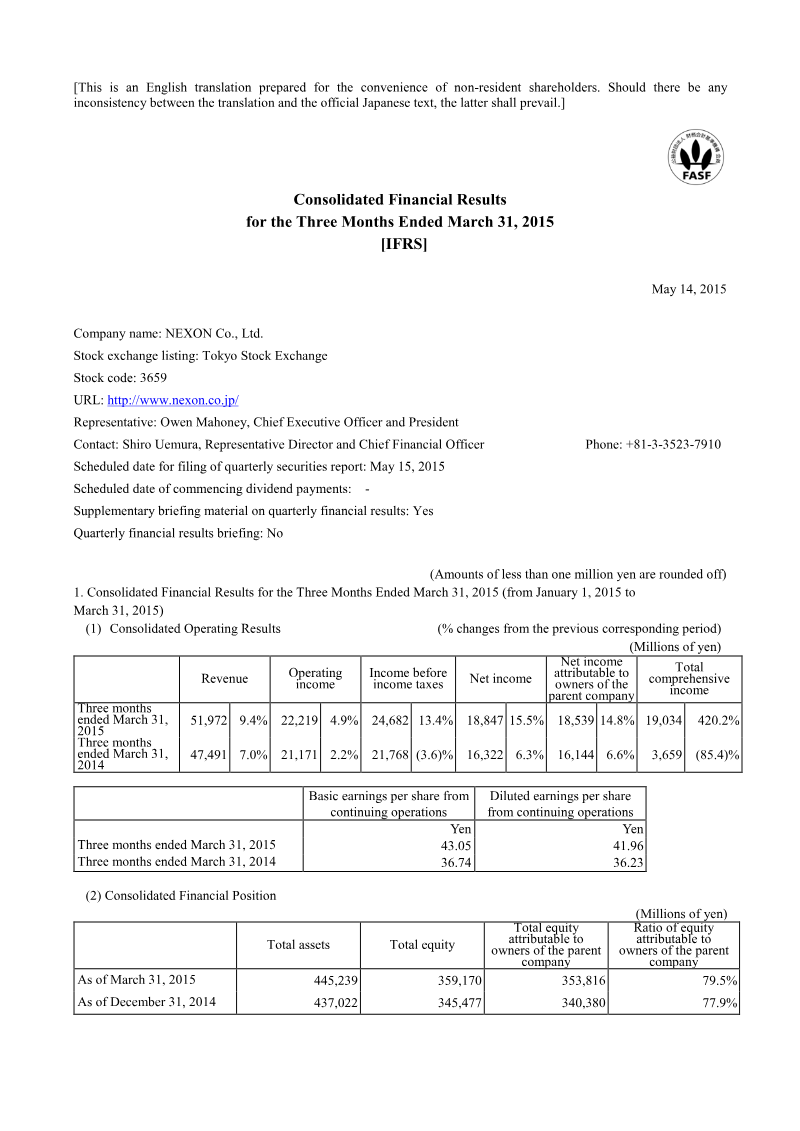
Nexon achieved significant financial growth during the first quarter of 2015, characterized by a 9.4 percent year-on-year revenue increase to 51,972 million yen.
- Nexon reported a 9.4% year-on-year revenue increase to 51,972 million yen for Q1 2015, with net income rising 14.8% to 18,539 million yen.
- PC online gaming remained the primary revenue driver at 43,210 million yen, while the mobile division grew to 8,370 million yen.
- The core title Dungeon&Fighter served as the primary catalyst for financial performance, maintaining strong engagement in the Korean and Chinese markets.
Nexon First Quarter 2015 Financial Results
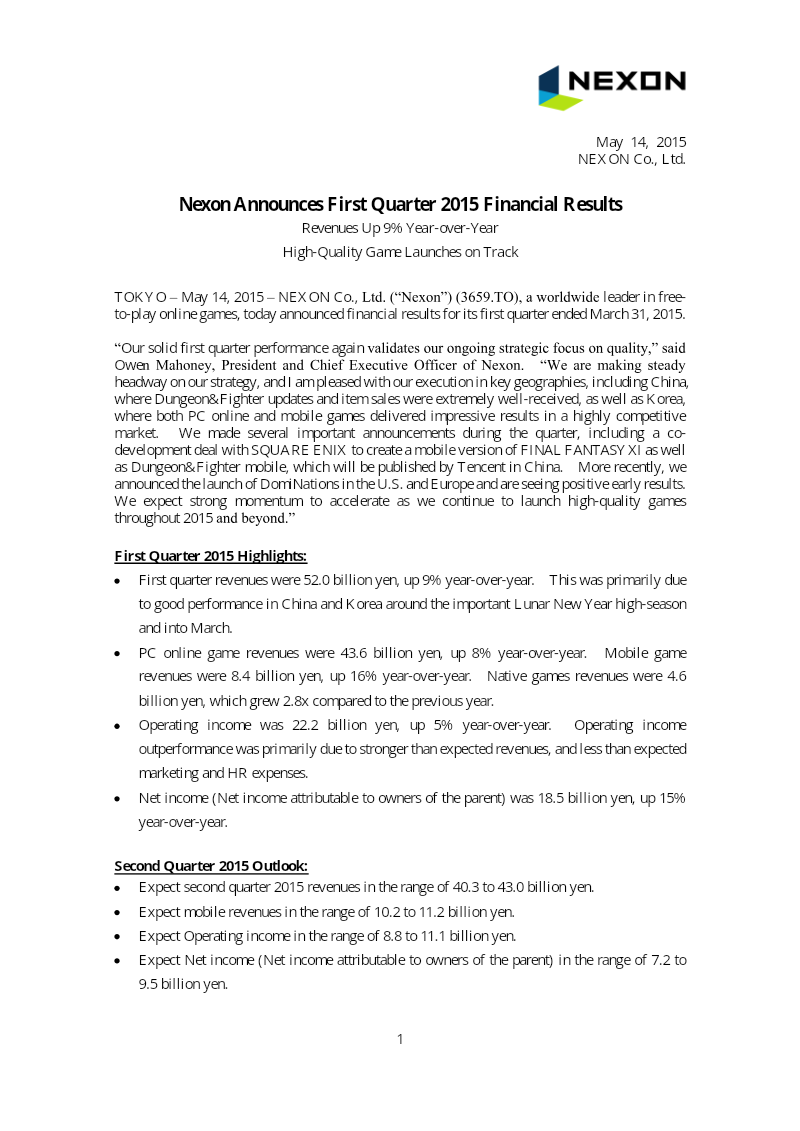
Nexon’s financial performance for the first quarter of 2015 demonstrates a successful execution of its strategic focus on high-quality game development and expansion within the free-to-play market.
- Nexon reported Q1 2015 total revenues of 52.0 billion yen, a 9% year-over-year increase driven by strong performance in China and Korea.
- Net income attributable to owners of the parent grew 15% to 18.5 billion yen, while operating income rose 5% to 22.2 billion yen.
- Mobile game revenues reached 8.4 billion yen, marking a 16% increase, while native game revenues grew 2.8 times compared to Q1 2014.
Nexon Q1 2015 Investor Presentation
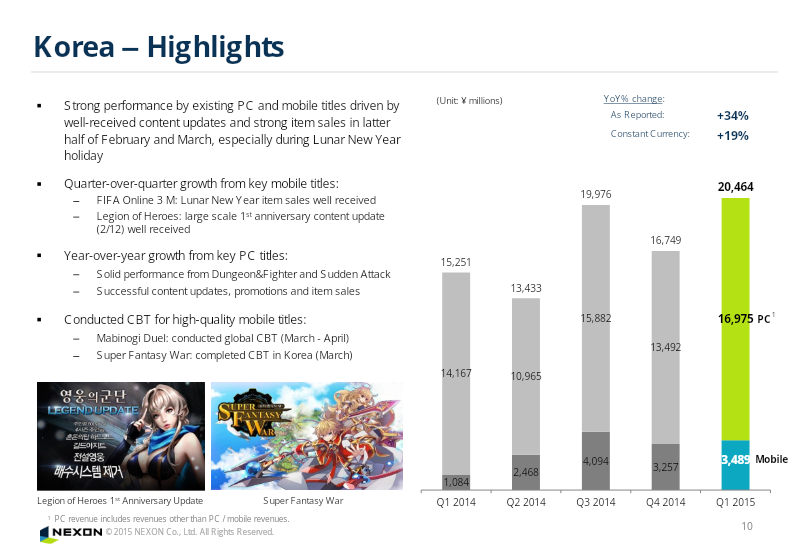
Nexon’s first-quarter 2015 investor presentation outlines a period of strong financial performance and strategic execution, characterized by revenue growth and successful operations in key Asian markets.
- Nexon reported Q1 2015 total revenues of ¥52.0 billion, a 9% year-over-year increase, and an operating income of ¥22.2 billion, a 5% increase.
- Net income for the quarter reached ¥18.5 billion, representing a 15% year-over-year growth, supported by a ¥10 billion share repurchase program.
- Financial performance exceeded the company's initial outlook due to strong results in China and Korea and disciplined management of marketing and HR expenditures.