Mobile reports and market data
Documents
2022 Global White Paper on Mobile Advertising & Marketing Game
SocialPeta's H1 2022 Mobile Game Marketing White Paper analyses global mobile game advertising data covering January to June 2022.
- Mobile game creatives fell 27.83% year on year in H1 2022, while advertisers were roughly flat.
- Casual games had the largest share of mobile game advertisers, at 26.03%.
- Video creatives accounted for over 86% of mobile game creatives in H1 2022.


Mobile Ad Creative Index: 2022
Liftoff + Vungle's 2022 Mobile Ad Creative Index argues that creative quality becomes the main lever for app marketers as Apple removes IDFA access and Google moves toward similar privacy restrictions on Android.
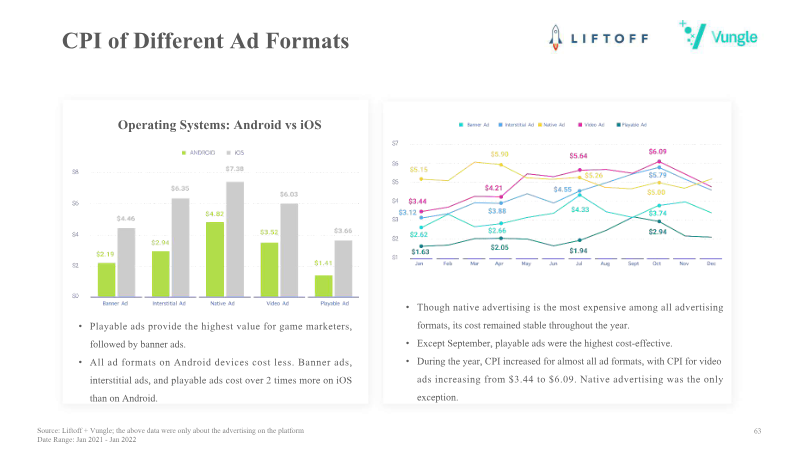
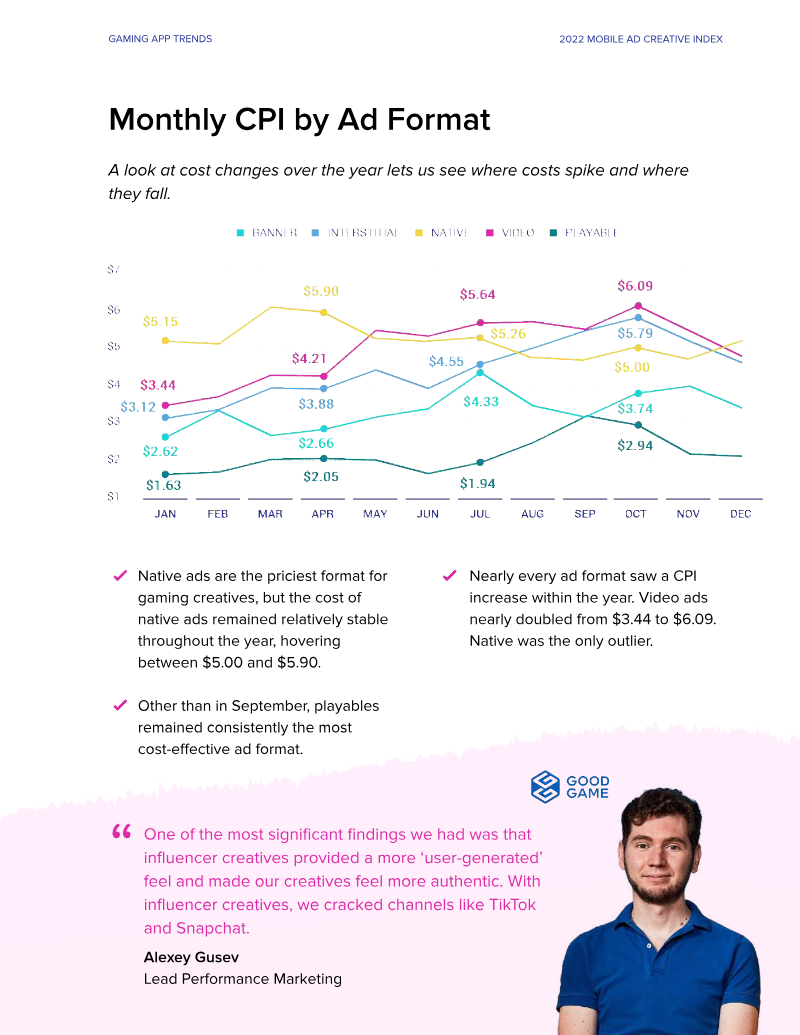
- Playable ads in the gaming sector achieve the lowest cost-per-install (CPI) at $1.98, while banner ads generate the highest 30-day return on ad spend (ROAS) at nearly 22%.
- iOS advertising costs are frequently double those of Android, making Android the more cost-effective platform for mobile user acquisition.
- There is a significant disconnect between player psychology and creative execution, with only 4% of casual game video ads and less than 1% of midcore ads successfully targeting specific player motivations.
Modern Mobile Consumer 2022: App Discovery Report
The Modern Mobile Consumer 2022: App Discovery Report from Tapjoy and ironSource argues that mobile users follow many paths to discovering apps, so user acquisition strategy should be equally varied.
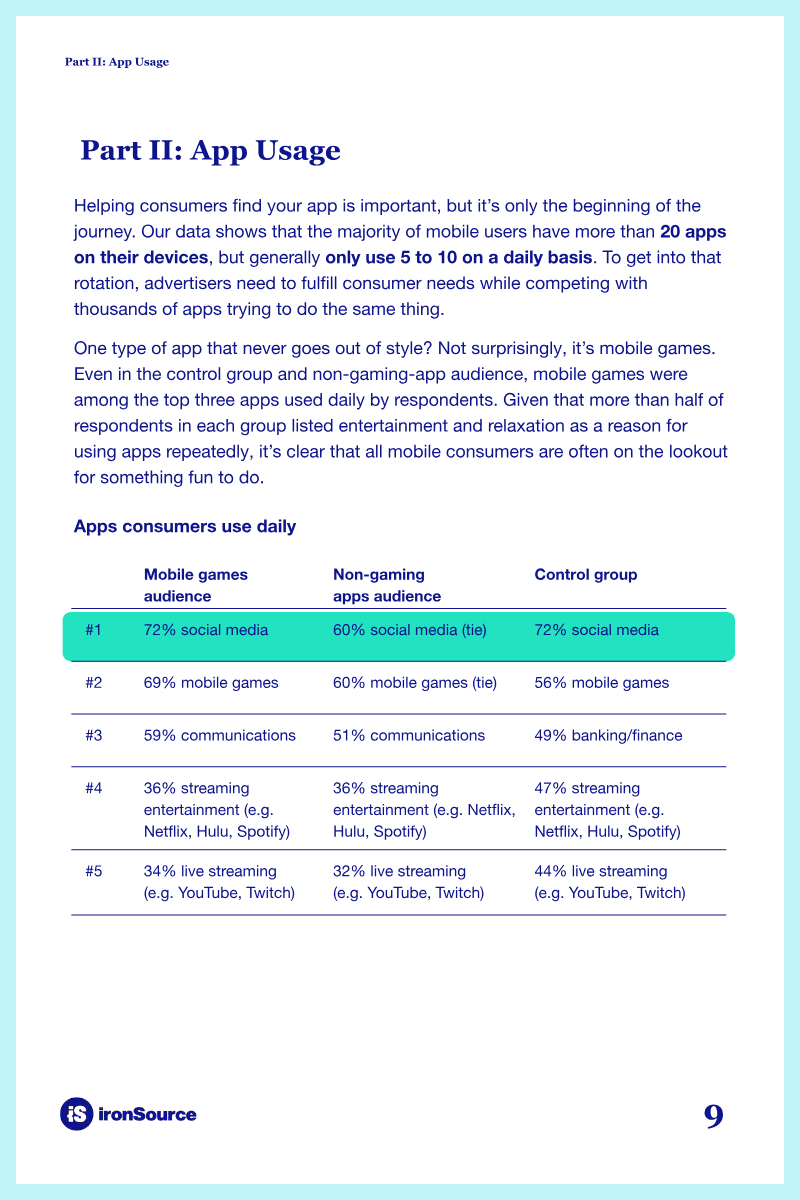
- Mobile gaming has become a universal behavior, with 60% of non-gaming app users playing mobile games daily, matching social media as the top usage category.
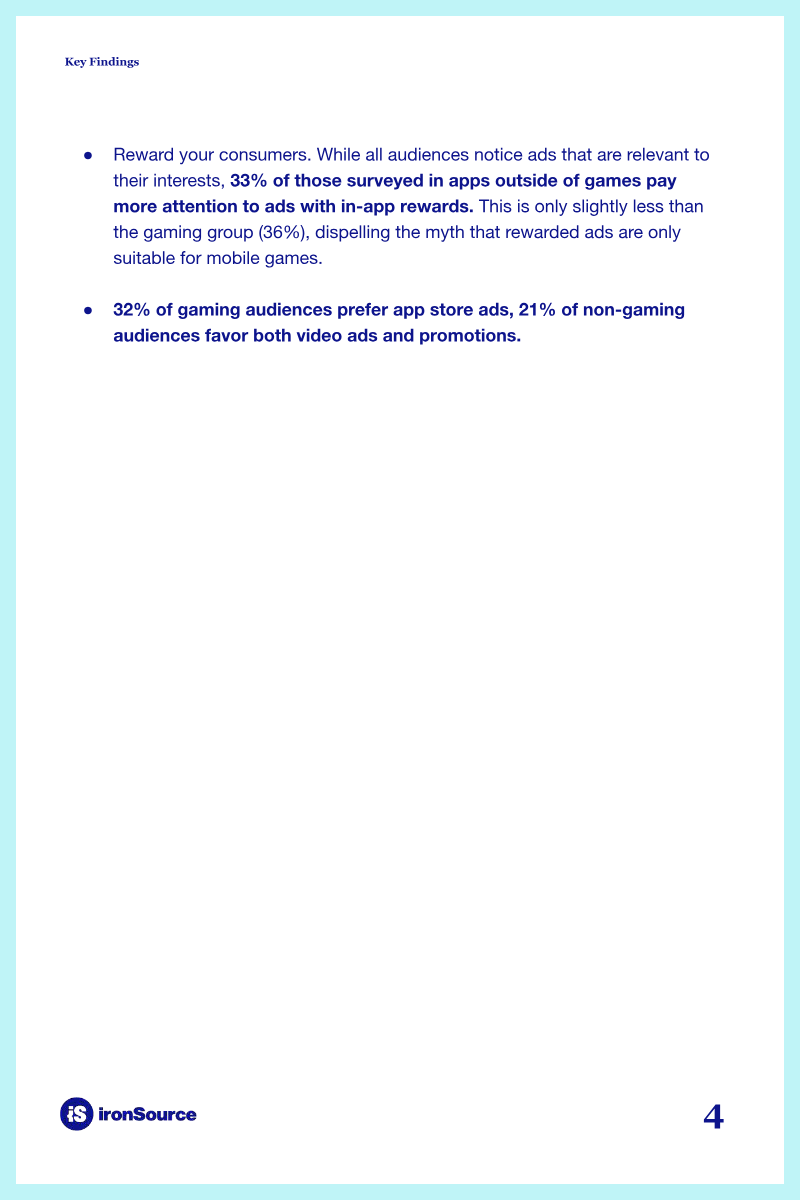
- In-app advertising is a primary driver for app discovery, leading to downloads for 70% of gaming audiences and 78% of non-gaming control group users.
- While users typically maintain over 20 apps on their devices, the majority limit their daily engagement to only five to ten apps.
Ad Intelligence: An Overview 2022
Apptica's 2022 ad intelligence study analyzes advertising strategies and creatives across the App Store and Google Play, using data from its own Ad Intelligence platform.
- The mobile advertising market has doubled since 2019, with over 120,000 active advertisers identified across 35 countries in 2022.
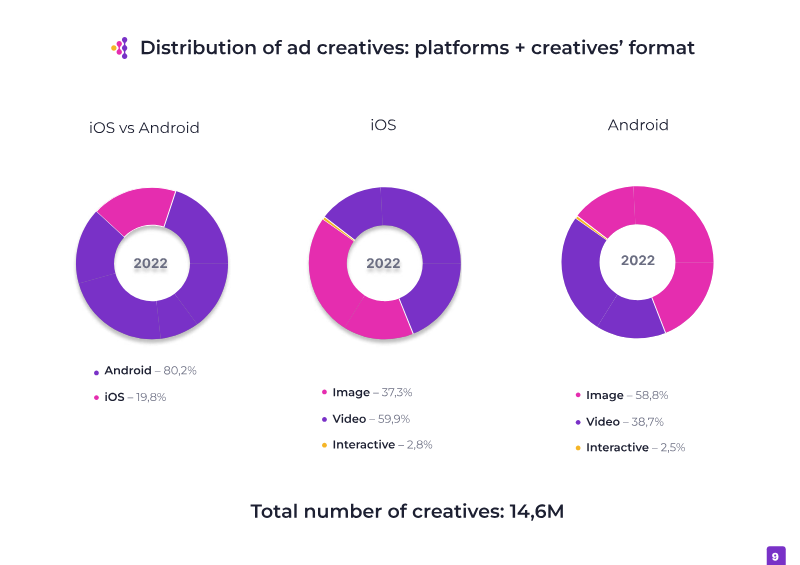
- Android dominates the advertising landscape, accounting for 71% of advertisers and over 80% of the 14.6 million creatives tracked.
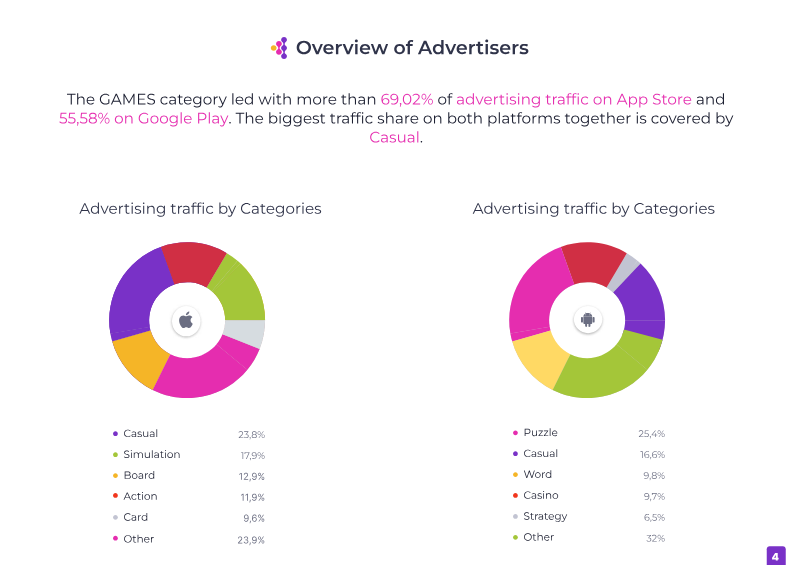
- Gaming remains the primary advertising sector, capturing 69.02% of traffic on the App Store and 55.58% on Google Play, with Casual and Puzzle genres leading their respective platforms.


State of Anime Gaming 2022
Anime-themed mobile games are a niche but highly monetized segment that is gaining traction beyond its Japanese base.
- Anime-themed mobile games generated 20% of total global mobile game consumer spend in 2021 despite accounting for only 1% of total usage.
- Japan remains the dominant market, representing 55% of global anime-game spend in 2021, though its market share has declined by nine percentage points since 2018.
- Global downloads for anime-style games grew 50% between 2018 and 2021, with South Korea emerging as a top growth market showing a 170% increase in downloads and 85% increase in spend.
Store Intelligence Data Digest: Q2 2022
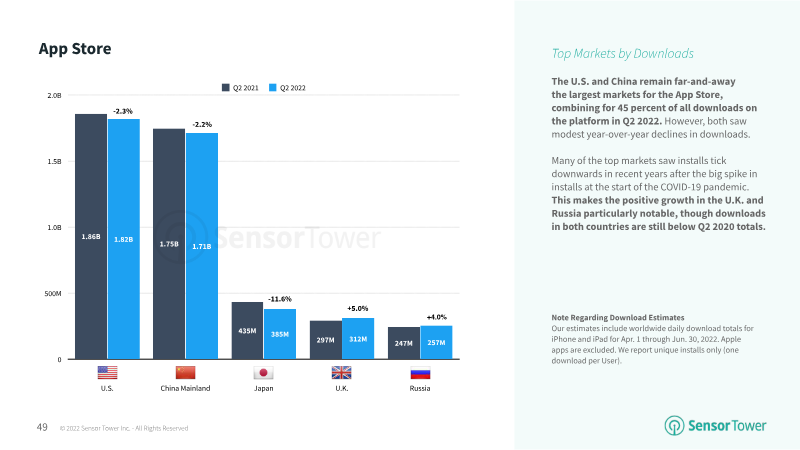
Sensor Tower's Store Intelligence Data Digest for Q2 2022 compiles App Store and Google Play download estimates for April 1 through June 30, 2022, covering worldwide, United States, Europe, Asia, and Australia.
- Worldwide app downloads totaled 35 billion, a 2.5 percent year-over-year decrease.
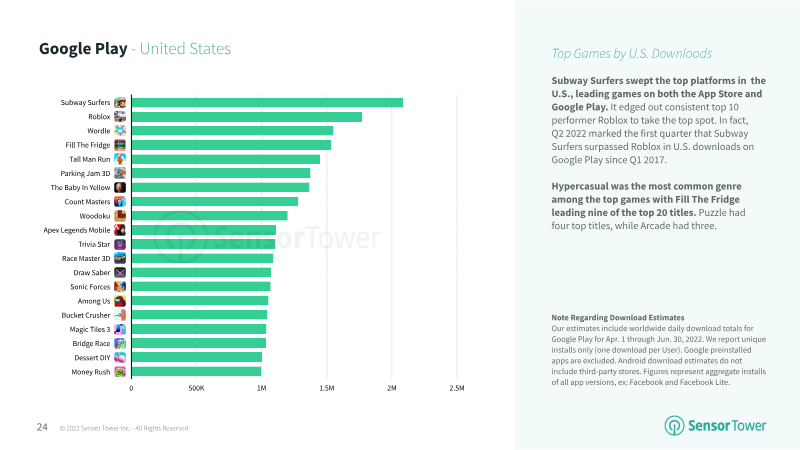
- Subway Surfers was the top mobile game by downloads globally, as well as in the U.S. and Europe.
- Consumers spent more in non-games than games on the U.S. App Store for the first time in Q2 2022.
State of Mobile 2022 – Indonesia
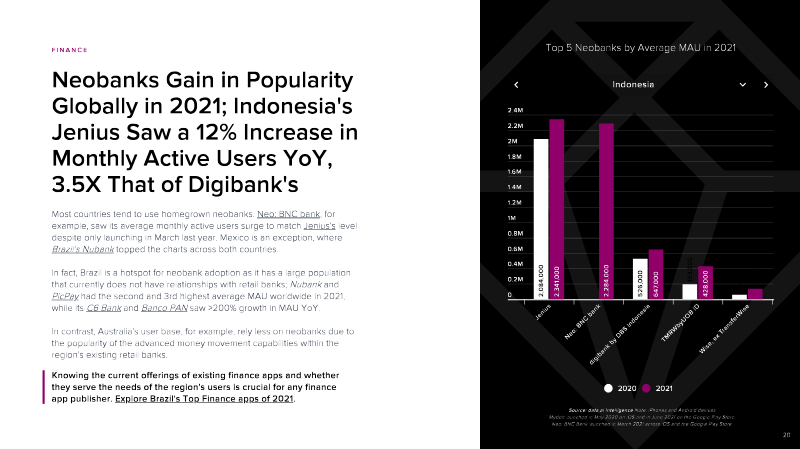
State of Mobile 2022 – Indonesia, published by data.ai, reports on mobile app market activity in Indonesia across 2021, using data.ai Intelligence and covering downloads, time spent, consumer spend and category rankings on iOS and Google Play, with some figures using Android phones only.
- Indonesian users spent 156 billion hours on mobile in 2021, 66 billion more than in 2020, which the document describes as 20% YoY growth.
- In Indonesia, 7 out of every 10 minutes on mobile in 2021 were spent in Social and Photo & Video apps.
- Finance app downloads in Indonesia surpassed 382M in 2021, an 82% YoY increase.


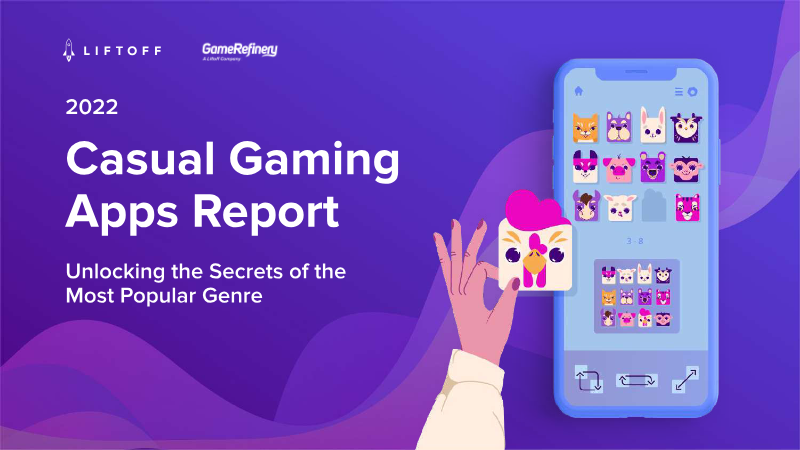
Casual Gaming Apps Report 2022
The Liftoff 2022 Casual Gaming Apps Report analyzes user acquisition, return on ad spend (ROAS), and ad completion across three casual gaming genres: Lifestyle, Puzzle, and Simulation.
- Simulation games had the lowest cost per install among the genres, at $0.91, with Puzzle next at $1.12.
- Lifestyle games have the highest CPI but also the highest returns, with ROAS of 10.57% on Day 7 and 22.56% on Day 30.
- Post-ATT, Android users cost less than half what iOS players cost to acquire, at $0.75 versus $2.27 CPI.
State of Mobile: Brazil 2022
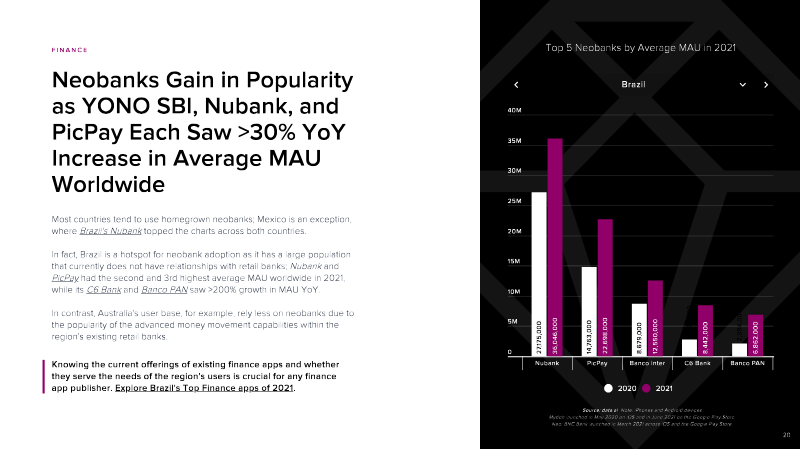
data.ai's "State of Mobile: Brazil 2022" is an executive report on mobile app markets in Brazil, drawing on data.ai estimates of downloads, consumer spend, time spent and app store search across iOS and Google Play, with a worldwide and Brazil focus and 2021 as the main period.
- Brazil recorded 10.3 billion app downloads and $1.13 billion in consumer spend in 2021, with consumer spend up 22% year over year.
- Average time spent on mobile in Brazil surpassed 5.4 hours per day in 2021, which the report places as the highest of all countries it compares.
- Gaming consumer spend in Brazil reached $571 million in 2021 after an additional $75 million was added that year.
Mobile App Trends 2022
Adjust's "Mobile app trends 2022" is a benchmark guide covering global app performance data from 01.01.2020 to 31.12.2021, drawn from a mix of Adjust's top 2,000 apps and the total dataset of all apps it tracks, with sources covering a list of 45 countries and roughly 250 countries based on ISO 3166-1.
- Installs grew year-over-year in all three tracked verticals, with fintech up 35%, e-commerce up 12% and gaming up 32%.
- Industry-wide ATT opt-in rates reportedly rose to approximately 25%, from 16% in May 2021, with gaming reaching 30%.
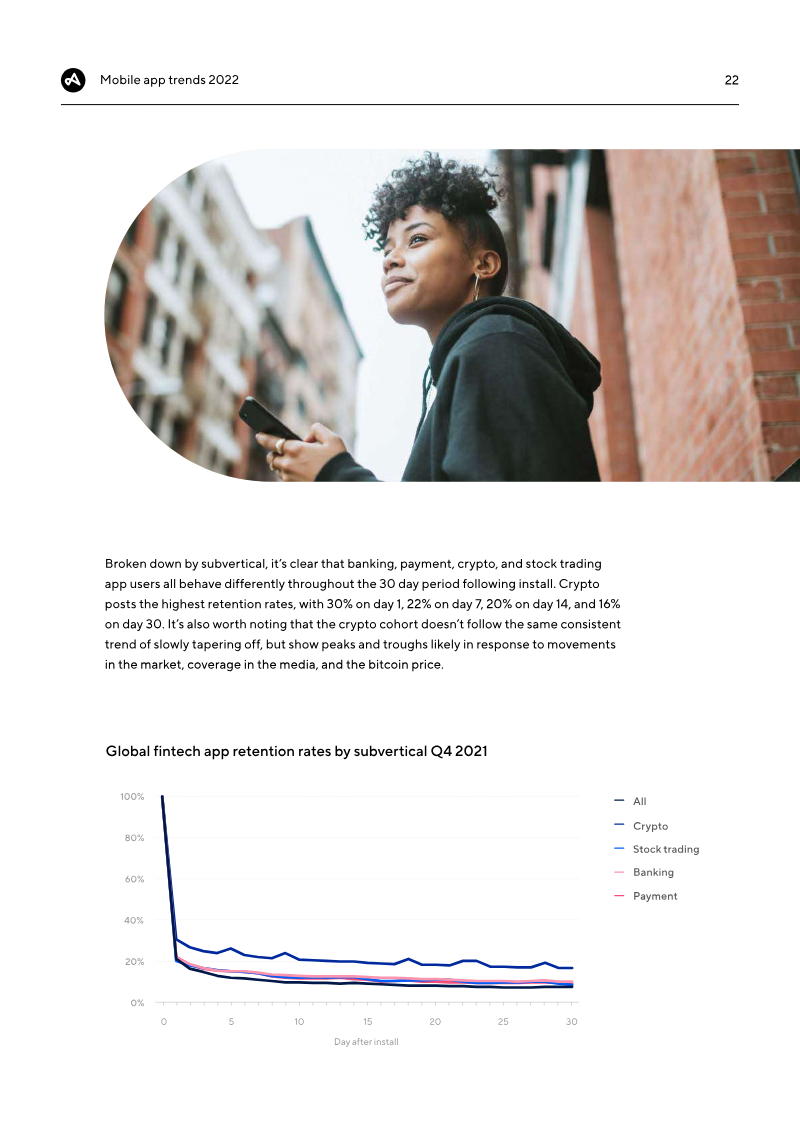
- Installs and sessions in the fintech vertical increased globally by 34% and 53%, respectively.


State of Mobile 2022 India
This data.ai report, "State of Mobile 2022 India," is an executive summary of mobile app market data for India and selected global markets, covering 2021 with comparisons to earlier years.
- Time spent in mobile apps in India surpassed 4.7 hours per day in 2021, up 27% from 2019.
- India recorded 26.7 billion downloads in 2021, with growth of 10% year over year.
- Mobile game consumer spend in India was $165 million in 2021, despite a slight dip year over year.
The State of Mobile Gaming 2022: Market Trends and Top Titles in the U.S., Europe, and Asia
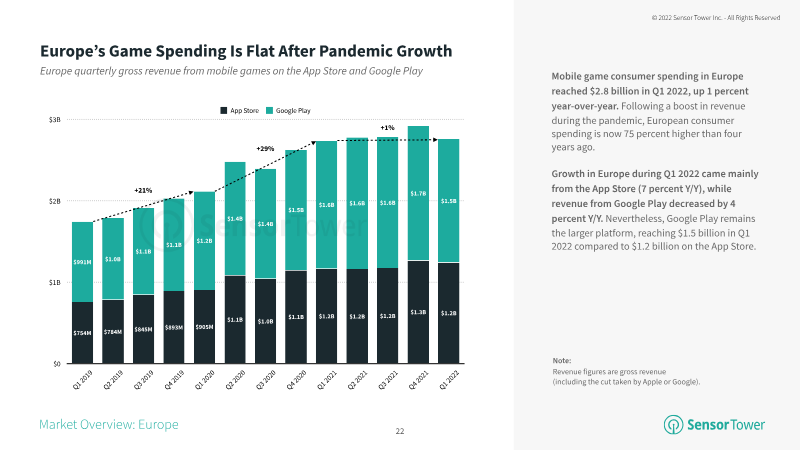
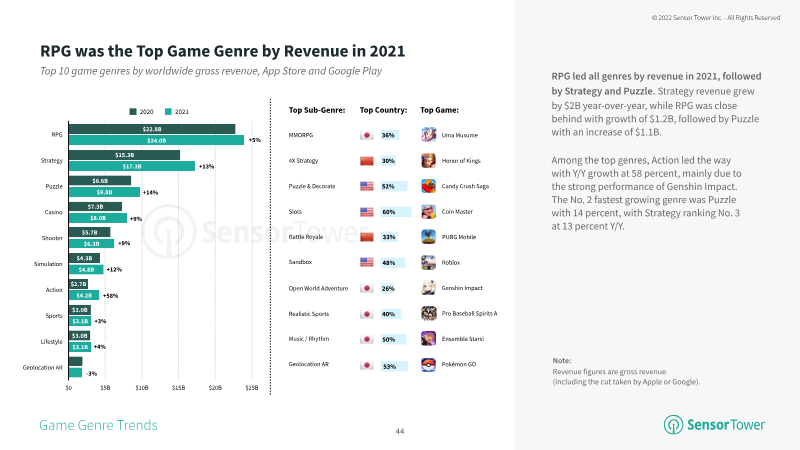
Sensor Tower's 2022 report analyzes mobile game market trends worldwide and across the U.S., Europe, and Asia, drawing on App Store and Google Play data, with sections on game genres and monetization models.
- Worldwide mobile game revenue declined year-over-year for the first time in history in Q1 2022, falling 6 percent to $21.2 billion.
- U.S. consumer spending dropped 10 percent to below $6 billion in Q1 2022, with Google Play revenue falling 22 percent year-over-year.
- Japan's mobile game revenue fell 18 percent year-over-year in Q1 2022.
Writers
Games and companies
Games