Market Analysis
Documents
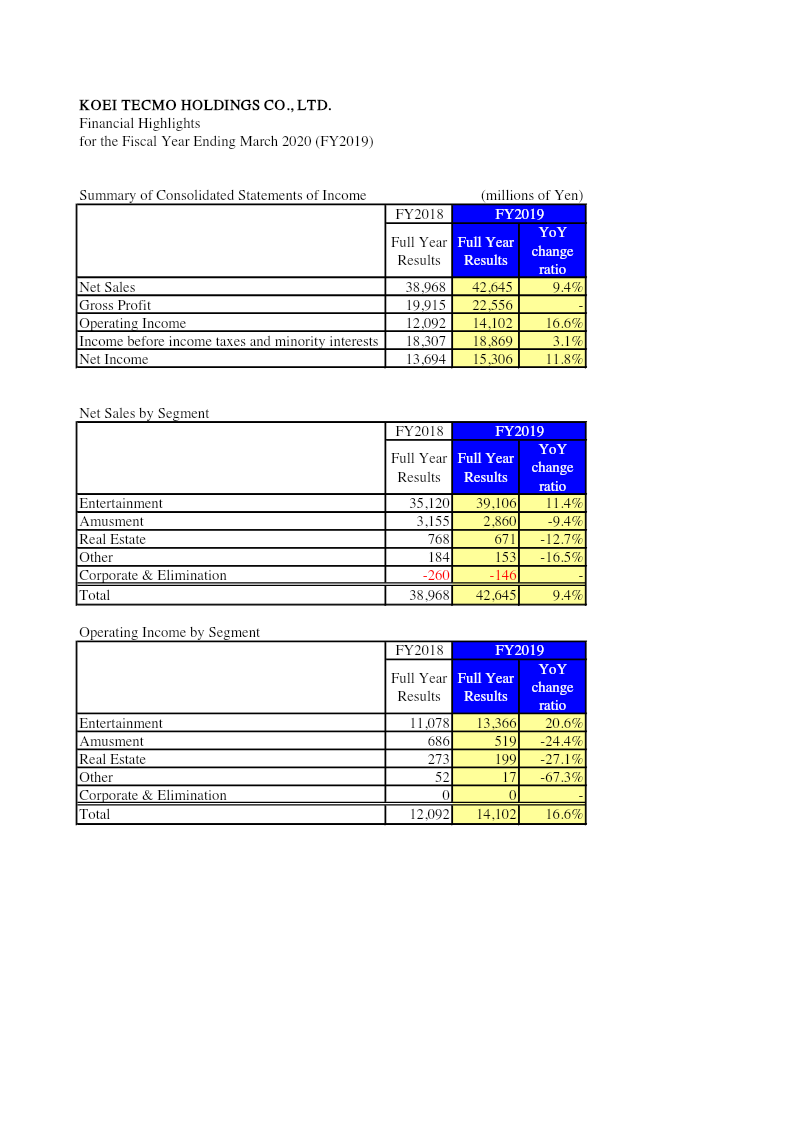
Financial Highlights: Fiscal Year Ending March 2020
Koei Tecmo Holdings reported a strong fiscal year ending March 2020, with net sales rising 9.4 % to ¥42.645 billion from ¥38.968 billion in FY2018. The entertainment segment drove growth, contributing 11.4 % of sales and generating ¥13.366 billion in operating income, a 20.6 % increase. In contrast, amusement, real‑estate and other segments saw declines of 9.4 %, 12.7 % and 16.5 % respectively, reflecting a shift toward core gaming activities. Operating income overall grew 16.6 %, and net income increased 11.8 % to ¥15.306 billion, supported by higher gross profit and efficient cost management.
Balance‑sheet expansion was notable: total assets grew from ¥129.192 billion to ¥147.793 billion, largely due to a jump in current assets (cash and receivables) and property‑and‑equipment investments. Shareholders’ equity rose to ¥128.602 billion, driven by retained earnings and capital surplus. However, current liabilities surged to ¥24.090 billion, driven by short‑term loans and trade payables, while long‑term liabilities increased modestly to ¥1.356 billion.
The company’s geographic focus remains Japan‑centric, with revenue primarily from domestic entertainment products. The fiscal period covers the 12 months ending March 2020, and financial statements follow Japanese GAAP. No external survey data are cited; figures derive from consolidated accounting records. Overall, Koei Tecmo’s FY2020 performance highlights robust growth in its core gaming segment amid a broader portfolio contraction.
- Koei Tecmo reported a 9.4% increase in net sales to ¥42.645 billion for the fiscal year ending March 2020, with net income rising 11.8% to ¥15.306 billion.
- The entertainment segment served as the primary growth engine, delivering a 20.6% increase in operating income to ¥13.366 billion.
- Non-gaming segments experienced significant contractions, with amusement, real-estate, and other business units declining by 9.4%, 12.7%, and 16.5% respectively.
- Total assets expanded to ¥147.793 billion from ¥129.192 billion, bolstered by growth in cash, receivables, and property investments.
- Shareholders’ equity reached ¥128.602 billion, supported by strong retained earnings and capital surplus.
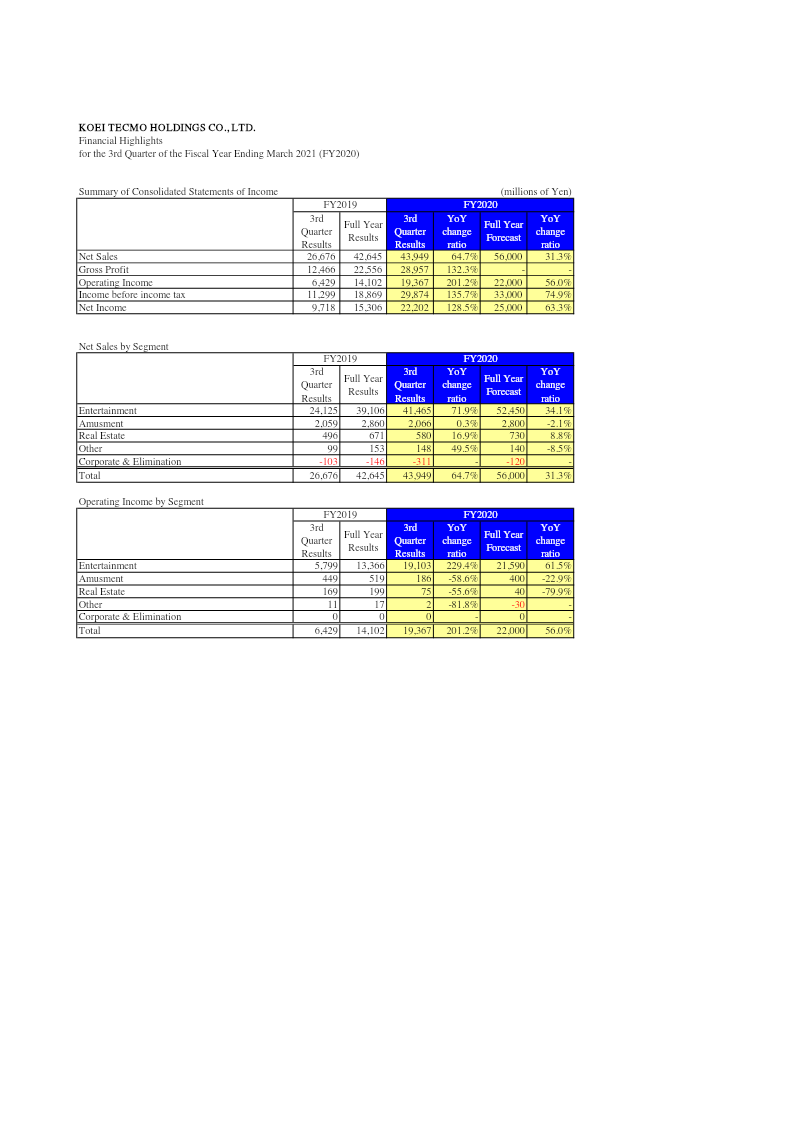
Financial Highlights: 3rd Quarter of the Fiscal Year Ending March 2021
Koei Tecmo Holdings reported a robust third‑quarter performance for fiscal year 2020, with net sales rising 64.7 % to ¥42.6 billion from ¥26.7 billion in the same period of FY2019, and net income increasing 128.5 % to ¥15.3 billion. The entertainment segment drove growth, contributing 71.9 % of sales and delivering a 229.4 % increase in operating income, while amusement and real‑estate segments showed modest gains or declines. Forecasts for the full year projected sales of ¥56 billion and operating income of ¥22 billion, reflecting a 31.3 % and 56.0 % year‑on‑year increase, respectively.
On the balance‑sheet side, total assets expanded from ¥147.8 billion to ¥186.5 billion, largely due to a jump in investment securities from ¥71.4 billion to ¥113.9 billion and a rise in property, plant, and equipment to ¥155.8 billion. Current assets grew modestly, while current liabilities increased slightly, driven by higher short‑term loans and accounts payable. Long‑term liabilities surged to ¥5.1 billion, largely from deferred tax obligations. Shareholders’ equity rose to ¥143.9 billion, supported by retained earnings of ¥103.2 billion and a reduction in treasury stock.
The figures cover Japan‑based operations for the fiscal year ending March 31, 2020, with quarterly results compared to FY2019 and full‑year forecasts. Data derive from consolidated financial statements prepared under Japanese GAAP, reflecting a comprehensive view of the company’s operating performance and liquidity position.
- Koei Tecmo Holdings reported significant Q3 FY2020 growth, with net sales rising 64.7% to ¥42.6 billion and net income surging 128.5% to ¥15.3 billion compared to the same period in FY2019.
- The entertainment segment was the primary growth driver, accounting for 71.9% of total sales and achieving a 229.4% increase in operating income.
- Full-year forecasts for FY2020 project strong annual performance, with expected sales of ¥56 billion and operating income of ¥22 billion, representing year-on-year increases of 31.3% and 56.0%, respectively.
- Total assets grew to ¥186.5 billion, fueled primarily by a substantial increase in investment securities from ¥71.4 billion to ¥113.9 billion.
- Shareholders’ equity reached ¥143.9 billion by the end of the third quarter, supported by retained earnings of ¥103.2 billion and a reduction in treasury stock.
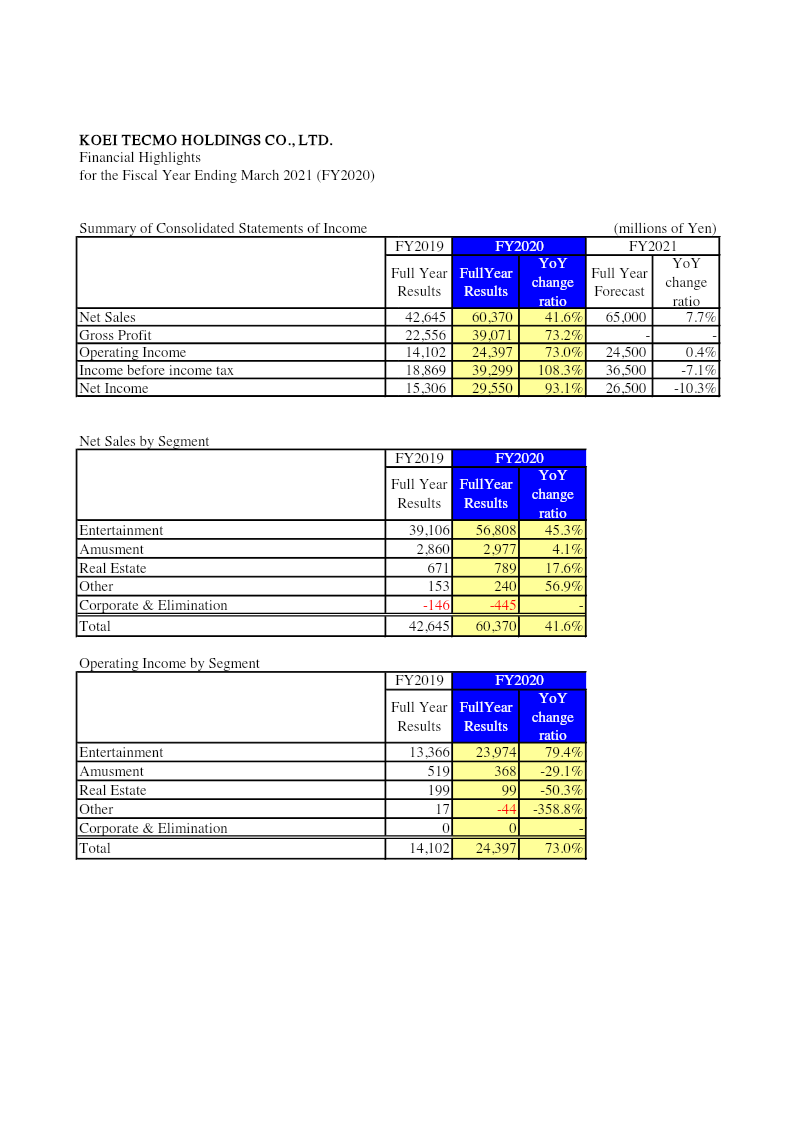
Financial Highlights: Fiscal Year Ending March 2021
Financial highlights for the fiscal year ending March 2021 show a robust expansion of KOEI TECMO HOLDINGS’ revenue and profitability. Net sales rose 41.6 % from ¥42,645 million in FY2019 to ¥60,370 million in FY2020, driven mainly by the entertainment segment which grew 45.3 % to ¥56,808 million. Gross profit increased 73.2 %, operating income surged 73.0 % to ¥24,397 million, and net income nearly doubled, rising 93.1 % to ¥29,550 million. Forecasts for FY2021 anticipate a modest 7.7 % sales increase to ¥65,000 million and a slight operating income rise of 0.4 % to ¥24,500 million.
The balance sheet reflects significant asset growth: total assets expanded from ¥147,793 million to ¥190,671 million, largely due to a jump in investment securities from ¥71,350 million to ¥113,176 million and an increase in net defined benefit assets. Current assets grew 12.5 % to ¥33,739 million, while current liabilities fell 12.8 % to ¥21,022 million, improving liquidity. Shareholders’ equity rose 18.8 % to ¥151,999 million, supported by retained earnings growth and a reduction in treasury stock.
Geographically the company operates primarily within Japan, with revenue streams concentrated in entertainment and amusement. The period covered is FY2019 through FY2020, with forward guidance for FY2021. Data derive from consolidated financial statements prepared under Japanese GAAP, reflecting a comprehensive view of operating performance and balance sheet strength.
- KOEI TECMO HOLDINGS achieved significant growth in FY2020, with net sales rising 41.6% to ¥60,370 million and net income nearly doubling by 93.1% to ¥29,550 million.
- The entertainment segment served as the primary revenue driver, growing 45.3% to reach ¥56,808 million in FY2020.
- Operating income surged 73.0% to ¥24,397 million, while gross profit saw a substantial increase of 73.2% during the same period.
- The company’s balance sheet strengthened significantly as total assets grew to ¥190,671 million, largely fueled by an increase in investment securities from ¥71,350 million to ¥113,176 million.
- Liquidity improved as current assets rose 12.5% to ¥33,739 million while current liabilities decreased by 12.8% to ¥21,022 million.
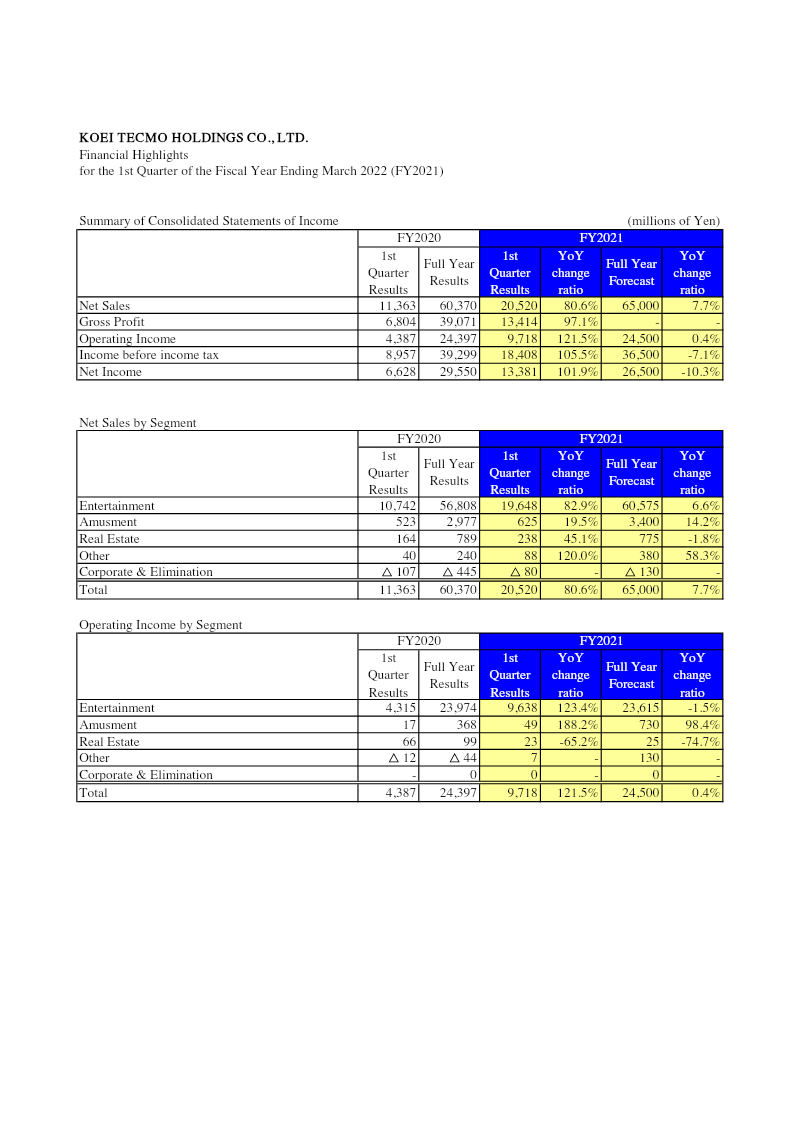
Financial Highlights: 1st Quarter of Fiscal Year Ending March 2022
Financial highlights for the first quarter of fiscal year ending March 2022 show a robust 80.6 % increase in net sales to ¥60,370 million from ¥20,520 million the prior year. Gross profit rose 97.1 % to ¥39,071 million, while operating income surged 121.5 % to ¥24,397 million and net income climbed 101.9 % to ¥29,550 million. Forecasts for the full year indicate a modest 7.7 % rise in net sales to ¥65,000 million and a slight decline of 10.3 % in net income to ¥26,500 million.
Segment analysis reveals entertainment sales as the dominant driver, contributing ¥56,808 million in net sales (82.9 % YoY growth) and ¥23,974 million in operating income (123.4 % YoY). Amusement sales grew 19.5 % in net sales and 188.2 % in operating income, while real‑estate revenue increased 45.1 % but operating income fell 65.2 %. Other segments showed mixed performance, with a 120 % rise in net sales but a decline in operating income.
Balance‑sheet activity shows current assets rising to ¥42,361 million from ¥33,739 million, driven by a jump in marketable securities to ¥14,109 million. Current liabilities increased to ¥23,446 million, largely due to short‑term loan payable of ¥9,500 million. Shareholders’ equity remained stable at approximately ¥151 million million, with retained earnings slightly lower. Overall liquidity improved, and the company maintained a solid asset base of ¥190 842 million as of June 30, 2021.
- The company experienced significant Q1 growth for the fiscal year ending March 2022, with net sales rising 80.6% to ¥60,370 million and net income increasing 101.9% to ¥29,550 million.
- Entertainment remains the primary revenue driver, accounting for ¥56,808 million in net sales and achieving 82.9% year-over-year growth.
- Operating income saw a substantial surge of 121.5% to ¥24,397 million, largely fueled by a 123.4% increase in the entertainment segment and a 188.2% increase in the amusement segment.
- Full-year forecasts project a conservative 7.7% increase in net sales to ¥65,000 million and a 10.3% decline in net income to ¥26,500 million.
- Real-estate performance was mixed, showing a 45.1% increase in revenue but a 65.2% decline in operating income.
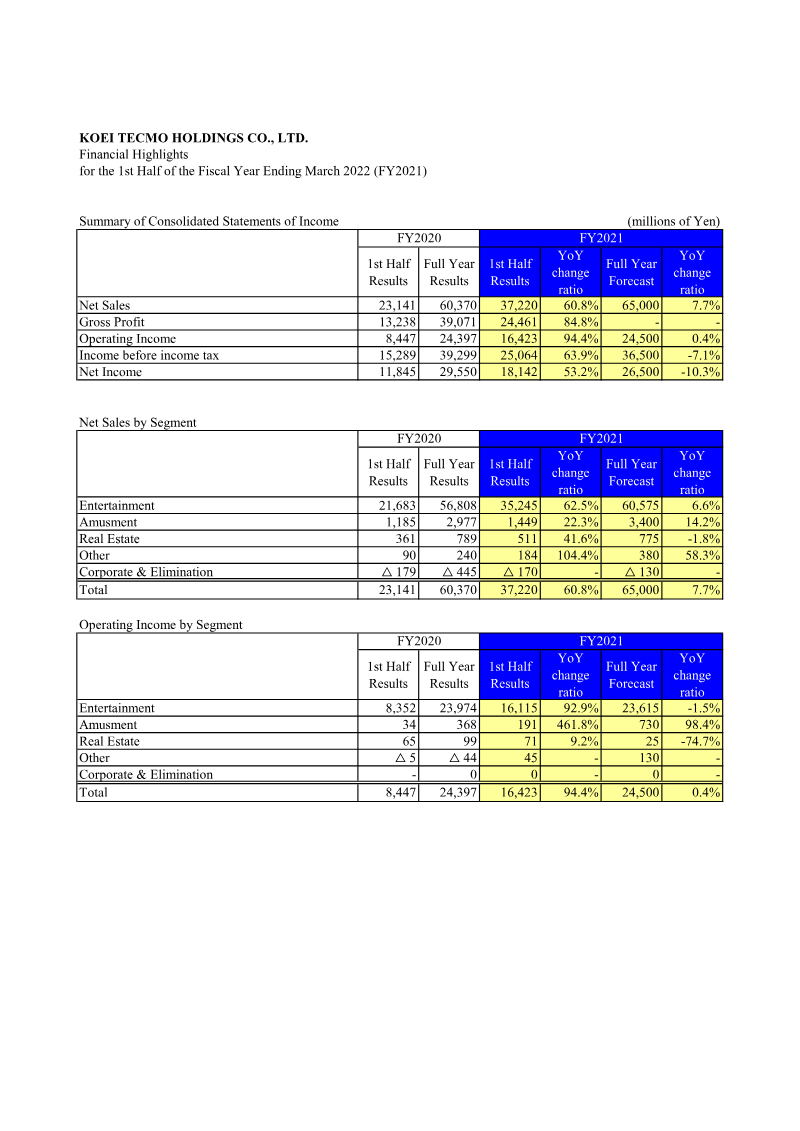
Financial Highlights: 1st Half of the Fiscal Year Ending March 2022
The financial highlights for KOEI TECMO Holdings’ first half of the fiscal year ending March 2022 demonstrate a robust expansion across all core segments. Net sales surged 60.8 % year‑over‑year to ¥23,141 million, driven primarily by the Entertainment segment, which contributed 62.5 % of the increase and generated ¥21,683 million in sales. Amusement revenue grew 22.3 %, while Real Estate and Other segments added 41.6 % and 104.4 % respectively, offsetting a modest decline in Corporate & Elimination activities.
Operating income rose 94.4 % to ¥8,447 million, with Entertainment accounting for 92.9 % of the gain and Amusement showing a remarkable 461.8 % jump, though Real Estate income increased only 9.2 %. Net income climbed 53.2 % to ¥11,845 million, reflecting higher profitability and efficient cost management.
Balance‑sheet analysis reveals a stable asset base of ¥190.8 billion, with current assets increasing to ¥39,179 million largely due to higher marketable securities and contract receivables. Fixed assets remained steady at ¥151,625 million. Liabilities rose modestly to ¥25,825 million, driven by short‑term loan activity. Shareholders’ equity expanded to ¥155,599 million, supported by retained earnings growth and a slight increase in capital surplus.
The data cover Japan‑based operations for the first half of FY2021, with comparative figures from FY2020 and full‑year projections. The report relies on consolidated financial statements prepared under Japanese GAAP, providing a comprehensive view of the company’s performance and liquidity position.
- KOEI TECMO Holdings achieved a 60.8% year-over-year increase in net sales to ¥23,141 million for the first half of the fiscal year ending March 2022.
- Operating income nearly doubled, rising 94.4% to ¥8,447 million, while net income grew 53.2% to ¥11,845 million due to improved profitability and cost management.
- The Entertainment segment served as the primary growth engine, contributing 62.5% of the total sales increase and 92.9% of the gain in operating income.
- Amusement segment performance was a standout, with revenue growing 22.3% and operating income surging 461.8% compared to the previous year.
- Real Estate and Other segments recorded significant growth, with sales increasing by 41.6% and 104.4% respectively.

Koei Tecmo Holdings Financial Summary: FY2024 3Q
Koei Tecmo Holdings reported FY2024 Q3 results, showing a 17.6 % decline in consolidated sales to ¥14,677 million versus ¥16,109 million in Q2 and a 25.4 % drop from the same period in FY2023. Gross profit fell to ¥8,392 million, reflecting higher cost of sales (¥6,285 million) and a lower gross margin of 32 % compared with 41 % in Q2. Operating profit contracted to ¥4,673 million (profit ratio 32 %) from ¥6,664 million in Q2 and 41 % in FY2023 Q3. Ordinary profit turned negative for the first time in the quarter, at ¥(787) million, largely due to a ¥5,461 million non‑operating loss. Net profit was ¥(171) million, a reversal from the ¥6,898 million gain in Q2.
Segment analysis indicates entertainment sales dominated at ¥13,515 million (92 % of total), with console/PC and digital downloads each contributing roughly ¥5–6 million. Amusement revenue remained modest at ¥794 million, while real‑estate income was negligible. Regional sales were strongest in Japan (¥7,890 million) and Asia excluding Japan (¥5,232 million), with North America and Europe contributing ¥1,087 million and ¥468 million respectively.
Expenses rose in cost of sales (¥6,285 million) and SG&A (¥3,718 million). Employment costs increased to ¥5,200 million, and outsourcing expenses climbed to ¥1,400 million. Digital download units accounted for 75 % of total sales units in Q3, up from 73.9 % in Q2, indicating a continued shift toward digital channels.
Headcount remained steady at 2,400 employees. Capital expenditures for FY2024 were ¥1,967 million, with real‑estate investment at ¥1,631 million and depreciation expense at ¥1,776 million. The data cover the Japanese market and overseas regions for FY2024 Q3, with comparative figures from FY2023.
- Koei Tecmo reported a net loss of ¥171 million for FY2024 Q3, a significant reversal from the ¥6,898 million profit recorded in the previous quarter.
- Consolidated sales fell 25.4% year-over-year to ¥14,677 million, while operating profit contracted to ¥4,673 million from ¥6,664 million in Q2.
- Ordinary profit turned negative at ¥(787) million, primarily driven by a substantial non-operating loss of ¥5,461 million.
- The entertainment segment remains the core revenue driver, accounting for 92% of total sales at ¥13,515 million.
- Digital download penetration continues to rise, reaching 75% of total sales units in Q3 compared to 73.9% in Q2.
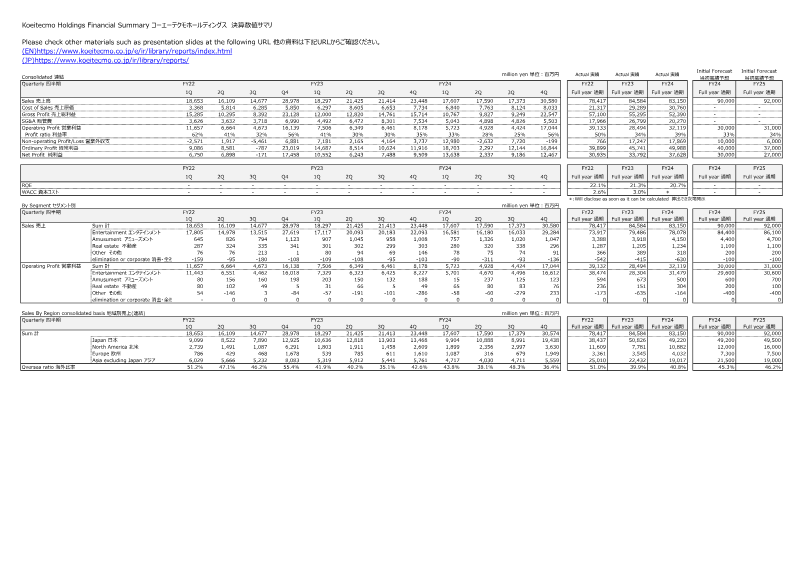
FY2024 Annual Data Appendix
The FY2024 Annual Data Appendix presents a comprehensive financial and operational snapshot of Koei Tecmo’s performance across fiscal years 2022–2025, with detailed quarterly and full‑year figures for sales, cost of sales, gross profit, SG&A, operating profit, ordinary profit, and net profit. Sales peaked in FY22 Q4 at ¥28,978 million before declining to ¥17,590 million in FY23 Q4 and rebounding to ¥23,448 million in FY24 Q4. Gross profit margins fell from 62% in FY22 Q1 to 25% in FY24 Q4, reflecting rising cost of sales and SG&A. Operating profit followed a similar trend, with FY24 Q4 at ¥8,178 million versus ¥16,139 million in FY22 Q4. Net profit swung from ¥17,458 million in FY22 Q4 to a loss of ¥171 million in FY24 Q3, before recovering to ¥9,509 million in FY24 Q4. Return on equity rose from 20.7% in FY22 to 22.1% in FY24, while the weighted average cost of capital increased from 2.6% to 3.0%.
Segment analysis shows the Entertainment division dominates revenue, contributing ¥73,917 million in FY24 and accounting for 94% of total sales. Amusement and real‑estate segments remain small, each under ¥5 billion annually. Geographic revenue distribution highlights Japan as the largest market (¥38,437 million FY24), followed by Asia excluding Japan (¥25,010 million) and North America (¥11,609 million). Overseas sales consistently exceed 40% of total revenue, peaking at 55.4% in FY24 Q4.
Cost breakdowns reveal SG&A expenses rising from ¥3,626 million in FY22 Q1 to ¥8,301 million in FY24 Q3, driven largely by advertising and other variable costs. Employment costs increased modestly from ¥5,110 million to ¥6,500 million over the period. Capital expenditures remained modest, with FY24 cumulative investment at ¥1,967 million.
Headcount grew from 2,413 employees in FY22 Q1 to 2,736 by FY24 Q4, a 9% YoY increase. Digital sales dominate the Entertainment segment, with digital download and DLC revenue accounting for over 60% of total entertainment sales in FY24. New title launches remain steady, with 2,370 units sold in FY24.
The appendix also outlines the FY24 title line‑up, featuring high‑profile releases such as “Romance of the Three Kingdoms 8 Remake” and “Fairy Tail 2,” targeting global markets across console, PC, and mobile platforms. These releases are positioned to support the company’s strategy of expanding digital and overseas sales while maintaining strong domestic performance.
- Koei Tecmo's Entertainment division remains the primary revenue driver, contributing ¥73,917 million in FY24 and accounting for 94% of total company sales.
- Gross profit margins experienced a significant contraction, falling from 62% in FY22 Q1 to 25% in FY24 Q4 due to rising costs of sales and SG&A expenses.
- Overseas markets are increasingly critical to the company's performance, with international revenue reaching 55.4% of total sales in FY24 Q4.
- Digital revenue, including downloads and DLC, now accounts for over 60% of total entertainment sales, underscoring the company's shift toward digital-first distribution.
- Operating profit in FY24 Q4 reached ¥8,178 million, a decline from the ¥16,139 million peak recorded in FY22 Q4.
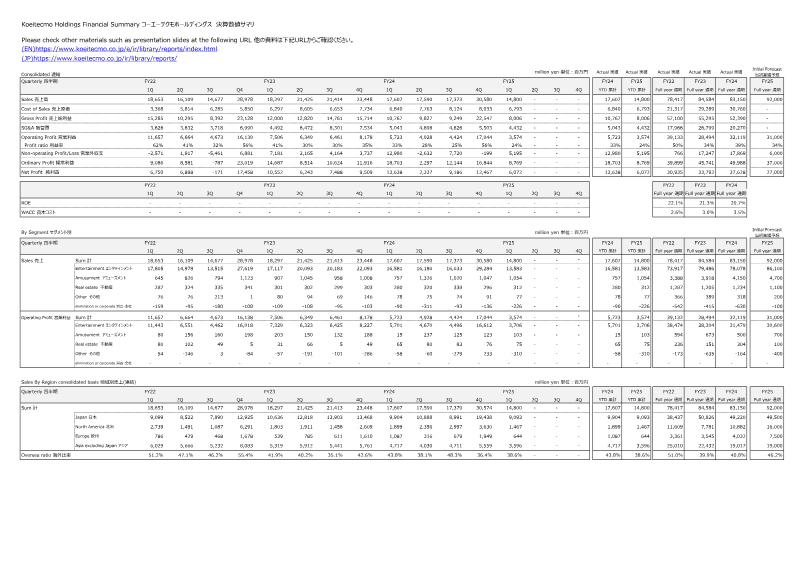
FY2025 1st Quarter Data Appendix: Koei Tecmo
Koei Tecmo’s FY2025 first‑quarter financial appendix presents consolidated performance for the fiscal year 2024, with comparative data through FY2023 and projections to FY2025. Sales rose from ¥18.7 billion in Q1 2024 to ¥21.4 billion in Q1 2025, driven by a 20% increase in the Entertainment segment and a 30% rise in the Amusement division. Gross profit improved to ¥15.3 billion, reflecting a higher gross margin of 82% versus 78% in the prior year. Operating profit climbed to ¥11.7 billion, with SG&A costs rising modestly to ¥3.6 billion as marketing spend increased in the online and mobile sectors.
Segment analysis shows Entertainment sales of ¥17.8 billion, Amusement ¥0.6 billion, Real Estate ¥0.3 billion, and Other ¥0.08 billion in Q1 2024, with Entertainment maintaining the largest share at 95%. Regional revenue distribution highlights Japan as the leading market (¥9.1 billion, 49% of total), followed by North America (¥2.7 billion) and Asia excluding Japan (¥6.0 billion). Overseas sales accounted for 51% of total revenue, up from 46% in the previous year.
Capital expenditures totaled ¥789 million for FY2024, with real estate and equipment investments of ¥526 million and ¥263 million respectively. Depreciation expense reached ¥1.6 billion, consistent with prior periods.
The appendix also details major series performance, noting that “Dynasty Warriors” and “Nobunaga’s Ambition” collectively exceed 30 million units sold, while online/mobile titles such as “DEAD OR ALIVE Xtreme Venus Vacation” and “Romance of the Three Kingdoms: Hadou” have sustained multi‑year service periods. Overall, Koei Tecmo demonstrates steady growth across core entertainment offerings, with strategic emphasis on digital and mobile platforms to sustain revenue momentum.
- Koei Tecmo reported Q1 2025 sales of ¥21.4 billion, a significant increase from ¥18.7 billion in Q1 2024, driven by 20% growth in the Entertainment segment and 30% growth in the Amusement division.
- Operating profit reached ¥11.7 billion, supported by an improved gross margin of 82%, up from 78% in the previous year.
- Overseas markets now account for 51% of total revenue, surpassing domestic Japan revenue (49%) for the first time compared to 46% in the prior year.
- The Entertainment segment remains the company's primary revenue driver, contributing 95% of total sales, with core franchises like 'Dynasty Warriors' and 'Nobunaga’s Ambition' maintaining a cumulative lifetime sales volume exceeding 30 million units.
- Strategic investment is shifting toward online and mobile platforms, evidenced by increased SG&A spending on marketing and the sustained performance of long-running titles like 'DEAD OR ALIVE Xtreme Venus Vacation' and 'Romance of the Three Kingdoms: Hadou'.
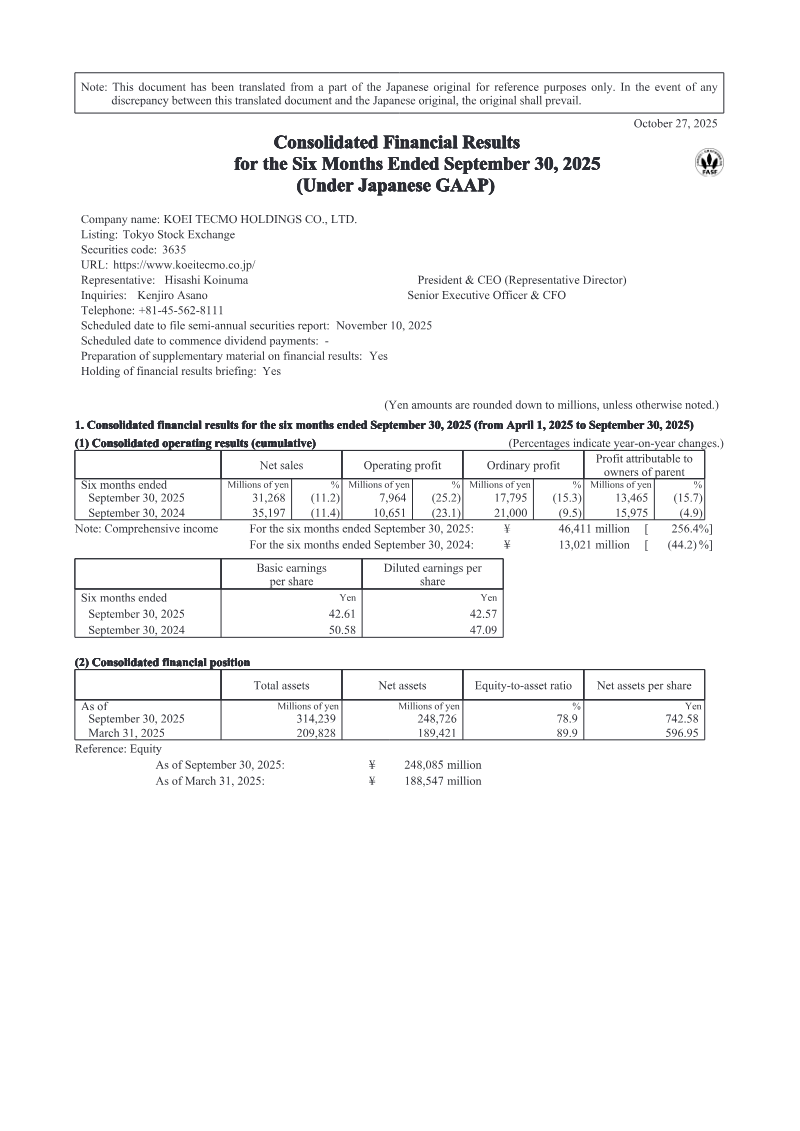
Financial Highlights: 2nd Quarter FY2025
The financial highlights cover the first half of fiscal year 2025 for Koei Tecmo Holdings, a Tokyo‑listed video game and entertainment company. The six‑month period ending September 30 shows net sales of ¥31,268 million, down 11.2% YoY, while operating profit fell 25.2% to ¥7,964 million and ordinary profit declined 15.3% to ¥17,795 million. Comprehensive income surged 256.4%, driven largely by gains on investment securities and derivatives, reaching ¥46,411 million versus a 44.2% loss of ¥13,021 million in the prior year’s half.
Profitability metrics reveal a decline in gross margin from ¥20,593 million to ¥17,238 million and operating margin from 30.6% to 25.4%. Net income attributable to the parent fell 15.7% to ¥13,465 million, with basic earnings per share decreasing from ¥50.58 to ¥42.61. Total assets increased 49% to ¥314,239 million, largely due to a rise in investment securities and cash balances. Net assets grew 31% to ¥248,726 million, with the equity‑to‑asset ratio improving from 89.9% to 78.9%.
The report notes no significant consolidation changes, accounting policy shifts, or restatements. Treasury shares were reduced from 20.25 million to 2.01 million during the period, reflecting a public offering and secondary issuance. Dividend policy remains unchanged, with no cash dividends declared for the first half of FY 2025. The company’s financial position is strengthened by higher liquidity and a solid equity base, but operating performance has weakened relative to the previous year.
- Koei Tecmo Holdings experienced a decline in core operating performance for the first half of FY2025, with net sales falling 11.2% YoY to ¥31,268 million and operating profit dropping 25.2% to ¥7,964 million.
- Comprehensive income surged 256.4% to ¥46,411 million, primarily driven by significant gains from investment securities and derivatives compared to a loss in the same period last year.
- Profitability margins tightened during the six-month period ending September 30, with the operating margin decreasing from 30.6% to 25.4% and net income attributable to the parent falling 15.7% to ¥13,465 million.
- Total assets grew by 49% to ¥314,239 million, supported by increased cash balances and a rise in investment securities, while the equity-to-asset ratio shifted to 78.9%.
- Basic earnings per share declined from ¥50.58 to ¥42.61, reflecting the overall contraction in net income.
FY2025 Third Quarter Financial Highlights: Japan
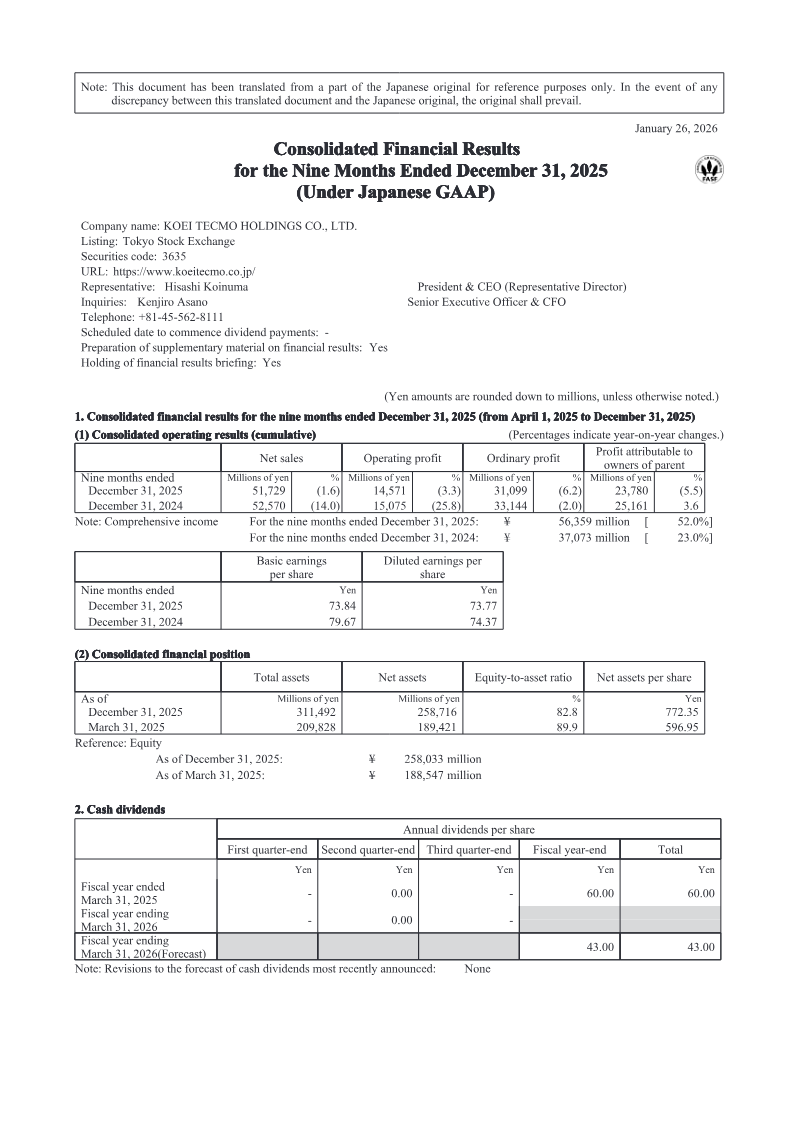
The FY2025 third‑quarter financial highlights for Koei Tecmo Holdings detail a modest decline in core operating metrics while comprehensive income rises sharply. Net sales for the nine months ended December 31, 2025 fell 1.6% to ¥51,729 million from ¥52,570 million in the prior year. Operating profit slipped 3.3% to ¥14,571 million, and ordinary profit decreased 6.2% to ¥31,099 million. Despite these contractions, comprehensive income surged 52.0% year‑on‑year to ¥56,359 million, driven by significant gains in non‑operating items such as interest income and foreign exchange gains. Basic earnings per share declined slightly to ¥73.84 from ¥79.67, reflecting a higher weighted‑average share count due to treasury share disposals and secondary offerings.
Total assets expanded from ¥209,828 million at March 31, 2025 to ¥311,492 million by December 31, 2025, largely through increases in investment securities and property, plant, and equipment. Net assets rose to ¥258,716 million, with the equity‑to‑asset ratio improving to 82.8% from 89.9%. Treasury shares reduced dramatically, lowering the average number of outstanding shares to 322 million from 315 million.
Dividend policy remains unchanged, with a forecast of ¥43.00 per share for the fiscal year ending March 31, 2026, and no revisions to cash dividend forecasts. The report covers Japan‑based operations for FY 2025, presenting consolidated quarterly financial statements without significant changes in consolidation scope or accounting policies.
- Koei Tecmo Holdings reported a 1.6% decline in net sales to ¥51,729 million and a 3.3% drop in operating profit to ¥14,571 million for the nine months ended December 31, 2025.
- Comprehensive income surged 52.0% year-on-year to ¥56,359 million, primarily fueled by non-operating gains from interest income and foreign exchange fluctuations.
- Total assets grew significantly to ¥311,492 million by December 31, 2025, up from ¥209,828 million at the start of the fiscal year, driven by increases in investment securities and property, plant, and equipment.
- Basic earnings per share fell to ¥73.84 from ¥79.67, impacted by an increase in the weighted-average share count following treasury share disposals and secondary offerings.
- The company maintains its dividend forecast at ¥43.00 per share for the fiscal year ending March 31, 2026, with no changes to its current dividend policy.
Consolidated Financial Data: FY2025 3rd Quarter
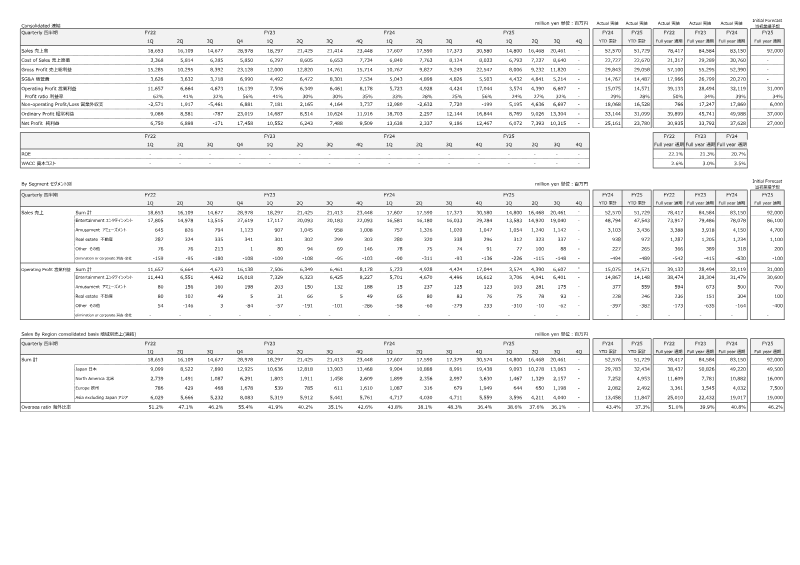
The consolidated financial data for FY2025 third quarter presents a mixed performance across the company’s core segments. Total sales reached ¥30,580 million in Q3 FY25, a 5.4% increase from the same period in FY24 but still below the ¥28,978 million recorded in Q3 FY22. Gross profit improved to ¥22,547 million, up 0.6% YoY, while operating profit fell to ¥17,044 million, a 15.5% decline driven by higher SG&A and cost of sales in the entertainment segment. Net profit for Q3 FY25 stood at ¥12,467 million, a 6.4% YoY increase, supported by a positive non‑operating profit of ¥3,737 million. Profitability ratios show operating margin at 56% and ROE rising to 22.1%, reflecting efficient capital use.
Geographically, Japan remains the largest market with ¥19,438 million in Q3 FY25, followed by North America at ¥3,630 million and Europe at ¥1,949 million. Overseas sales accounted for 51.0% of total revenue in FY25, up from 46.2% in FY24, indicating a strategic shift toward international expansion. The entertainment segment dominated sales at ¥29,284 million (95% of total), with console/PC and online/mobile channels contributing 60.5% and 71.2% of digital sales respectively.
Headcount increased from 2,384 to 2,531 employees by year‑end FY25, a 6.7% rise aligned with new product launches and expanded online services. Capital expenditures for FY25 totaled ¥1,967 million, primarily in real estate and equipment, while depreciation expenses reached ¥1,776 million. The data suggest a focus on sustaining growth through digital monetization and overseas market penetration, while managing cost pressures in traditional entertainment operations.
- Operating profit declined 15.5% YoY to ¥17,044 million in Q3 FY25, primarily due to rising SG&A and cost of sales within the entertainment segment.
- Total sales grew 5.4% YoY to ¥30,580 million, though this figure remains below the ¥28,978 million recorded in Q3 FY22.
- Overseas revenue grew to 51.0% of total sales in FY25, up from 46.2% in FY24, signaling a successful strategic shift toward international market penetration.
- Net profit rose 6.4% YoY to ¥12,467 million, bolstered by a positive non-operating profit of ¥3,737 million.
- The entertainment segment accounts for 95% of total sales, with digital revenue driven by a 60.5% contribution from console/PC channels and 71.2% from online/mobile.
Summary of Q&A: FY2016 4Q GREE Results Briefing
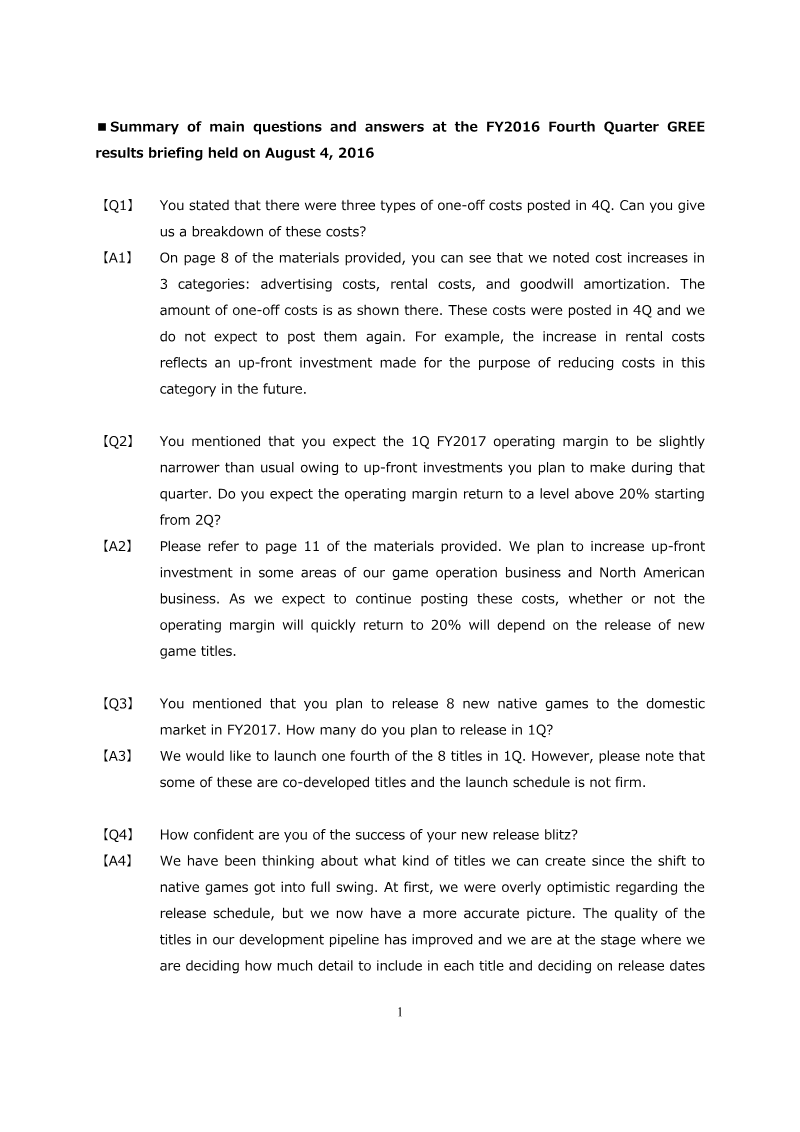
The briefing clarified GREE’s financial and strategic outlook for FY2016–FY2017. One‑off costs in Q4 were broken into advertising, rental and goodwill amortization, with rental increases reflecting upfront investments aimed at future cost reductions. These expenses are not expected to recur. Operating margin for Q1 FY2017 is projected to be slightly below normal due to continued upfront spending, particularly in game operations and North America; a return above 20% is contingent on new title releases. GREE plans to launch eight native games in FY2017, with a quarter‑backed schedule of one‑quarter releases for roughly two titles, though co‑development timelines remain fluid. Confidence in the release blitz has improved as development pipelines mature and release dates are refined based on competitive market conditions.
Strategically, each studio is positioned to leverage core strengths: Wright Flyer focuses on action RPGs and IP integration, while Pokelabo targets GvG titles built on card‑battle expertise. Hit titles are defined by top‑ten App Store rankings in the games category. Financially, GREE aims to use its strengthened capital base to sustain long‑term game development and pursue selective M&A or IP acquisitions, exemplified by the 4Q acquisition of ad‑media firm ADFULLY. The scope covers domestic Japanese markets, with implications for North American expansion, and the time frame spans FY2016 Q4 through FY2017. The briefing relied on internal financial statements and strategic planning documents to outline cost structures, margin expectations, product pipelines, studio focus areas, success metrics, and capital deployment strategies.
- GREE plans to launch eight native games in FY2017, targeting a release cadence of two titles per quarter.
- Operating margins for Q1 FY2017 are expected to remain below 20% due to upfront investments in game operations and North American expansion, with a return to higher margins contingent on new title performance.
- The company defines 'hit titles' as games that achieve top-ten rankings within the App Store games category.
- One-off costs incurred in Q4 FY2016—including advertising, rental, and goodwill amortization—are non-recurring expenses intended to facilitate future cost reductions.
- Studio strategies are specialized: Wright Flyer is focused on action RPGs and IP integration, while Pokelabo is focused on GvG titles leveraging card-battle expertise.