Report
Gaming in Africa 2024
Gaming in Africa 2024 reveals a market that is overwhelmingly mobile‑centric, with 92 % of respondents playing on phones and 81 % using smartphones. Android dominates, accounting for 92 % of downloads from Google Play, while iOS remains a minority. The region’s gamers are highly engaged: 78 % played in the previous day and a third spend three or more hours per session. Puzzle games lead at 40 %, followed by sports and football at 36 %; female players show a particular affinity for puzzles, twice the rate of male gamers. Motivations cluster around entertainment (73 %) and relaxation (64 %), with social interaction and competition also significant drivers. The market is poised for rapid expansion, fueled by a youthful population and high smartphone penetration. In Kenya, mobile‑first economics and widespread mobile money usage create a fertile environment for in‑game purchases. Across the four surveyed countries, 63 % of players have made microtransactions, using credit cards, mobile money, Google Pay or airtime; Kenya’s mobile‑money share exceeds 60 %. Spending patterns show that roughly one‑third of gamers spend $5–10 per month, while 26 % spend less than $2. Barriers include a preference for free titles (47 %) and limited disposable income (44 %). Demand for culturally relevant content is strong, yet 56 % of respondents report no awareness of African‑made games. Support for locally produced titles remains uneven. In Nigeria and South Africa, only 42 %–46 % of respondents care about a game’s origin, with enjoyment as the primary purchase driver for approximately 70 %. Interest in black protagonists is moderate at 38 % overall, dropping to 28 % in Egypt and 33 % in South Africa. These findings underscore a mobile‑driven, youth‑led market with growing appetite for local content but still constrained by payment preferences and awareness gaps.
GeoPoll
Report
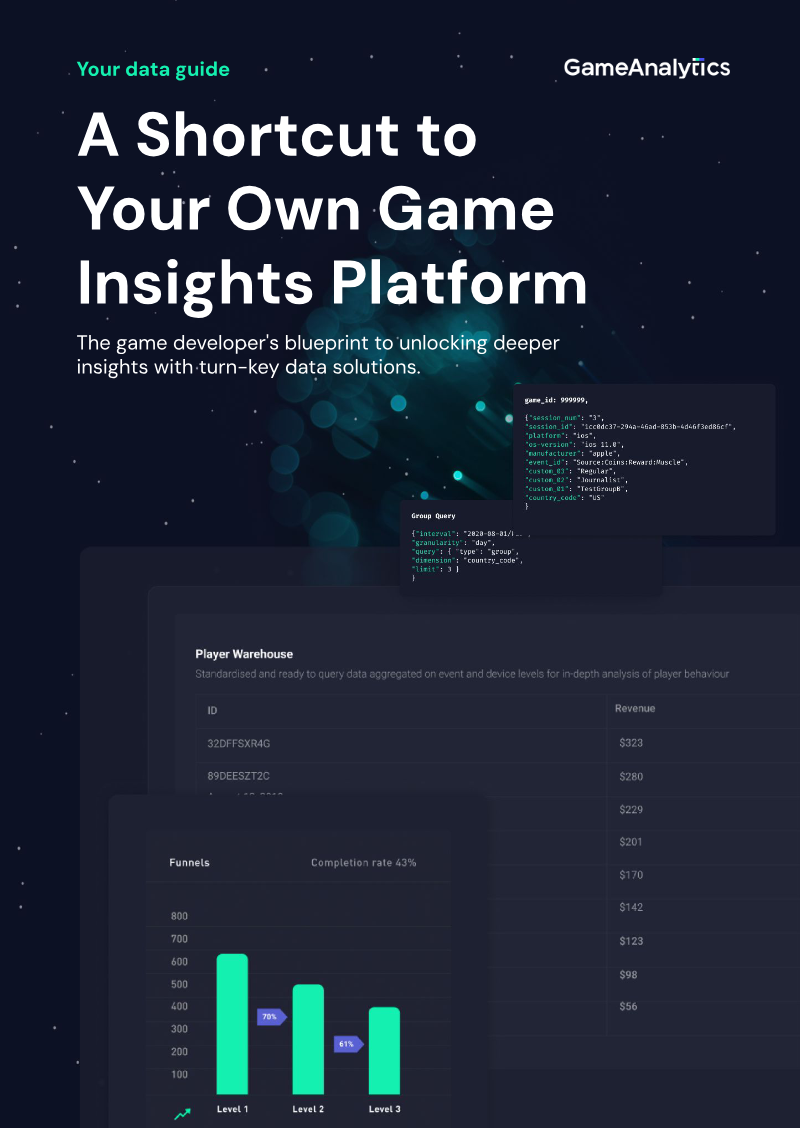
Game Data: Building vs Buying
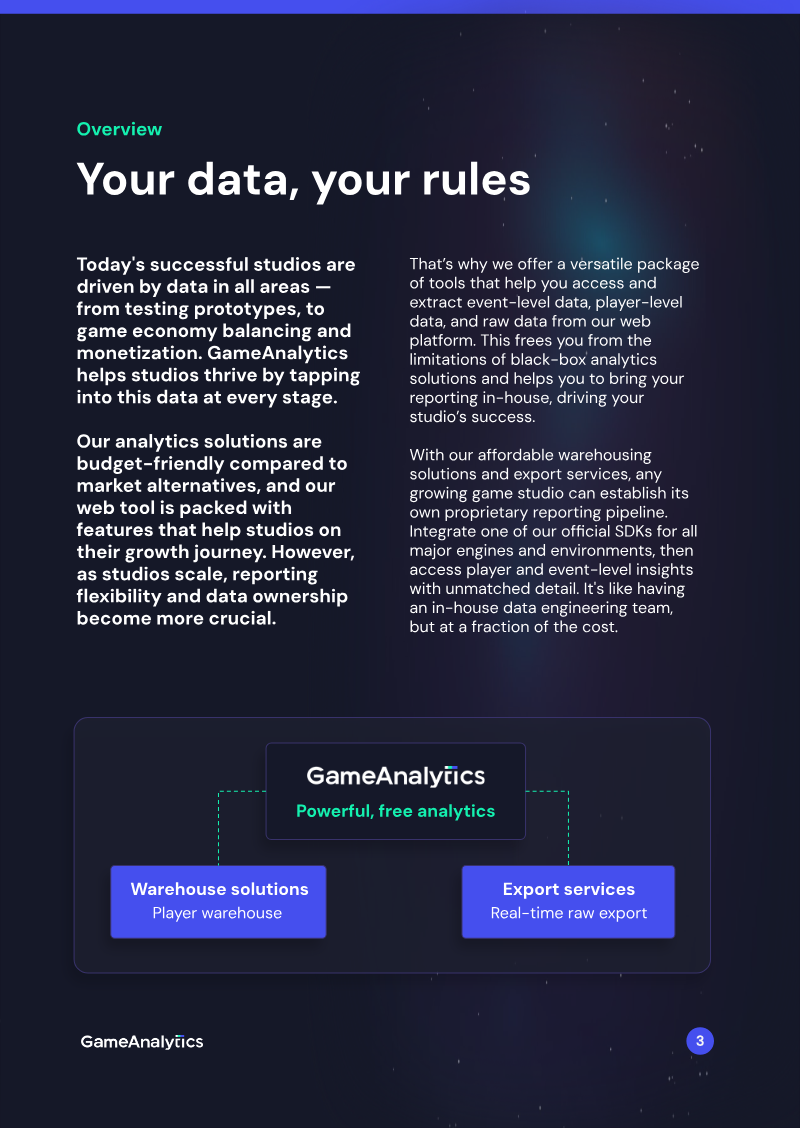
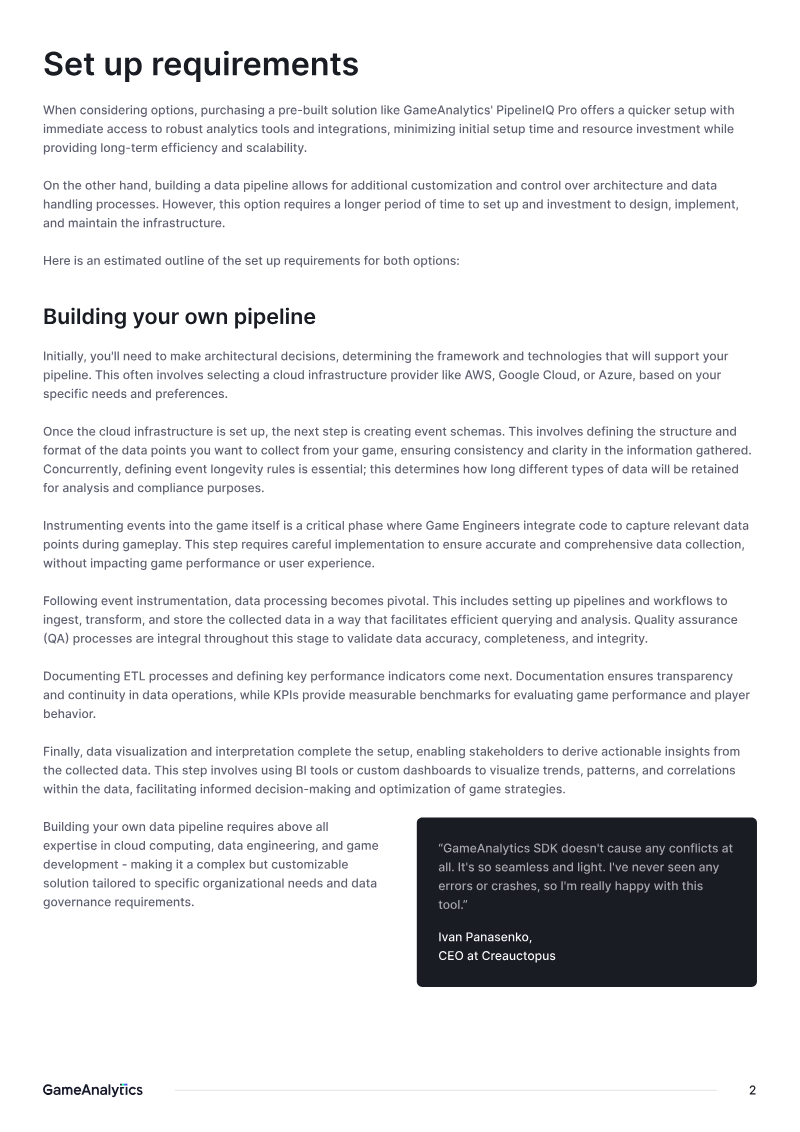
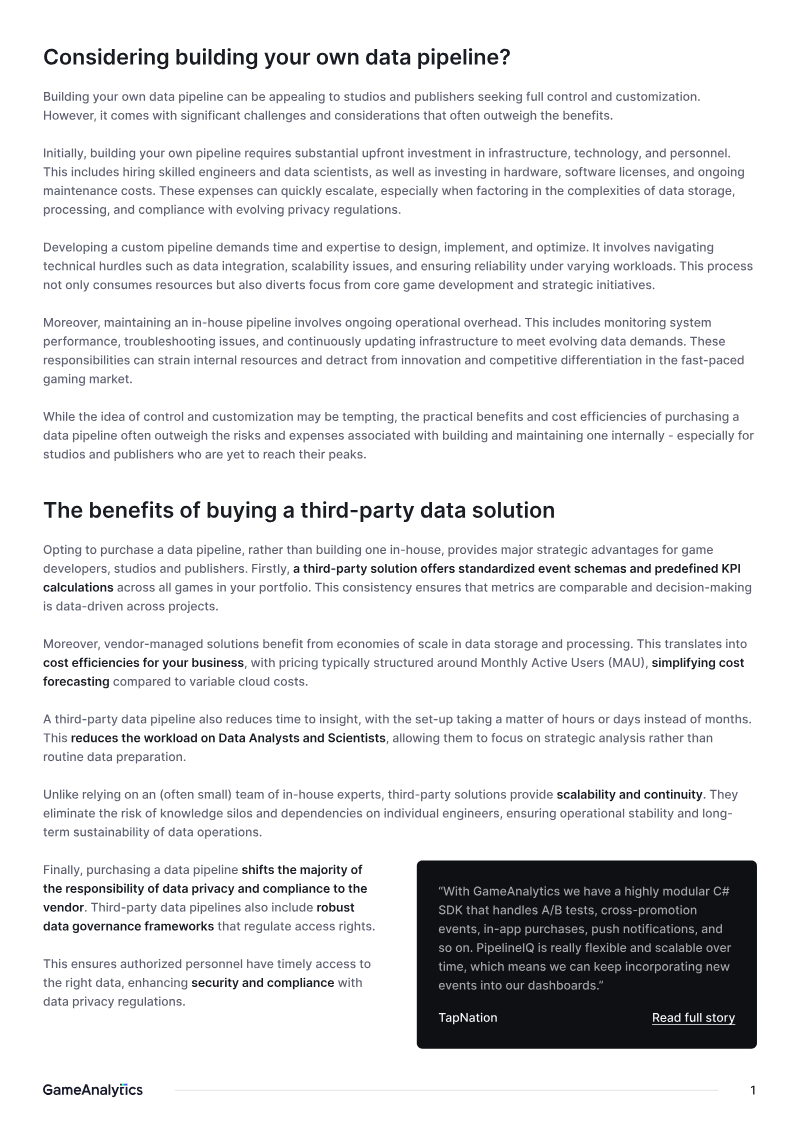
The document evaluates the trade‑offs between building an in‑house data pipeline and purchasing a third‑party solution for game analytics, using GameAnalytics’ PipelineIQ Pro as the primary example. It argues that while custom pipelines offer full control, they demand significant upfront investment in infrastructure, skilled personnel, and ongoing maintenance. The cost of hiring a data team—engineers, scientists, analysts—and cloud services (ingestion, storage, query, visualization) can reach nearly $50 k per month for a mid‑size studio with 5 million MAU, with human capital accounting for 89 % of the expense. In contrast, a vendor‑managed pipeline costs approximately $5.9 k per month, with the same headcount but lower operational overhead; human capital represents 78 % of that budget. The analysis highlights additional benefits of third‑party solutions, such as standardized event schemas, economies of scale in storage, rapid deployment (hours to days versus months), scalability without knowledge silos, and delegated privacy compliance. Methodologically, the comparison uses a hypothetical studio scenario to calculate total cost of ownership (TCO), breaking down monthly allocations into human, storage, query, and visualization costs. Geographic scope is global, with no regional restrictions noted; the time frame covers current market conditions and projected growth. The conclusion favors purchasing a proven pipeline for studios that lack the resources or urgency to build internally, citing lower TCO, faster time‑to‑insight, and reduced risk of technical debt.
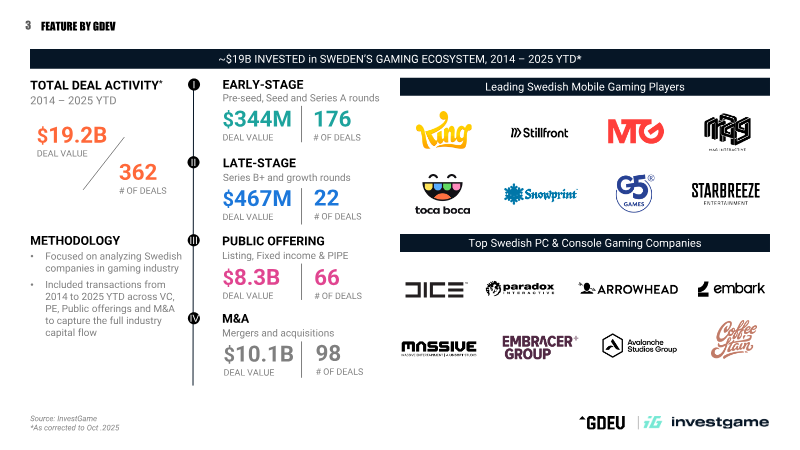
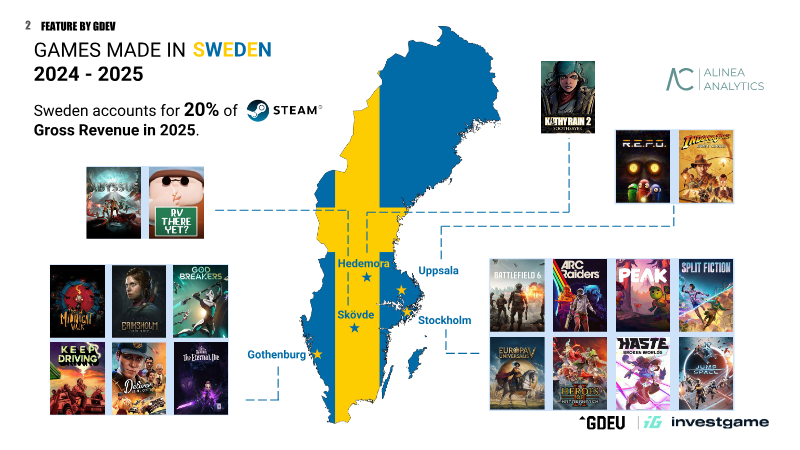
InvestGame