2015
Company
Documents about 2015
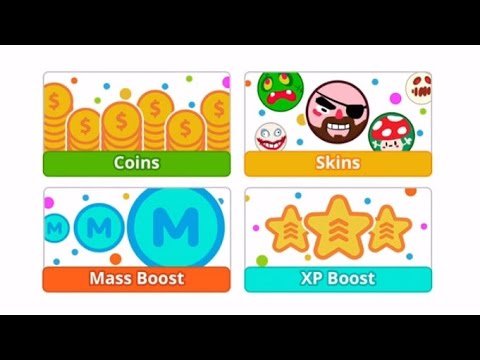
How Miniclip retro-fitted monetization to Agar.io
The mobile adaptation of the web-based sensation Agar.io faced a significant monetization challenge following its initial release as a free-to-play title.
- Miniclip retrofitted a comprehensive monetization framework into Agar.io in November 2015 to transition the viral web hit into a commercially viable mobile product.
- The monetization strategy centers on a virtual currency system that supports rewarded video ads, Tapjoy offer walls, and tiered in-app coin purchases.
- To drive long-term retention and engagement, the game uses a pseudo-VIP system that rewards players with bonus mass and currency for connecting Facebook accounts.
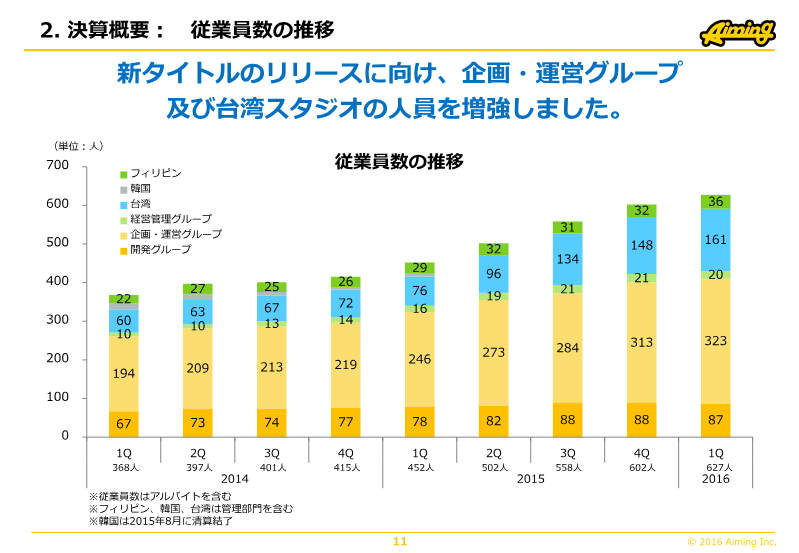

Aiming FY2016 Q1 Financial Results Presentation
Aiming experienced a period of financial contraction during the first quarter of fiscal year 2016, characterized by a year-over-year decline in both revenue and profit.
- Aiming experienced a year-over-year decline in revenue and profit in FY2016 Q1, primarily due to the end of major promotions and contract projects.
- Despite the decline, Aiming exceeded its internal operating profit forecast for FY2016 Q1, achieving 101.9% of its projection.
- The company is currently developing 11 new titles, with a strong focus on the MMO genre, using both proprietary development and licensed IP.
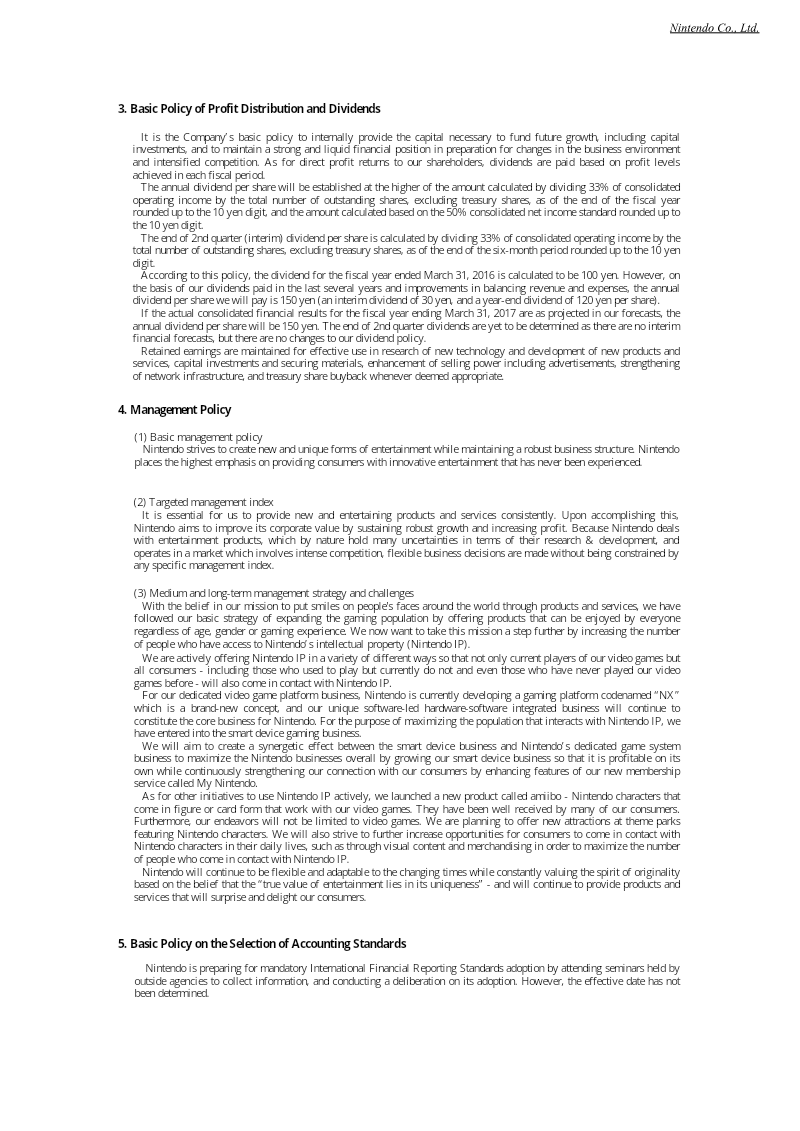
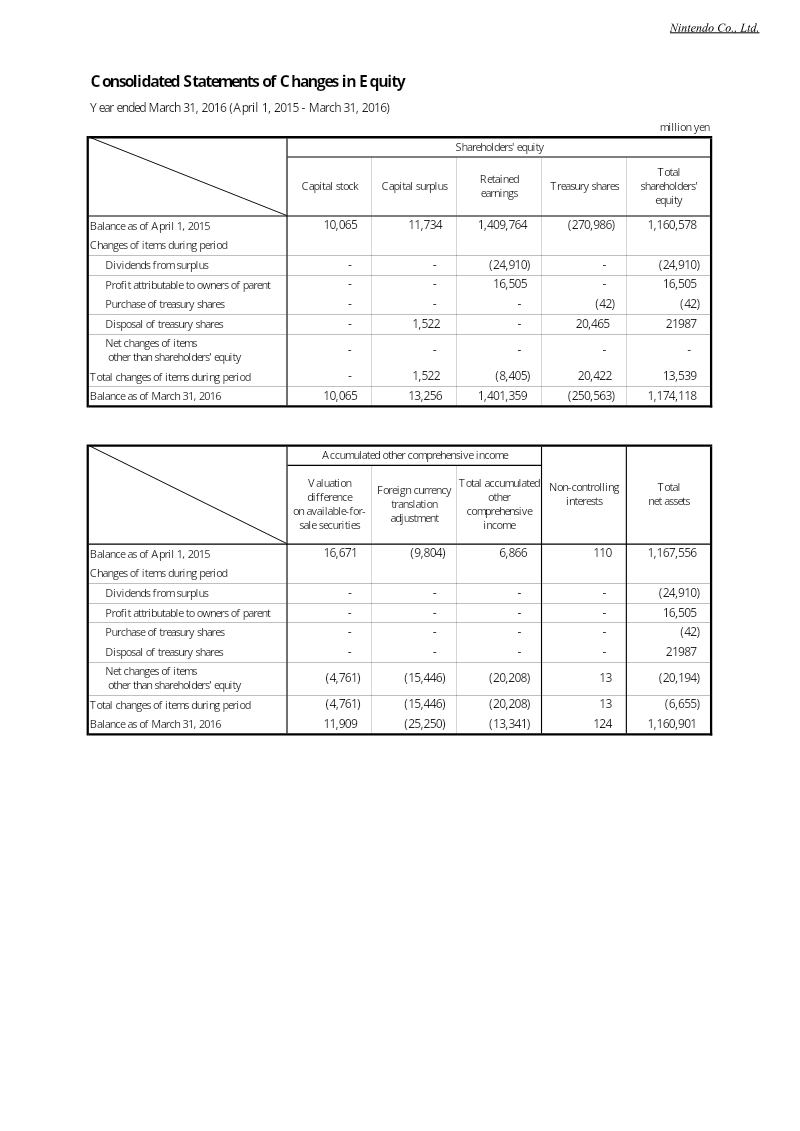
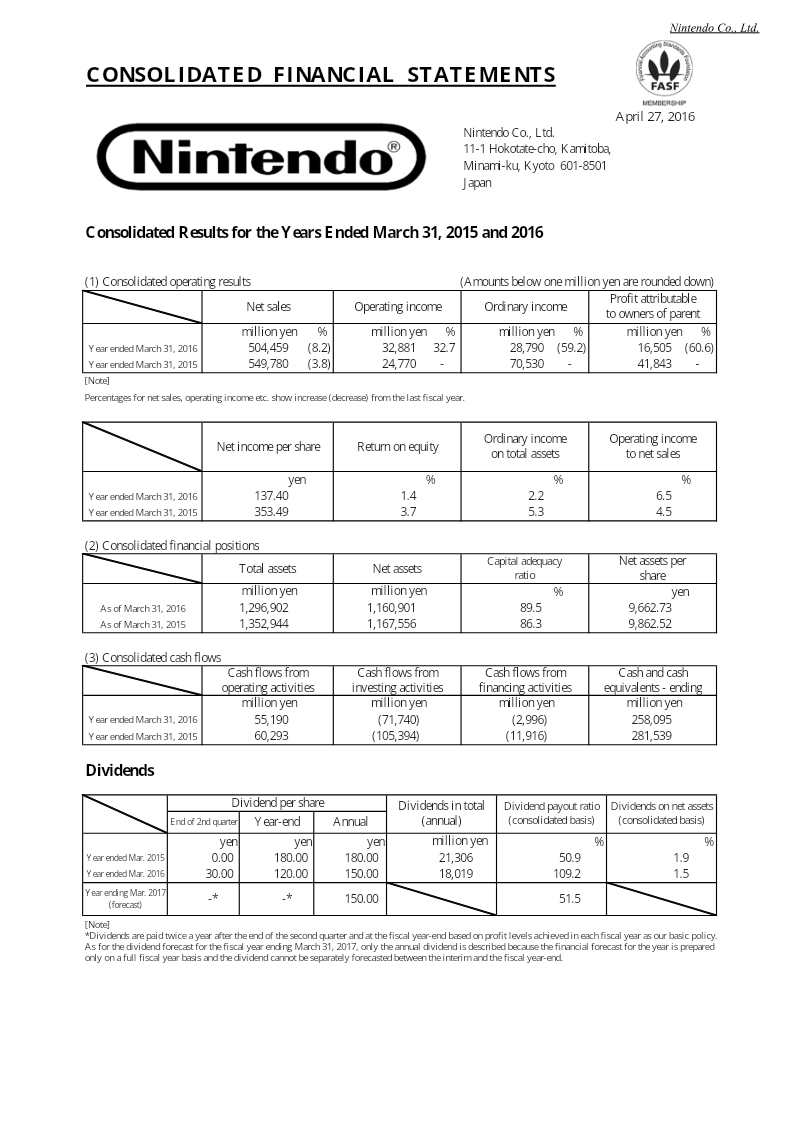
Nintendo Consolidated Results for the Years Ended March 31, 2015 and 2016
Nintendo’s financial performance for the fiscal year ending March 31, 2016, reflects a period of transition characterized by a decline in core hardware and software sales.
- Nintendo's consolidated net sales for the fiscal year ended March 31, 2016 fell to 504.5 billion yen from 549.8 billion yen the prior year, a decline of about 8%, with operating income at 32.8 billion yen.
- The decline is attributed mainly to a lack of major software releases for the 3DS and Wii U, which the company frames as a cyclical lull in its traditional gaming business.
- Nintendo is diversifying beyond dedicated consoles, with an aggressive push into the smart device gaming market and wider use of its intellectual property portfolio.
Mobile Gaming Leaders: March 2016
Supercell's Clash Royale dominated March 2016 mobile game downloads in the United States and worldwide, according to Sensor Tower's Store Intelligence estimates covering March 1 to 31, 2016.
- Supercell’s Clash Royale was the most downloaded mobile game worldwide across both the App Store and Google Play in March 2016, achieving more than double the installs of the second-place title, Stack.
- Global iOS game downloads grew 16% year-over-year in March 2016, rising from 546 million to 633 million, while U.S. iOS game downloads increased 12% to 162 million.
- Miniclip’s Basketball Stars saw significant success on iOS with 6 million worldwide downloads, ranking as the second most successful new title on the U.S. App Store behind Clash Royale.

Gravity Co., Ltd. 20‑F Annual Report for Fiscal Year Ended December 31, 2015
Gravity Co., Ltd. filed a U.S. SEC 20-F for fiscal year 2015, reporting a sharp decline in profitability and revenue concentration around its flagship online title, Ragnarok Online.
- Gravity Co., Ltd. faces significant revenue concentration risk, with 41% of total revenue derived from the aging flagship title Ragnarok Online, which is currently experiencing declining user numbers.
- Despite a 12% decline in total revenue to US$57.5 million, the company reported a net income of US$12.8 million in 2015, reversing a US$20.5 million loss from the previous year.
- Operating losses widened to KRW 17,229 million due to a 29% increase in operating expenses and a KRW 5,849 million impairment loss on intangible assets.

Putting App Store Revenues Into Context
Apple's potential introduction of App Store search ads is often justified on revenue grounds, but that rationale does not hold up against the scale of Apple's business.
- Apple's App Store platform fees generated approximately $4.29 billion in 2014, representing only 1.8% of the company's total $234 billion revenue in 2015.
- Even if Apple successfully monetized App Store search ads at a scale comparable to Facebook's mobile advertising business, the resulting revenue would increase Apple's total annual income by less than 10%.
- Apple uses its 'featuring' placement as a strategic tool to curate cultural phenomena and drive hardware adoption, a lever that would be weakened if prominence were sold to the highest bidder.
Who were the secret App Store winners of 2015?
The analysis of 2015 App Store performance identifies the market’s "hidden winners" by comparing top-grossing rankings against download rankings.
- Publicly traded companies dominate the mobile gaming market, owning 59% of the top 100 grossing titles in the U.S. iPhone market.
- The most profitable games, termed 'hidden winners,' prioritize high monetization efficiency and player retention over the high download volumes seen in mainstream hits like Clash of Clans.
- Slots and Asian-style RPGs are the primary genres that achieve high grossing rankings despite lower install rates, driven by superior average revenue per daily active user.
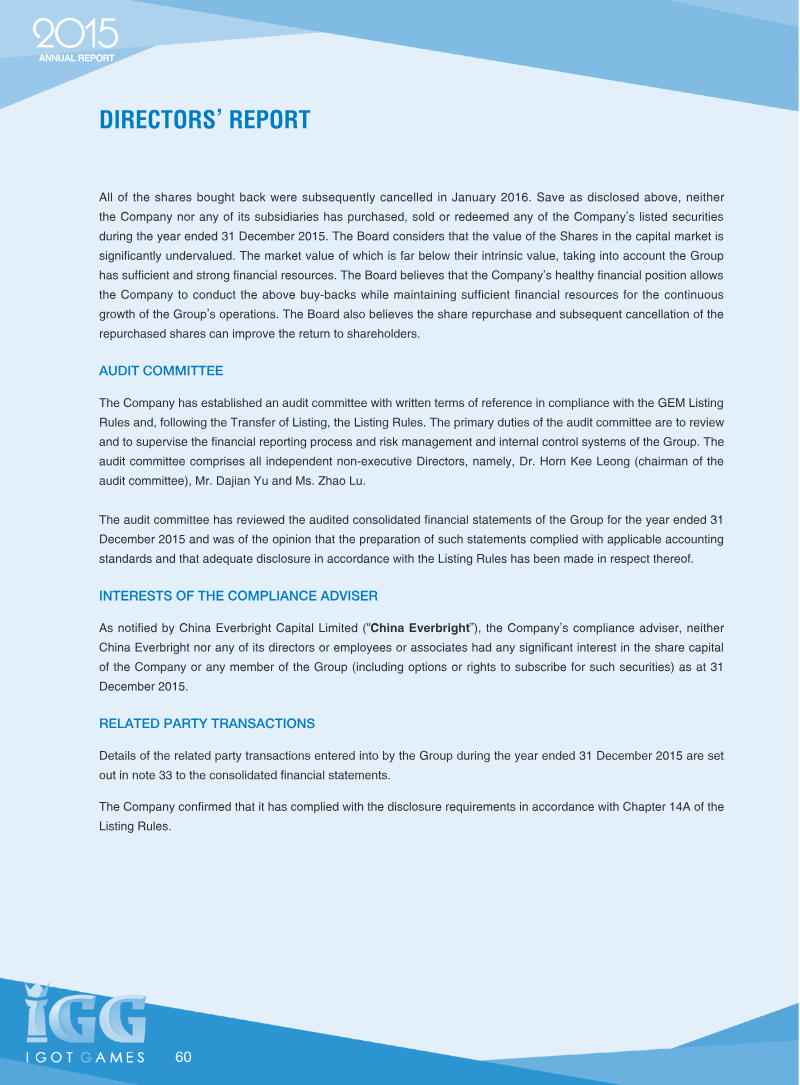
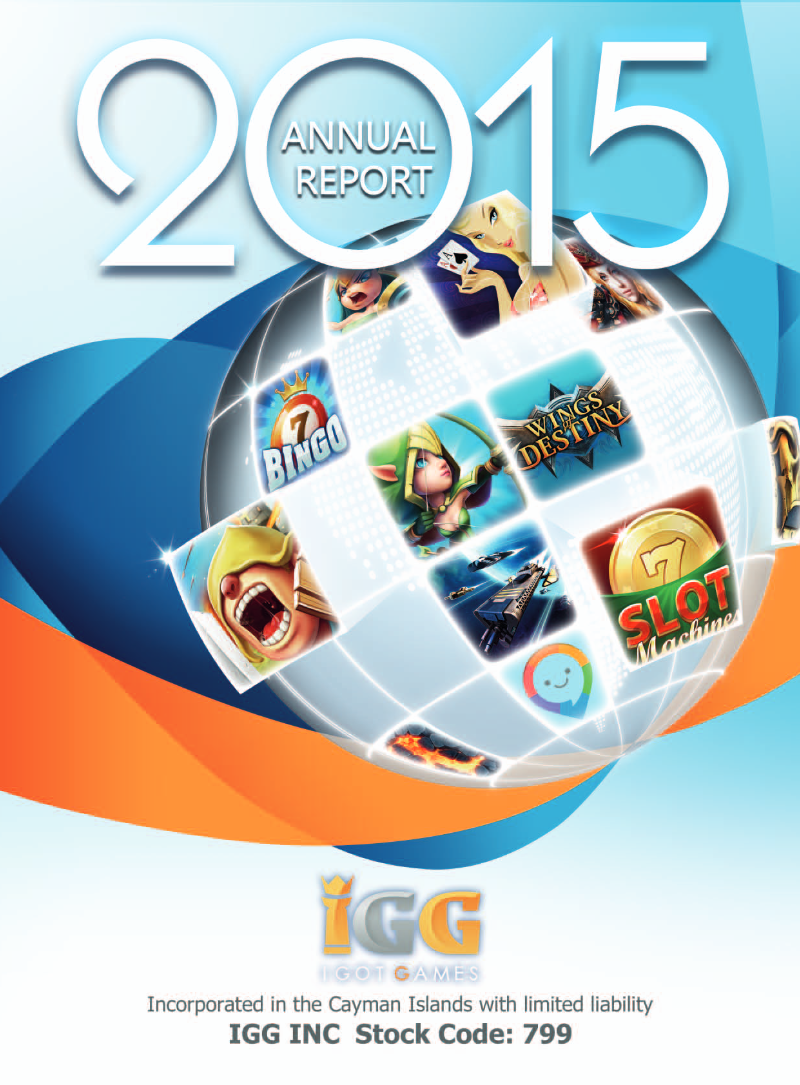
IGG Inc. Annual Report 2015
The 2015 Annual Report for IGG Inc. details a pivotal year of transition and consolidation as the company successfully migrated its listing from the Growth Enterprise Market to the Main Board of the Hong Kong Stock Exchange.
- IGG Inc. successfully transitioned its listing from the Growth Enterprise Market to the Main Board of the Hong Kong Stock Exchange in 2015.
- Mobile gaming became the company's core revenue driver, accounting for 94% of total annual revenue.
- Annual revenue remained stable at US$202.5 million, while net profit declined to US$41.2 million from US$66.4 million due to higher R&D, administrative costs, and new tax regulations.
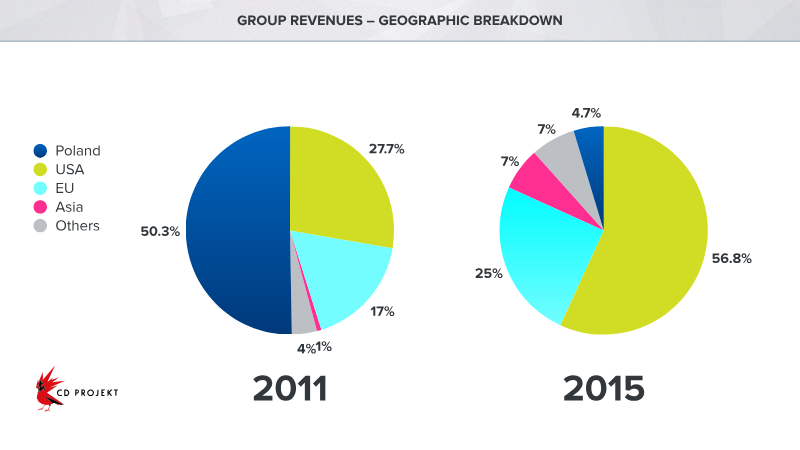
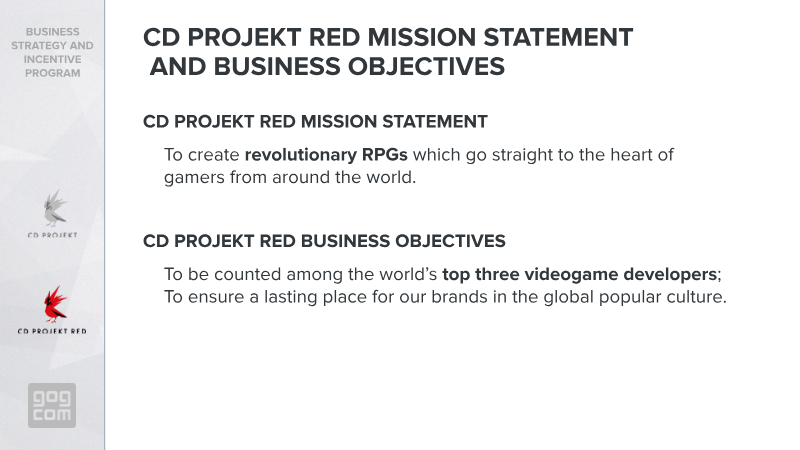
CD PROJEKT Group: 2015 Financial Results and Business Strategy
The CD PROJEKT Group’s 2015 financial summary and 2016–2021 business strategy outline the company’s transition from a successful single-franchise developer to a multi-project global entity.
- CD PROJEKT reported a 2015 net profit of 342.4 million PLN and a year-end cash position of 393.6 million PLN, largely driven by the commercial success of The Witcher 3: Wild Hunt.
- The 2016–2021 strategic roadmap centers on scaling the company into a multi-project developer capable of supporting simultaneous AAA releases, including Cyberpunk 2077 and a second major RPG.
- Digital distribution accounted for 68.4% of total revenue in 2015, signaling a permanent shift in the company's sales model.
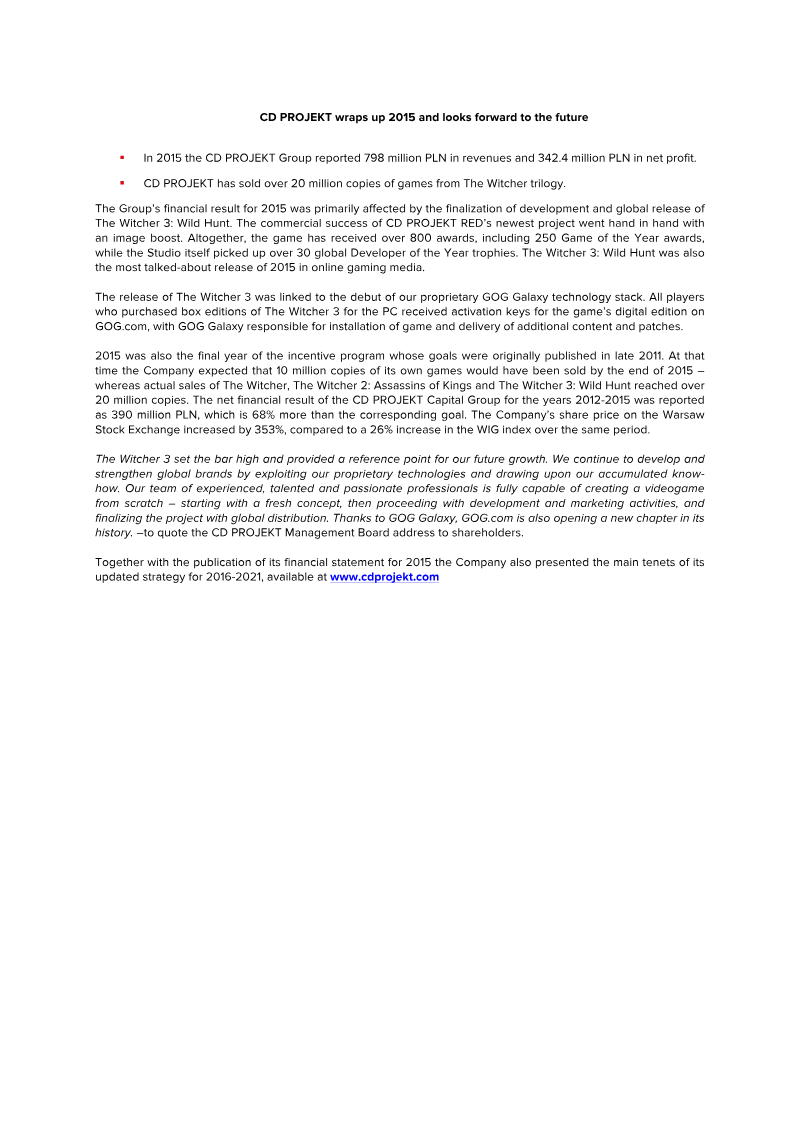
CD PROJEKT FY 2015 Financial Results
The 2015 fiscal year represented a transformative period for the CD PROJEKT Group, driven primarily by the global launch and commercial success of The Witcher 3: Wild Hunt.
- CD PROJEKT recorded 798 million PLN in total revenue and 342.4 million PLN in net profit for fiscal year 2015, driven by the launch of The Witcher 3: Wild Hunt.
- The Witcher trilogy surpassed 20 million cumulative units sold, doubling the company's initial 10-million-unit sales projection established in 2011.
- CD PROJEKT’s share price on the Warsaw Stock Exchange increased by 353% between 2012 and 2015, significantly outperforming the 26% growth of the broader WIG index.
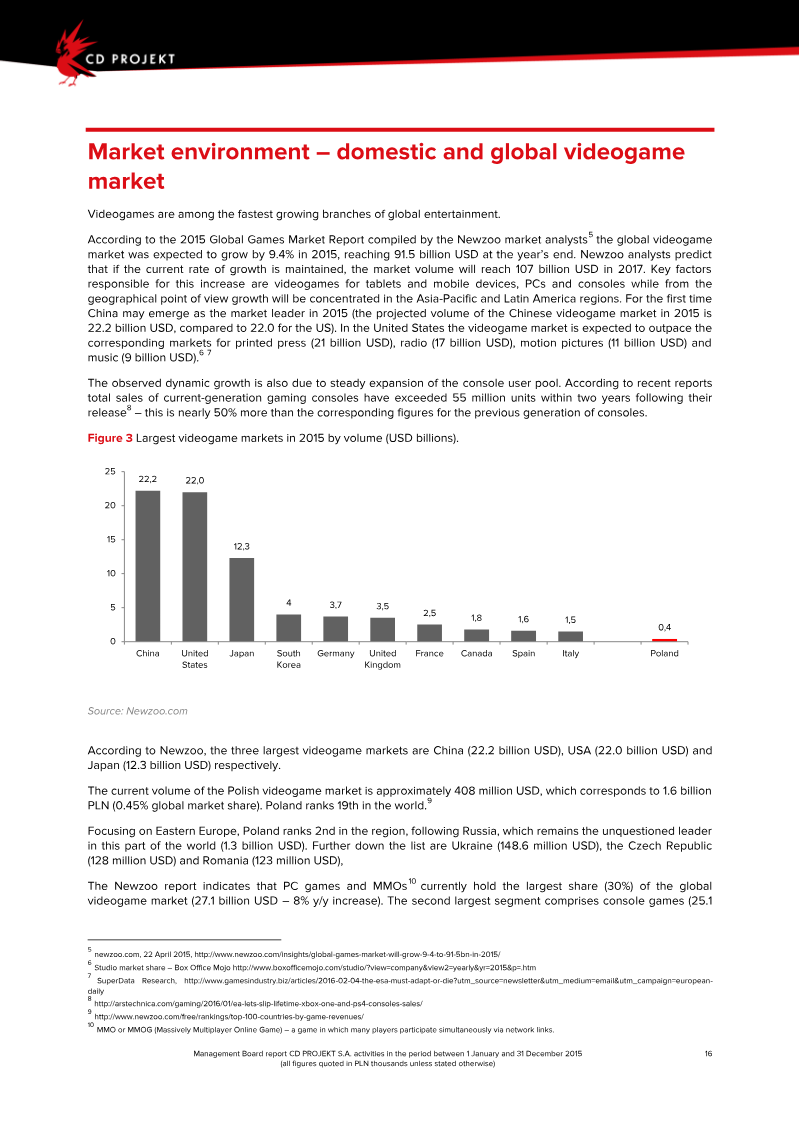
Management Board Report on CD PROJEKT S.A. Activities: 2015
The year 2015 marked a transformative period for CD PROJEKT S.A., characterized by unprecedented financial growth and the global elevation of its brand.
- CD PROJEKT S.A. achieved record 2015 financial results with 698.2 million PLN in sales revenue and a consolidated net profit of 336.2 million PLN, driven by the launch of The Witcher 3: Wild Hunt and its expansion.
- The company ended 2015 with a robust cash position of 366.2 million PLN, zero outstanding debt, and a market capitalization exceeding 2.1 billion PLN, leading to its inclusion in the WIG30 index.
- The organization has transitioned to a two-franchise development model, prioritizing the long-term production of Cyberpunk 2077 alongside its established role-playing game portfolio.
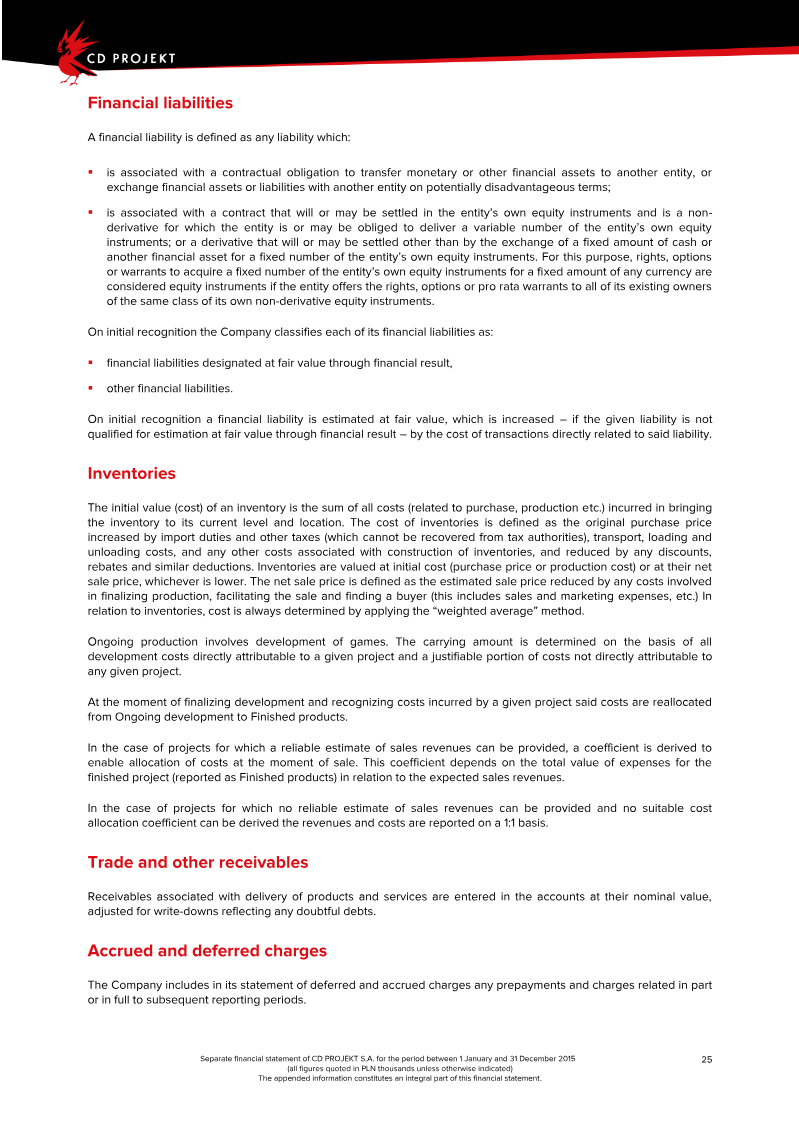
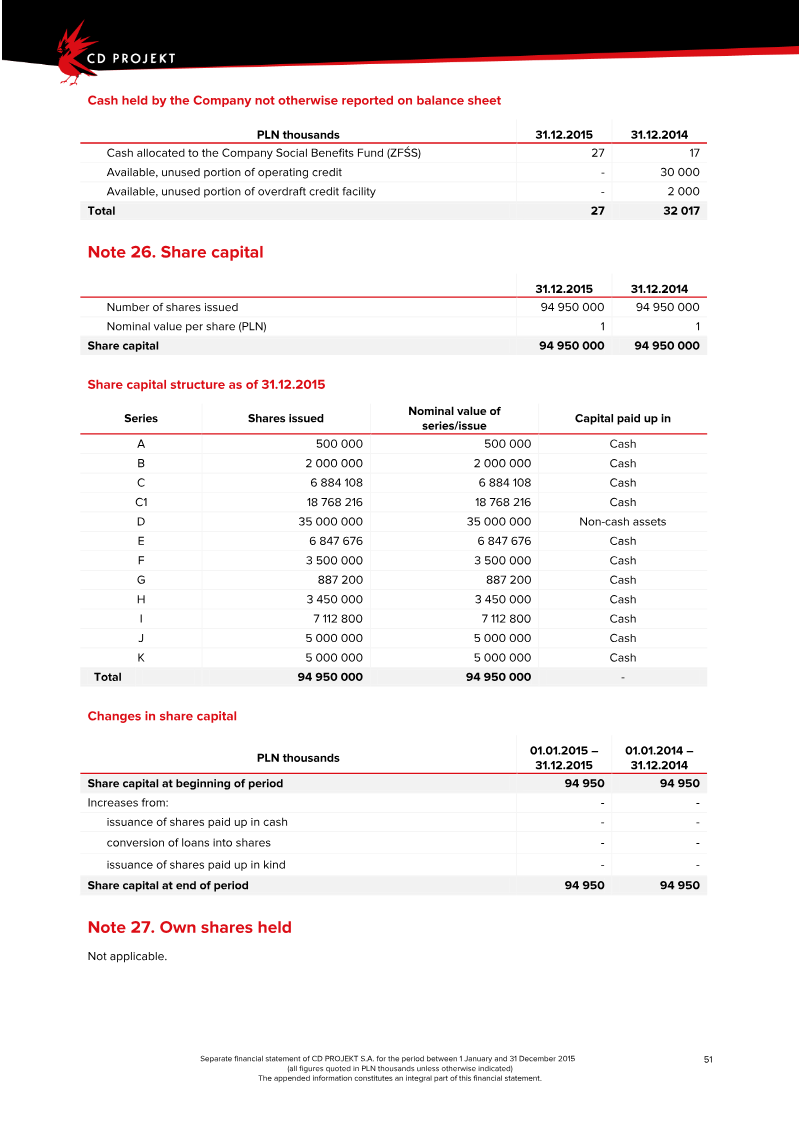
Financial Statement of CD PROJEKT S.A. for the Fiscal Year 2015
The 2015 fiscal year marked a period of profound financial transformation for CD PROJEKT S.A., characterized by a shift from a net loss of 12.4 million PLN in 2014 to a robust net profit of 336.2 million PLN.
- CD PROJEKT S.A. achieved a significant financial turnaround in 2015, moving from a 12.4 million PLN net loss in 2014 to a 336.2 million PLN net profit.
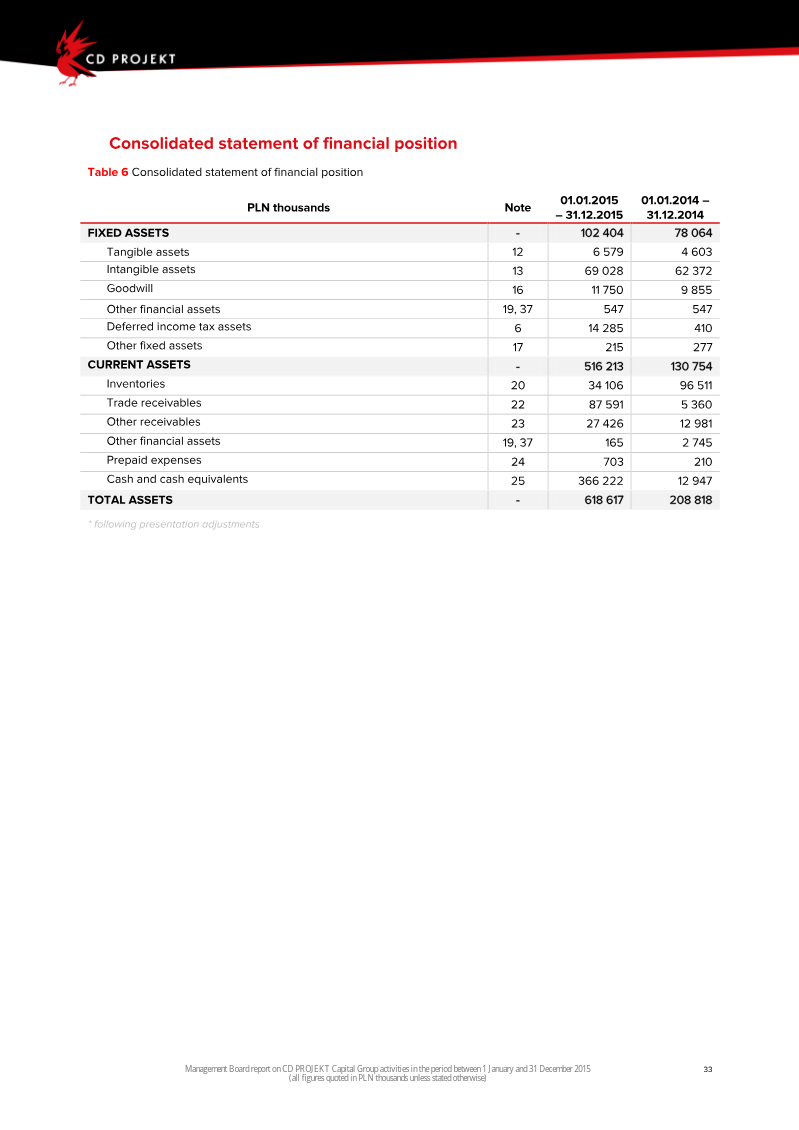
- Annual sales revenue surged to 715.9 million PLN, supported by total assets valued at 618.6 million PLN.
- The company eliminated all outstanding bank credit and loan obligations by the end of 2015, maintaining a liquidity position of 366.2 million PLN in cash and cash equivalents.