1 free read left. Create a free account for unlimited reading + AI research.
Create free account
Who were the secret App Store winners of 2015?
Key insights
6 takeaways- 01The 2015 App Store grossing charts exhibited extreme stability throughout the year, indicating a significant barrier to entry for independent developers.
- 02Publicly traded companies dominate the mobile gaming market, owning 59% of the top 100 grossing titles in the U.S. iPhone market.
- 03Success in the 2015 market was defined by cultivating smaller, highly engaged niche audiences rather than pursuing the broad-market reach required by top-tier chart leaders.
- 04The most profitable games, termed 'hidden winners,' prioritize high monetization efficiency and player retention over the high download volumes seen in mainstream hits like Clash of Clans.
- 05The study methodology identified top performers by calculating a daily score based on the difference between a game's grossing rank and its download rank using year-long RSS feed data.
- 06Slots and Asian-style RPGs are the primary genres that achieve high grossing rankings despite lower install rates, driven by superior average revenue per daily active user.
Ask AI about this video
Transcript
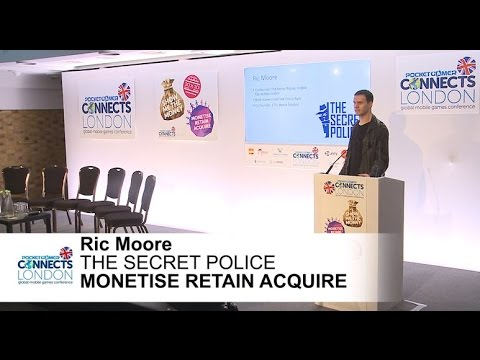
hi yeah I'm here to talk about haha hidden winners of 2015 they're going for the slide so bit about me I've co-founded a new game studio here in London called the secret police prior to that I was making some market Intel which is kind of what I'm talking about today prior to that our CTO and co-founder of Bossa studios so I'm going to give you some insights into the App Store which I gathered from my own kind of data mining techniques so what were the biggest games of 2015 well clash of clans candy crush game of war but we all kind of know this but what I wanted to do was look at what are the biggest games of the whole year the ones which had the best kind of staying power and the ability to sort of keep churning the money day after day so the way I went around doing this was to collect apples charts so Apple have an RSS feed they've
got all the charts 119 countries every single category they've got iphone and ipad and i've written scripts which harvest these charts every two hours twenty-four seven every every day of the year and these have been running for the last two years roughly I'm going to be focusing on the iphone games chart for USA and this is because this is the biggest market and other book markets in the West End to follow it quite closely so what is the top three chart notice it's not called the top free downloads chart and that's because it's not made up of just the downloads Cheers that my voice is gone mmm so so yes so basically it's partly downloads and partly ratings it's hard to figure out quite how the balance stay out and the reason is I think because it stops bad games and sort of bots live games from charting so you haven't seen anything since flappy bird bust into the charts and this is
because Apple have filtered out so games with good ratings and lots of downwards but the only things that you see appear in the charts the other thing they don't state is what kind of time period the charts cover you know one day is it a week we think it's between a one two three days basically and you can kind of guess that based on the rate that's the featured games start appearing in the charts so like I say and I I collect these charts you get the top 200 I store them in a database it runs around the clock so I collect 2920 arts a year on average and what I've done is I've turned the average rank for every game as Jarrod throughout the year to collecting them all and it looks like this pretty unremarkable to be honest because it looks exactly the same as a grossing chart looks today you know not much removing the top much movement at the bottom and if you compare it with where it is now where it was the start
of year and where it wasn't December it's kind of the same some of the things have like swapped the order they're in but it's basically almost the same chart which shows that the staying power of free-to-play games is that they're around for years the two notable ones on here a trivia crack which was a big hit around Christmas last year or two years ago now that's kind of tailed off it's still in the charts but it's around a hundred and on this side is episode which is a kind of choose your own adventure game and that's kind of been one of the big breakthroughs of the year and it's kind of gone a bit unnoticed if you look at the the journalist split of every year is that actually quite diverse I think there's a sort of myth that people think candy crush and game of war and glacier clowns are the kind of dominate and spin-offs of and dominate but actually it's a lot more diverse the market in the West in Asia it's not quite so so diverse action RPGs rule across the board so who are the
biggest publishers 2015 well again probably no surprises there King at the top with six games Zynga NEA with five games and the supercell play Tico glue 103 games but what's notable about all of these companies is they are all publicly owned supercells majority-owned by softbank lady curzon by caesars Fonzie ozone by agree and the rest of all publicly did on the on their own names anyway and this other shows the state of the market in their 2015 and this is how the top 100 grossing games of the year broke down and the majority fifty-nine percent are owned by publicly traded companies so yeah if you're an indie developer trying to break into the chest now just be warned about what you're up against because you're gonna need a lot of money to compete so on to the title of my talk hidden winners what are they well I spend a lot of time on our fanny looking at the rank history of games because i'm a nerd and that's the sort of thing i'd
like to do and what I noticed is in certain games which have a very high grossing rank relative to their download rank so I'll give you two examples here clash of clans isn't a hidden winner because it's download rank is very high and says it's grossing ring when someone is war this is the download rexy the oven g bit and the grossing ranks the blue bit so what i'm looking for is games which have this big blue thing so suggest that that game is making a lot of money giving it's not getting many installs here's a couple more examples so brave frontier this is real data from from a panty it kind of has an average download rank of 1100 which is like pretty lowdown consuming it's got a grossing rank of 50 another example hit rich my zinger this is over whole year using real data similar sort of download rack for the whole year and grossing rank even higher authority so what i wanted to be able to do was work out a way of plucking out all these games from
from itunes or app store and work out which ones do this the best so how do i do this quite simply for each day i work out a score which is the grossing rank minus the band we drank sell up these scores over the selected time period and then great to chart for each of the games that exist in the app store so it's a simple method here's an example of how i do so in a saturday the ninth of January had to download bank of 1180 brief and hit it and bracing like a 34 subtract that that's the score for that day and so I've done this over the entire year for every single game in the app store here's what it looks like so as you can see it goes slots slots slots slots slots slots JRPG slots poker slots slots etc so it's kind of split into two
so the very top seems to be mostly slots games and then you get these asian RPG slow it down so we've got some minutes war heroes charge puzzle quest puzzle & Dragons pet rescue saga is the odd one out and there but then lower down the chart it kind of it just gets a bit mixed and meshed so what does this mean what is its telling us well top the top 20 are dominated by those two joiners and what it applies is they have very high retention and very good monetization so these these games are keeping players in for a very long time and they're taking a lot of money off them which is to say their average revenue per daily average is 0 the daily active user is very high and these tend to be niche games which is reflected in the fact that they're not in the top 10 and that's because they've got a just a smaller audience so that's why these games are the hidden winners and that's the end of my talk and we're hiring and raising money so if anyone wants to talk to me also if you want to see a more
detailed version of these results go to my twitter @ underscore rick moore and there's a link to a Google Doc with all the stuffing thank you any questions you coming to me all the time billion okay so does anyone have any questions about data over we got a the microphone you just say who you are where you're from that'd be great hi my name is Dan bergen I'm from Sega I'm curious what does that chart look like if you eliminate all of the casino and slot games from it uh well actually have charts for every single category so you can you can drill into those but if you go to basically go to my Twitter account you can see the stuff lower down it gets a bit mixed up it's hard to sort of say the other thing I should state if you wait the right thanks and turn it into actual download figures it changes a bit and that's because the way it follows the power law so the stuff in the top 10 is like
exponentially more sort of a higher figures than the later stuff and then it's a long tail so stuff in the top 10 will skew it and when you weight it the top 10 grossing chart kind of mirrors jumps to the top my chart so that's less interesting you do it that way I David Bailey 14 fish um yeah was you've organized it there by genre were there any other themes which seemed to cross those top games I think that because right there you've gone like casino or RP towards or anything else that kind of stood out as a theme in the top ones not really I mean those those are the categories as defined by the developer in the app store no it's just it's hard to say whether monetized or anything like that well they all they all minor ties in very well and that's kind of why
they're there that's the common theme
Summary
The analysis of 2015 App Store performance identifies the market’s "hidden winners" by comparing top-grossing rankings against download rankings. By harvesting Apple’s RSS feed data every two hours for the entire year, the study focuses on the United States iPhone market to determine which games demonstrate superior monetization efficiency and long-term player retention rather than mere download volume. The methodology involves calculating a daily score for every game by subtracting its download rank from its grossing rank, revealing which titles generate significant revenue despite lower install rates.
The findings indicate that the mobile gaming market is heavily consolidated, with 59% of the top 100 grossing games owned by publicly traded companies. While high-profile titles like Clash of Clans and Candy Crush dominate public perception, the data reveals a more diverse landscape beneath the surface. The "hidden winners"—games with high grossing ranks relative to their download positions—are predominantly found within the slots and Asian-style RPG genres. These titles succeed by maintaining high average revenue per daily active user and strong retention within niche player bases, rather than relying on the massive, broad-market reach required by top-tier chart leaders.
The research concludes that the App Store market is characterized by extreme stability, with top-grossing charts showing little movement throughout the year. This environment presents a significant barrier to entry for independent developers, who must compete against well-capitalized, publicly owned publishers. Ultimately, the study highlights that while download-heavy games capture the most attention, the most profitable games are often those that cultivate smaller, highly engaged audiences through specialized mechanics, particularly in the casino and RPG categories.







Comments