Market Analysis
Documents
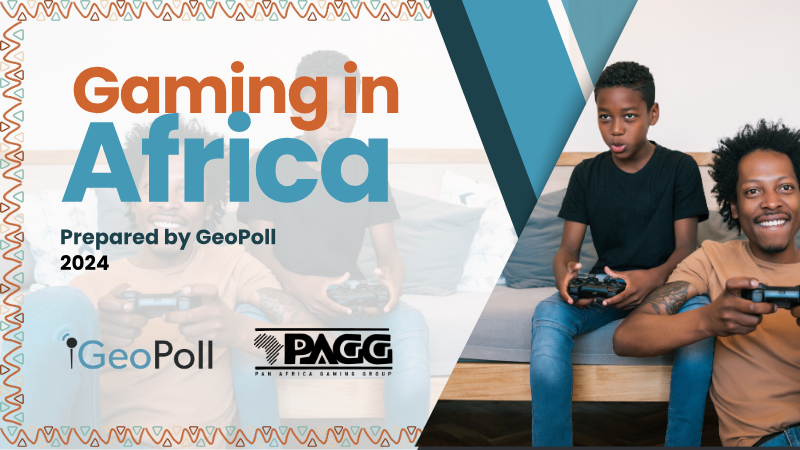
Gaming in Africa 2024
Gaming in Africa 2024 reveals a market that is overwhelmingly mobile‑centric, with 92 % of respondents playing on phones and 81 % using smartphones. Android dominates, accounting for 92 % of downloads from Google Play, while iOS remains a minority. The region’s gamers are highly engaged: 78 % played in the previous day and a third spend three or more hours per session. Puzzle games lead at 40 %, followed by sports and football at 36 %; female players show a particular affinity for puzzles, twice the rate of male gamers. Motivations cluster around entertainment (73 %) and relaxation (64 %), with social interaction and competition also significant drivers.
The market is poised for rapid expansion, fueled by a youthful population and high smartphone penetration. In Kenya, mobile‑first economics and widespread mobile money usage create a fertile environment for in‑game purchases. Across the four surveyed countries, 63 % of players have made microtransactions, using credit cards, mobile money, Google Pay or airtime; Kenya’s mobile‑money share exceeds 60 %. Spending patterns show that roughly one‑third of gamers spend $5–10 per month, while 26 % spend less than $2. Barriers include a preference for free titles (47 %) and limited disposable income (44 %). Demand for culturally relevant content is strong, yet 56 % of respondents report no awareness of African‑made games.
Support for locally produced titles remains uneven. In Nigeria and South Africa, only 42 %–46 % of respondents care about a game’s origin, with enjoyment as the primary purchase driver for approximately 70 %. Interest in black protagonists is moderate at 38 % overall, dropping to 28 % in Egypt and 33 % in South Africa. These findings underscore a mobile‑driven, youth‑led market with growing appetite for local content but still constrained by payment preferences and awareness gaps.
- The African gaming market is overwhelmingly mobile-centric, with 92% of users playing on phones and Android devices accounting for 92% of all downloads.
- Monetization is driven by microtransactions, utilized by 63% of players, with Kenya serving as a key market where mobile money accounts for over 60% of payment methods.
- Player engagement is high, as 78% of respondents played within the last day and one-third of gamers spend three or more hours per session.
- Puzzle games are the most popular genre at 40%, followed by sports and football at 36%, with female gamers showing a preference for puzzles at twice the rate of male gamers.
- Spending is modest but consistent, with roughly one-third of gamers spending $5–10 monthly, though 47% of players prioritize free-to-play titles due to limited disposable income.

Game Data: Building vs Buying
The document evaluates the trade‑offs between building an in‑house data pipeline and purchasing a third‑party solution for game analytics, using GameAnalytics’ PipelineIQ Pro as the primary example. It argues that while custom pipelines offer full control, they demand significant upfront investment in infrastructure, skilled personnel, and ongoing maintenance. The cost of hiring a data team—engineers, scientists, analysts—and cloud services (ingestion, storage, query, visualization) can reach nearly $50 k per month for a mid‑size studio with 5 million MAU, with human capital accounting for 89 % of the expense. In contrast, a vendor‑managed pipeline costs approximately $5.9 k per month, with the same headcount but lower operational overhead; human capital represents 78 % of that budget. The analysis highlights additional benefits of third‑party solutions, such as standardized event schemas, economies of scale in storage, rapid deployment (hours to days versus months), scalability without knowledge silos, and delegated privacy compliance. Methodologically, the comparison uses a hypothetical studio scenario to calculate total cost of ownership (TCO), breaking down monthly allocations into human, storage, query, and visualization costs. Geographic scope is global, with no regional restrictions noted; the time frame covers current market conditions and projected growth. The conclusion favors purchasing a proven pipeline for studios that lack the resources or urgency to build internally, citing lower TCO, faster time‑to‑insight, and reduced risk of technical debt.
- Building an in-house data pipeline for a studio with 5 million MAU costs approximately $50,000 per month, compared to $5,900 per month for a third-party solution like GameAnalytics’ PipelineIQ Pro.
- Human capital is the primary cost driver for both approaches, accounting for 89% of the budget for in-house builds and 78% for vendor-managed pipelines.
- Third-party solutions offer significantly faster deployment timelines, ranging from hours to days, whereas custom in-house pipelines typically require months to implement.
- Purchasing a proven pipeline reduces the risk of technical debt and eliminates knowledge silos that often occur when studios rely on internal engineering teams to maintain custom infrastructure.
- Vendor-managed solutions provide operational advantages including standardized event schemas, economies of scale in storage, and delegated responsibility for privacy compliance.
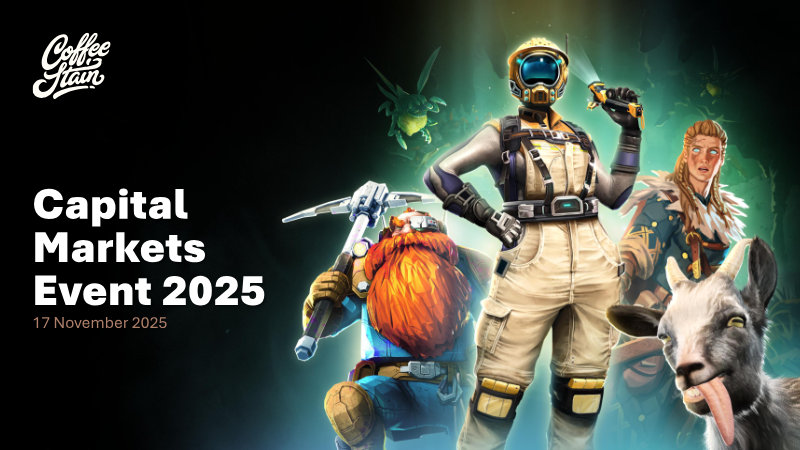
Capital Markets Event 2025: Coffee Stain Group
Capital Markets Event 2025 showcases the Coffee Stain Group’s strategy of building a portfolio around small, autonomous teams that prioritize gameplay quality and community engagement. Ninety percent of net sales derive from a handful of flagship titles—most notably Goat Simulator, Deep Rock Galactic and Satisfactory—which consistently achieve high review scores (above 96 %) and generate lifetime sales up to SEK 2 bn. The company’s partnership model, publishing and investing in niche‑focused games, sustains long‑term value through continuous content updates and a symbiotic developer‑player relationship.
The global gaming market is projected to grow at 3 % CAGR across all platforms, driven by rising consumer spend and the expansion of Steam, mobile, Game Pass and PlayStation Plus. Despite saturation and increased competition for player attention, Coffee Stain maintains a strong presence; its titles enjoy high review counts (over 500 k for Goat Simulator) and retain players through regular updates, platform expansions and community‑driven development. Innovation, creative gameplay and long‑term support are core to the firm’s approach.
Strategic collaborations reinforce this model. The partnership with Tuxedo Labs leverages the proprietary Teardown physics engine, producing a highly engaged community (10 000+ mods, 20 major updates) and peak concurrent users of 60 k for Deep Rock Galactic seasons. The studio’s headcount grew from six to 47 FTEs over five years, illustrating the scalability of open development and a “make happy decisions” culture that drives both critical acclaim (e.g., 9.5/10 reviews) and commercial success.
Coffee Stain’s Roblox title, Welcome to Bloxburg, exemplifies a successful free‑to‑play transition. With 791 k daily active users and SEK 1.35 bn in lifetime net sales, the monetization mix of currency purchases, optional unlocks and a premium subscription maintains a non‑pay‑to‑win stance while rebuilding player trust. The company’s lean cost base and strong cash generation are amplified by launch‑driven sales spikes from new content releases and strategic stakes such as its 30 % share in Iron Gate’s Valheim publishing.
Financially, the group reports a net‑sales CAGR of 34 % to SEK 1.2 bn and a cash EBIT margin of 44 %. Cash reserves reach SEK 472 m in 2025, with no external debt, providing flexibility for capital allocation and potential M&A. The lean, autonomous team model underpins low overheads, high cash conversion (≈120 %) and a focus on developing existing IPs while selectively pursuing new opportunities across platforms and partnerships.
- Coffee Stain Group maintains strong financial health with a 34% net-sales CAGR to SEK 1.2 bn, a 44% cash EBIT margin, and 120% cash conversion.
- The company holds SEK 472 m in cash reserves with zero external debt, providing significant flexibility for future M&A and capital allocation.
- Ninety percent of net sales are generated by a core portfolio of flagship titles—Goat Simulator, Deep Rock Galactic, and Satisfactory—which consistently maintain review scores above 96%.
- The Roblox title Welcome to Bloxburg has achieved 791,000 daily active users and SEK 1.35 bn in lifetime net sales following its transition to a free-to-play model.
- Strategic partnerships and investments, such as a 30% stake in Valheim publisher Iron Gate and the collaboration with Tuxedo Labs, serve as key drivers for long-term value and IP expansion.
The Rise and Reset of Sweden's $19B Gaming Capital Machine
The analysis demonstrates that Sweden’s gaming sector has evolved into a $19 billion capital ecosystem, with 1,100 companies and 202 firms engaging in tracked transactions since 2014. Sweden contributes roughly 20 % of Steam’s projected 2025 gross revenue, and its developers produced five of the platform’s global top‑10 bestsellers in 2024–25. Capital flows have shifted from early‑stage seed rounds to late‑stage growth and acquisition deals, reflecting a maturation of the pipeline. Private investment rebounded in 2024 after a pullback; late‑stage rounds now dominate, with Aonic’s $157 million growth round and Arrowhead’s $80 million investment illustrating investor preference for studios with proven commercial traction. Early‑stage deal counts have normalized from 2021’s peak, indicating a steady but active pipeline.
M&A activity peaked in 2021–22, with ESL’s $1.05 billion sale to Savvy marking the cycle’s apex; subsequent deals have become more selective. Three transactions—King ($5.9 billion), Mojang ($2.5 billion), and ESL ($1.05 billion)—account for 93 % of total M&A value, underscoring the premium paid by global acquirers for Sweden’s IP and engineering talent. Public market activity has shifted from equity‑fueled growth to defensive debt financing; Embracer’s $4.4 billion raised through fixed income and PIPE in 2020–22 exemplifies this trend. Capital concentration is high, with the top ten private rounds comprising over $495 million of an $811 million total.
The data, sourced from InvestGame and market‑cap records through December 2025, cover Sweden’s entire gaming industry—mobile, PC & console, VR/AR, esports, and platforms—from 2014 to the present. Methodology includes tracking VC rounds, public offerings, PIPEs, and M&A transactions across all segments. The findings illustrate a resilient ecosystem that has transitioned from early‑stage bootstrapping to mature, high‑value capital flows driven by proven studios and strategic consolidation.
- Sweden’s gaming sector has matured into a $19 billion ecosystem comprising 1,100 companies, with Swedish developers producing five of Steam’s global top-10 bestsellers in 2024–25.
- Swedish studios contribute approximately 20% of Steam’s projected 2025 gross revenue, cementing the country's status as a dominant global gaming hub.
- M&A activity is highly concentrated, with three major deals—King ($5.9 billion), Mojang ($2.5 billion), and ESL ($1.05 billion)—accounting for 93% of the total transaction value.
- Investment trends have shifted toward late-stage growth, evidenced by significant 2024 capital injections such as Aonic’s $157 million round and Arrowhead’s $80 million investment.
- Capital concentration remains high, as the top ten private funding rounds account for $495 million of the $811 million total tracked investment.
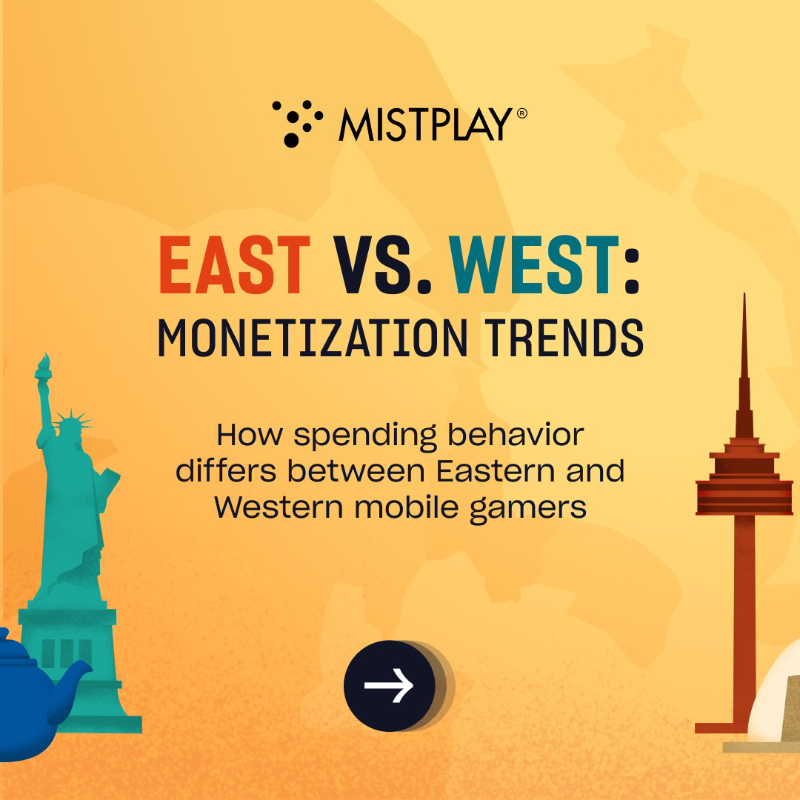
East vs. West: Monetization Trends
The study examines how mobile gaming spending patterns differ between Eastern and Western markets, focusing on frequency of purchases, average spend per transaction, and motivational drivers. Findings reveal that Eastern gamers purchase in‑app items more often than Western players; 35 % of East spend frequently versus 36 % in the West, with a higher proportion of occasional and rare spenders in the West. When it comes to transaction size, Eastern users tend to pay more per purchase: 76 % spend over $10 compared with only 42 % of Western users, while a smaller share of East spend under $5 (30 %) versus 8 % in the West. Motivational analysis shows that Western gamers prioritize value and bundles, whereas Eastern players are more attracted to exclusivity, limited‑time items, new offers, and character acquisition. The research covers key markets in Asia—Korea and Japan—and Western regions including the United States, United Kingdom, and broader Europe. Data were collected through a survey of mobile gamers across these regions, with sample sizes sufficient to compare spending behaviors and motivations. The report concludes that monetization strategies should be tailored regionally: value‑based bundles may resonate better in the West, while exclusive content and limited editions could drive higher spend in Eastern markets.
- Eastern mobile gamers demonstrate a significantly higher propensity for large transactions, with 76% of purchases exceeding $10 compared to only 42% in Western markets.
- Western mobile gamers are more likely to make small-scale purchases, with 8% of spenders in the West opting for transactions under $5, contrasted with 30% in the East.
- Monetization strategies in the West should prioritize value-based bundles, as these resonate more effectively with the purchasing preferences of Western players.
- Eastern markets, specifically Korea and Japan, show a stronger consumer preference for exclusivity, limited-time offers, and character acquisition.
- Purchase frequency remains relatively balanced across regions, with 35% of Eastern gamers and 36% of Western gamers identified as frequent spenders.
The 2026 State of Web Gaming Report: A Study of Developer and Gamer Perceptions
The study demonstrates that web gaming has evolved from a niche, low‑quality outlet into a central discovery and revenue engine for the industry. Across 2,000 gamers and 400 developers surveyed in 2026, data reveal that 62 % of players discover new titles via the web and 53 % spend more than $50 monthly on games, underscoring a highly engaged, high‑spending audience. Ninety percent of players find games online, yet only 53 % of studios plan to port mobile titles to browsers within a year, highlighting a perception gap between consumer enthusiasm and developer adoption.
Web games thrive in an attention‑saturated media environment because they are short, low‑friction, and can be updated instantly to capture cultural moments. More than half of players listen to music or watch shows while gaming, and 38 % use social media simultaneously, positioning web games as a complementary entertainment layer. Developers cite discoverability (46 %) and gateway potential to other platforms (44 %) as key strengths, while rapid iteration and zero‑install access drive engagement and revenue. Monetisation maturity remains a barrier, yet the medium’s ability to reach players at the top of the purchase funnel is clear.
The data also show that web gaming no longer represents a low‑quality channel; 92 % of players rate HTML5 titles as high quality, and 37 % play multiple times a day. Web platforms drive discovery for 62 % of players, and high‑spending consumers are increasingly found online. Consequently, developers who omit web distribution risk missing a growing, engaged, and monetisable audience that now sits at the forefront of the purchase funnel.
- Web gaming is a significant discovery channel: 62% of web gamers have downloaded or purchased a game after discovering it on the web, and 53% of developers see it as a means to reach new players.
- Web gamers are highly engaged and valuable: 37% play multiple times per day, 86% play at least a few times a week, and 53% spend over $50 on gaming purchases monthly.
- Developers are increasingly embracing web gaming, with 27% planning to port mobile games to browsers in the next 12 months, and 56% agreeing it's a growing channel.
- There's a disconnect between some developer perceptions and reality: 32% of developers believe web gaming is a 'low-quality channel' despite 92% of consumers rating HTML5 web games as 'quite' or 'very' high quality.
- Web gaming offers low-friction access and high convenience, with 71% of respondents reporting stable or increasing web gaming time relative to social media, and 58% playing because games are free.
AI in MTG: Moving Beyond Theory
The document argues that artificial intelligence has become a strategic asset in mobile game development, transforming every phase of the lifecycle from ideation to live operations. It claims that AI enables teams to prototype, test, and launch content at a fraction of the time previously required, citing examples such as concept‑art generation in days instead of months and single‑person prototype teams that reduce sunk costs. The thesis emphasizes that the combination of trillions of player data points, world‑class creative teams, evergreen intellectual property, and AI as a workflow enabler creates a competitive moat that is difficult to scale for rivals.
Key findings include a 99 % cost reduction in marketing asset creation, an 80 % time saving on influencer spotlights, and a 75 % reduction in analyst turnaround times when querying data through AI agents. The document reports that five new games launched in 2026 adopted an “AI‑first” approach, allowing rapid iteration and simultaneous development of specialized content. It also highlights that AI agents can analyze A/B tests, suggest optimizations, and generate localized UGC‑style assets to lower CPI and improve player engagement.
The scope covers the global mobile gaming market, focusing on mid‑core titles with large player bases. Methodology is implied through internal tooling: 50+ AI platforms (e.g., Claude, Cursor, ComfyUI) and BigQuery‑based agents that process terabytes of data daily. The analysis suggests that AI integration not only accelerates production but also democratizes data insights, freeing analysts to tackle higher‑level strategic questions.
- Adopting an 'AI-first' development approach enabled the launch of five new mobile games in 2026, facilitating rapid iteration and simultaneous production of specialized content.
- AI integration has achieved significant operational efficiencies, including a 99% reduction in marketing asset costs and an 80% time saving on influencer spotlight production.
- Data analysis turnaround times have been reduced by 75% by utilizing AI agents to query large-scale datasets, allowing analysts to focus on high-level strategy.
- AI tools, including Claude, Cursor, and ComfyUI, have transformed production timelines, enabling concept art generation in days rather than months.
- The combination of AI-driven workflows, proprietary player data, and evergreen intellectual property creates a significant competitive moat in the mid-core mobile gaming market.
2026 Live Ops Competitive Intelligence Playbook
Optimizing Live Ops execution requires a disciplined, five-step analytical framework that moves beyond simple feature replication toward strategic, data-backed product decisions. By leveraging competitive intelligence tools to monitor event cadence, mechanics, and performance metrics, developers can effectively benchmark their titles against both direct and aspirational competitors. The primary objective is to transition from viewing individual mechanics as isolated features to implementing a cohesive, multi-layered calendar structure that drives player engagement across short, medium, and long-term horizons.
Across the puzzle, strategy, and casino genres, standard features such as tournaments, milestone rewards, and gacha wheels have become industry table stakes. Maintaining a competitive advantage now depends on the sophisticated sequencing of these events to foster social competition, create artificial urgency, and funnel player spending toward climactic moments. In the 4X strategy sector, successful titles utilize disciplined, multi-week cycles that escalate from solo challenges to server-wide competition. Meanwhile, the casino segment increasingly relies on specialized rolling offers and seasonal cycles to sustain momentum and maximize revenue spikes.
The scope of these strategies extends beyond in-game mechanics to include broader ecosystem shifts, such as the adoption of direct-to-consumer web stores to bypass platform fees and improve margins. Because the gaming landscape evolves rapidly, competitive intelligence must function as an ongoing, iterative process rather than a static assessment. Developers who prioritize a holistic system of player-agency mechanics and continuous monitoring are better positioned to maintain market parity and drive sustainable growth in an increasingly crowded global mobile market.
- In the puzzle genre, milestone rewards are the most frequent event type in 2026, with Tasty Travels launching four such events between March and May 2026.
- Royal Match drives weekend revenue spikes primarily through Live Ops-induced monetization and conversion increases, rather than growth in DAU, downloads, or time spent.
- For casino slot titles, '1+Free' offers generate the highest average release revenue impact, despite 'Rolling Offers' being the most prevalent specialized offer type used by 9 of 12 analyzed games.
- Sprint goal tournaments are the second most trending event mechanic in 2026, with Gossip Harbor and Tasty Travels actively deploying them throughout March and April.
- Merge events have become a key trend in match-swap games, with titles like Royal Match, Matching Story, Piggy Kingdom, and Matchington Mansion adopting the mechanic in 2026.
Conversion Drivers in Videogames: Q1 2026
Marketing strategy and community sentiment serve as the primary determinants of conversion performance in the global video game industry as of early 2026. While pricing models like free-to-play and premium structures influence baseline metrics, the efficacy of acquisition campaigns depends more heavily on the alignment between marketing channels and specific player decision-making behaviors. Traditional last-click attribution models frequently undervalue high-funnel awareness efforts, necessitating a shift toward incrementality testing and extended retargeting windows to accurately capture the impact of early-stage engagement.
Player decision cycles vary significantly across industry segments, dictated largely by the social and cooperative dynamics inherent in different genres. Multiplayer and massively multiplayer online titles require longer conversion windows due to the complexity of social coordination, whereas single-player experiences benefit from strategies that emphasize urgency and individual-driven processes. Consequently, marketing efforts for multiplayer games should prioritize social proof and sustained community engagement, while single-player titles gain more traction through direct, time-sensitive calls to action.
Game quality and public perception act as critical multipliers for conversion, particularly within the premium sector. High Steam review scores, specifically those reaching the highest sentiment tiers, can nearly triple conversion rates for premium titles, whereas free-to-play conversion remains largely indifferent to such metrics. Because premium games involve extended evaluation periods, marketers must maintain consistent community-focused sentiment management to protect long-term conversion potential. By tailoring acquisition strategies to these distinct genre-based behaviors and moving beyond simplistic attribution, publishers can better optimize campaign performance and maximize player acquisition efficiency.
- Marketing execution is the primary driver of performance, with conversion rates for F2P games varying by 371x across different ad networks, dwarfing the 35% baseline advantage F2P titles hold over Premium games.
- Last-click attribution models undervalue upper-funnel awareness channels like YouTube, as 50% of the most popular demand-generating ad networks are not effectively captured by last-click metrics.
- Premium games priced above $40 require nearly twice the conversion window of mid-tier titles, and players take 27% longer to convert on Premium titles (141 hours) compared to F2P titles (111 hours).
- Steam review scores significantly impact Premium game performance, where moving from a 'Mixed' to 'Very Positive' rating can nearly triple conversion rates, whereas review scores show no measurable impact on F2P conversion.
- Multiplayer games exhibit longer decision cycles, taking 2.5x longer to convert than single-player titles, with MMO players requiring a median of 49.5 hours to convert compared to 21 hours for shooter players.
Digital Market Index: Q1 2026
The global digital economy experienced a significant structural transition during the first quarter of 2026, characterized by a pivot away from traditional mobile gaming toward generative artificial intelligence and short-form entertainment. While global in-app purchase revenue climbed 9.3% to $43.5 billion, this growth was primarily fueled by non-gaming sectors. Mobile gaming faced a notable contraction, with downloads falling 12% year-over-year, even as puzzle titles maintained their status as a primary revenue anchor. Conversely, the generative AI sector surged by 174%, signaling a shift in consumer engagement as users increasingly migrate from web-based interfaces to dedicated mobile applications.
Geographically, the market landscape is bifurcating between mature and emerging economies. The United States market exhibited signs of cooling, recording its lowest revenue growth rate at 3.5%, while India and Indonesia emerged as primary drivers of download volume. Despite the slowdown in U.S. consumer spending, the digital advertising sector remained resilient, growing 15% to $48 billion. This expansion was heavily supported by a 31% increase in software-related ad spend, as advertisers aggressively reallocated budgets from linear television toward targeted digital channels and retail media networks.
Retail media continues to evolve beyond the dominance of Amazon, with platforms like Walmart and Target capturing significant share by leveraging offsite social channels. This trend is particularly pronounced in essential categories such as personal care and food and beverages. As the industry matures, the competitive landscape for generative AI has also become more distributed, with market share spreading across multiple platforms like Gemini and Claude. These findings reflect a broader trend of digital consolidation, where mobile-first engagement and AI-driven utility define the current trajectory of the global digital marketplace.
- Global in-app purchase (IAP) revenue reached $43.5 billion in Q1 2026, marking 9% year-over-year growth and the 13th consecutive quarter of positive performance.
- US digital ad spend grew 15% year-over-year to $48 billion in Q1 2026, with Reddit emerging as the fastest-growing channel at 89% year-over-year growth.
- US mobile IAP revenue growth slowed to an all-time low of 3% year-over-year, recording two consecutive quarters of decline from its $15.1 billion peak.
- Generative AI advertising spend in the US surged to over $430 million in Q1 2026, more than triple the amount spent in Q1 2025, contributing to a 31% year-over-year increase in software ad spend.
- Retail media ad impressions in the US declined 3% year-over-year to 156 billion, driven by a 14% drop in Amazon impressions, even as Amazon maintained over 88 billion impressions and 4x the scale of Walmart.

Why Players Play: The Psychology Behind Mobile Games
Mobile game development relies on the strategic alignment of product features with fundamental human psychological drivers to maximize player retention and monetization. By integrating core motivations such as mastery, curiosity, and social connection with defensive psychological triggers like loss aversion and the fear of missing out, developers create highly sticky ecosystems. The primary thesis posits that long-term success in the mobile sector is not merely a product of gameplay quality, but the result of a deliberate, evidence-based architecture that increases the perceived cost of player attrition.
The industry utilizes a sophisticated framework known as the Motivation Wheel to categorize game events and align them with specific business objectives, such as increasing average revenue per user or extending session duration. This approach sequences positive reinforcement—such as visible progress and reward systems—with negative motivators that compel action. By layering these mechanics, developers effectively transform natural session exit points into persistent hooks. Features like battle passes, streaks, and time-limited events leverage the sunk cost fallacy, shifting the player’s primary motivation from intrinsic enjoyment to a defensive necessity to protect accumulated progress.
This analytical approach to game design is prevalent across the global mobile gaming market, focusing on the intersection of behavioral psychology and product management. By systematically engineering these psychological deficits, developers ensure that engagement remains high even after the initial novelty of a game fades. Ultimately, the integration of these mechanics serves to minimize guesswork in product planning, allowing studios to foster deep, long-term player investment through the calculated application of urgency, social pressure, and the psychological weight of digital achievement.
- Social connection is the most effective retention mechanic because it creates a switching cost that prevents players from moving to competitors, as they cannot transfer their clan or community identity.
- Win streaks are the most powerful ARPU-driving mechanic because they simultaneously leverage progress, near-miss tension, loss aversion, urgency, and social pressure.
- Visible progress is essential for casual games; players require concrete proxies like progress maps, star counts, or numerical growth to feel a sense of competence and reward.
- Retention can be extended at natural session 'exit points' by using time-limited boosters or curiosity-driven teasers to convert a sense of completion into a new hook.
- Urgency and FOMO are most effective when the time-limited window is restricted to 5–20% of the total event duration, forcing players to choose between missing out or playing harder.
Vietnam Domestic Gaming Industry Report: 2025
The Vietnamese mobile gaming market represents a significant growth sector in Southeast Asia, reaching a valuation of approximately $825 million in 2025. With an estimated 54 to 58.5 million mobile gamers and a year-on-year revenue growth rate of 9.16%, the market is characterized by high engagement, with users averaging 2.5 hours of daily gameplay. The industry is supported by a robust digital infrastructure, serving 79.8 million internet users, and is projected to exceed $1 billion in annual revenue by 2030.
Market performance is dominated by specific genres, with MMORPGs leading at 23.12% of total revenue, followed by team battle and 4X strategy games. Payment ecosystems are heavily localized, with e-wallets, bank transfers, and domestic card schemes—primarily through the NAPAS network—accounting for the vast majority of transactions. This preference for local financial infrastructure necessitates strategic partnerships for international entities seeking to enter the region.
Regulatory compliance remains the most critical barrier to entry for foreign developers. Under Decree No. 147/2024/ND-CP, all game distribution requires a formal license, and foreign companies must operate through a local legal entity or a licensed domestic publisher. Mandatory requirements include strict KYC identity verification, a 180-minute daily playtime limit for minors, and the physical hosting of server systems within Vietnam. Furthermore, upcoming advertising regulations effective in 2026 will mandate shorter, user-friendly ad formats, prompting a shift toward rewarded ads and enhanced in-app purchase strategies. To navigate these complexities, stakeholders are increasingly relying on local advisory and publishing ecosystems to manage licensing, legal documentation, and market-specific operational requirements.
- The Vietnamese mobile gaming market reached $825 million in 2025, growing 9.16% year-on-year with 54 million mobile gamers and 4.9 billion annual downloads.
- Foreign developers cannot publish directly and must partner with a local entity or establish a local office to comply with Decree No. 147/2024/ND-CP, which mandates local server hosting and 100% player KYC via mobile numbers.
- MMORPGs are the dominant revenue driver at 23.12% of the market, followed by Team Battle (17.05%) and 4X Battle (15.05%) genres.
- Payment infrastructure is heavily localized, with 86% of transactions utilizing local schemes and 31% of users preferring e-wallets, while card payments account for 27%.
- New advertising regulations effective February 15, 2026, will restrict ad formats by requiring one-tap close buttons and capping skip-wait times at 5 seconds, forcing a shift toward rewarded ads and IAP-focused monetization.