Report4 pages
Market Model Reports: Asia & MENA
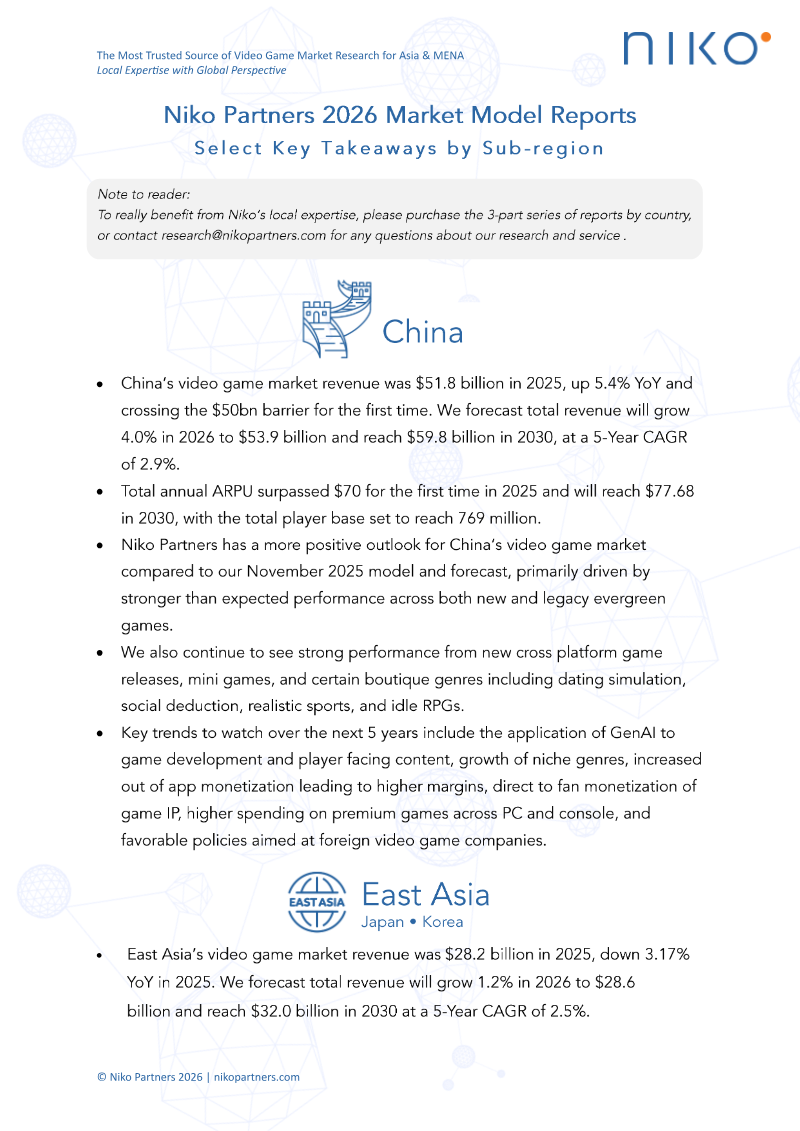
The 2026 Market Model Reports provide a comprehensive analysis of video game industry performance and growth projections across Asia and the Middle East and North Africa (MENA). Covering China, East Asia, India, Southeast Asia, and the MENA-3 region (Egypt, Saudi Arabia, and the UAE), the research evaluates revenue trends, player demographics, and macroeconomic influences through 2030. The analysis utilizes proprietary market modeling, player survey data, and regional expertise to assess the evolving landscape of mobile, PC, and console gaming.
Key findings highlight significant regional disparities in growth and maturity. China remains a dominant force, with 2025 revenue reaching $51.8 billion and a projected 2.9% CAGR through 2030. India emerges as the fastest-growing market, having surpassed $1 billion in revenue in 2025 with an expected 11.2% CAGR. Conversely, East Asia experienced a 3.17% revenue decline in 2025 due to macroeconomic pressures in Japan, though South Korea shows signs of recovery. Southeast Asia continues to expand, driven by mobile adoption and internet penetration, while the MENA-3 region benefits from strong government support and rising disposable income, despite potential geopolitical headwinds.
The research identifies several critical industry drivers, including the integration of generative AI, the rise of niche genres, and increased government regulation across Southeast Asia. Higher average revenue per user (ARPU) remains a focal point, particularly in East Asia, which maintains the highest regional spending levels. Overall, the findings suggest that while short-term volatility persists due to economic and geopolitical factors, the broader outlook for these markets remains positive, supported by increased localization, infrastructure development, and shifting consumer spending toward digital entertainment.
- China’s video game market reached $51.8 billion in 2025 and is projected to grow at a 2.9% CAGR to reach $59.8 billion by 2030.
- India is the fastest-growing market tracked, with 2025 revenue of $1.04 billion and a projected 11.2% CAGR through 2030, supported by a player base expected to reach 707 million.
- East Asia remains the region with the highest ARPU, though 2025 revenue declined 3.17% to $28.2 billion due to Japanese market stagnation and macroeconomic conditions.
- Southeast Asia’s market revenue hit $5.63 billion in 2025 and is forecast to grow at a 4.8% CAGR, with Thailand, the Philippines, and Indonesia identified as the fastest-growing sub-markets.
- The MENA-3 region (Egypt, Saudi Arabia, UAE) generated $2.15 billion in 2025 and is expected to see the strongest ARPU growth, reaching $38 by 2030 despite potential geopolitical instability.
+3
Niko PartnersJun 2026
Report54 pages
Türkiye's Mobile Gaming Landscape 2026
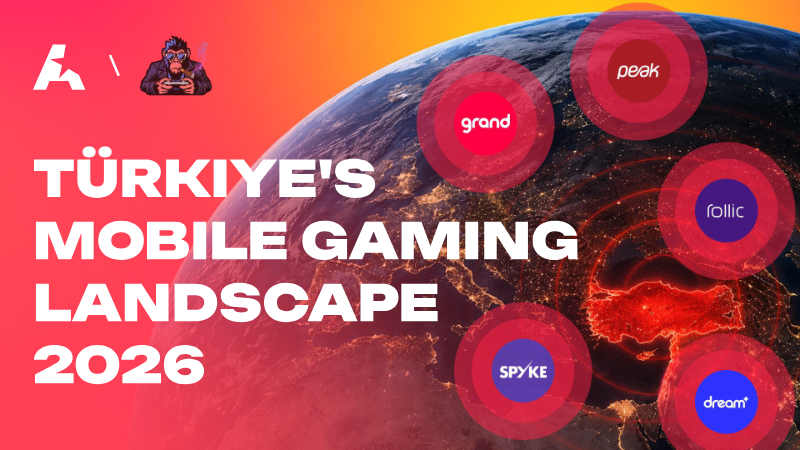
Türkiye has emerged as a preeminent global force in the mobile gaming sector, characterized by a resilient ecosystem that achieved 6% year-over-year revenue growth despite broader international market stagnation. This expansion is underpinned by a maturing domestic industry where local developers have increased their collective revenue by 450% since 2020, now commanding a 5% share of the global market. The sector’s success is heavily concentrated in the puzzle genre, which accounts for nearly 97% of local earnings, while a strategic pivot toward hybrid-casual titles and sophisticated LiveOps strategies continues to influence international development trends.
The rapid professionalization of the Turkish gaming landscape is driven by a self-sustaining flywheel effect, where successful exits and high-profile valuations for studios like Dream Games and Loom Games attract consistent capital and elite technical talent. Since 2020, the number of local developers has tripled, supported by a robust network of venture capital firms and over 700 active gaming startups. This growth is further accelerated by proactive government intervention, including substantial tax incentives and user-acquisition subsidies, which provide a competitive advantage in an increasingly saturated global environment.
Looking toward 2026, the industry is transitioning from rapid iteration models toward AI-native development and deeper engagement mechanics to maintain its competitive edge. With over $3.6 billion in total investment fueling the rise of category-defining companies, the region has solidified its status as a global hub for mobile gaming innovation. By leveraging a data-driven creative playbook and a highly replicable development framework, the Turkish market is well-positioned for sustained dominance, effectively balancing rapid scaling with the long-term technical maturity required to navigate the evolving demands of the global mobile gaming audience.
- Türkiye’s mobile gaming sector has achieved a 6% year-over-year revenue growth, with local developers increasing their collective revenue by 450% since 2020 to capture a 5% global market share.
- The industry is heavily concentrated in the puzzle genre, which generates nearly 97% of local earnings, while studios increasingly pivot toward hybrid-casual titles and sophisticated LiveOps strategies.
- The ecosystem is supported by over 700 active gaming startups and $3.6 billion in total investment, which has helped triple the number of local developers since 2020.
- High-profile exits and valuations for studios like Dream Games and Loom Games have created a self-sustaining flywheel that attracts elite technical talent and venture capital.
- Proactive government intervention, including tax incentives and user-acquisition subsidies, provides a competitive advantage that helps local developers scale in a saturated global market.
+2
AppMagicJun 2026
Report49 pages
Essential Facts about Video Games in Italy: 2025
In 2025, roughly 14.2 million Italians—about a third of the population aged six to seventy‑five—engage in video gaming, with a pronounced male bias and a concentration of players under 35. The industry’s total revenue remains steady at €2.4 billion, of which game sales account for 77 percent (€1.8 bn). Gaming time has risen to nearly eight hours per week, driven primarily by smart‑device play (22 percent reach, €929 m revenue) and console gaming (13 percent reach, €643 m). App‑based games now represent more than half of the market, dominated by freemium monetisation; only one percent of app revenue comes from upfront purchases.
Revenue distribution varies by platform. Smart‑device earnings are almost entirely from in‑app purchases (ARPU €84), while console sales lean heavily on digital downloads—65 percent of new game revenue comes from full‑game downloads (€502 m) and 21 percent from DLC (ARPU €99). PC revenue is largely driven by DLC (43 percent) and full‑game downloads (98 percent of console sales). Subscription services are pivotal: console ecosystem subscriptions contribute 59 percent of total gaming‑subscription revenue (€153 m), with mobile and single‑game franchises accounting for 6 percent and 35 percent respectively.
Player demographics reveal that smart devices attract a younger, male‑skewed audience (31 percent of 6–17‑year-olds), whereas console and PC gaming remain niche but heavily male‑skewed, concentrated among teens. Casual and sports titles dominate sales across all platforms, with subscription services such as PlayStation Plus and Xbox Game Pass driving a significant share of paid play. Engagement patterns show males spending the most hours on consoles (average seven hours per week), while PC gaming remains steady across age groups. Approximately one‑quarter of players follow gaming news on YouTube or vlogs, and 20 percent rely on social media or family discussions for information. The data derive from a nationally representative online survey of 3,000 respondents, weighted against an offline omnibus sample and calibrated to industry sales figures.
- The Italian video game market generated €2.4 billion in 2025, with game sales accounting for 77 percent (€1.8 billion) of total revenue.
- App-based gaming dominates the market, representing over half of total revenue with a freemium model where only one percent of earnings come from upfront purchases.
- Smart devices are the primary revenue driver at €929 million, while console gaming accounts for €643 million, supported by an average of eight hours of gameplay per week across the population.
- Console revenue is heavily reliant on digital distribution, with 65 percent of new game sales coming from full-game downloads and 21 percent from DLC.
- Console ecosystem subscriptions are the primary driver of the subscription market, contributing 59 percent (€153 million) of total subscription revenue.
+4
IIDEA – Italian Interactive Digital Entertainment Association

Report34 pages
2026 Mobile & PC Gaming Benchmarks
The global gaming landscape in 2026 is defined by a widening performance gap between a small elite of top-tier titles and the broader market. Data derived from over 16,000 live mobile games indicates that retention metrics, including D1, D7, and D30, are in a state of decline. With median D30 retention falling below 1%, the industry has become increasingly unforgiving, necessitating a strategic shift toward immediate, high-quality onboarding and the refinement of core gameplay loops to mitigate rising churn rates.
Mobile gaming engagement remains characterized by high-frequency, habitual daily play, yet the industry suffers from a stagnation in innovation and an over-reliance on monetization at the expense of genuine engagement. Success in this segment requires developers to move beyond generic feature sets and instead prioritize behavioral loops that foster long-term habit formation. Conversely, the PC gaming sector operates on a different paradigm, where success is measured by depth, session length, and content longevity. On this platform, retention and engagement metrics serve as indicators of long-term player commitment and the intrinsic value of immersive, long-form experiences rather than simple return frequency.
To navigate these challenges, studios are increasingly turning to advanced data-driven infrastructure to optimize player experiences. By leveraging real-time insights and sophisticated market intelligence, developers can better align their growth strategies with evolving player behaviors. Ultimately, the ability to sustain a competitive advantage in both mobile and PC markets depends on a rigorous focus on content quality and the implementation of robust, data-informed engagement strategies that cater to the specific demands of each platform.
- Mobile gaming retention is in decline, with median D30 retention rates falling below 1% across a sample of over 16,000 live titles.
- The gaming market is experiencing a widening performance gap where a small elite of top-tier titles increasingly dominates the broader landscape.
- Mobile success now requires a strategic pivot toward immediate, high-quality onboarding and core gameplay loops to counter rising churn rates.
- Mobile engagement is currently stagnant due to an over-reliance on monetization, necessitating a shift toward behavioral loops that foster long-term habit formation.
- PC gaming success is defined by long-form, immersive experiences where metrics like session length and content longevity are the primary indicators of value.
+3
GameAnalyticsJun 2026
Report14 pages
Europe and Esports: High Engagement and Even Higher Potential (2020)
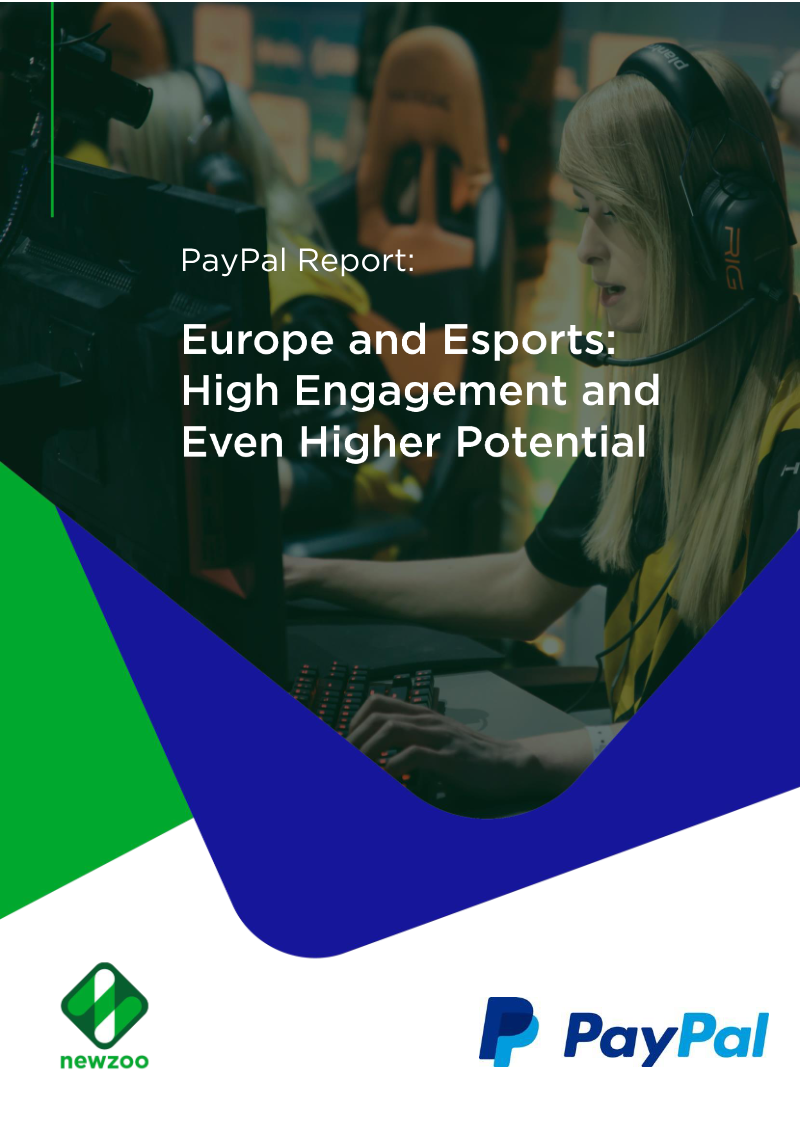
The study demonstrates that Europe’s esports audience reached 92 million viewers by the end of 2020, up 7.4 % from 2019, with 33 million classified as “Esports Enthusiasts” and the remaining 59 million as occasional viewers. Revenue projections for the global market hit €973.9 million in 2020 and are expected to rise to €1.6 billion by 2023, with European figures mirroring this upward trend. The research surveyed 10 175 participants aged 18‑45 across ten Western and Northern European countries, using invitation‑only questionnaires administered over one month (29 May–28 June 2020). Respondents were nationally representative of esports viewers in each country.
Key findings reveal that engagement is highest among 21‑25‑year‑olds, with Finland showing the strongest enthusiast proportion (52 % of 18‑20‑year‑olds) versus only 21 % in the UK. COVID‑19 lockdowns increased viewership in markets with stricter restrictions, such as France and Spain, where 62 % of respondents expected continued higher viewership post‑lockdown. Women constitute 32 % of the audience, largely as occasional viewers; however, 60 % of respondents believe female participation is growing. Female spenders are slightly lower than male counterparts (46 % vs 38 %) but show a higher propensity for physical merchandise, whereas men favor digital items like skins and premium passes.
The report also highlights cross‑sport fandom: 64 % of viewers own a favorite sports team, with football and tennis being the most common. Rocket League enjoys significant popularity, especially in the UK (34 % of enthusiasts). Overall, 58 % of enthusiasts spend on esports products, with Spain leading at 62 %. These insights underscore a rapidly expanding, monetizable European esports ecosystem that offers substantial opportunities for brands across both traditional and digital channels.
- Europe's esports audience reached 92 million viewers in 2020, a 7.4% increase from 2019, consisting of 33 million enthusiasts and 59 million occasional viewers.
- Global esports revenue is projected to grow from €973.9 million in 2020 to €1.6 billion by 2023, with European market trends mirroring this expansion.
- Engagement is highest among 21–25-year-olds, with Finland reporting the highest enthusiast proportion at 52% for the 18–20 age bracket, compared to 21% in the UK.
- COVID-19 lockdowns significantly boosted viewership in countries like France and Spain, with 62% of respondents in these regions expecting sustained higher engagement post-lockdown.
- Women represent 32% of the total audience and show a higher propensity for physical merchandise spending, while men favor digital items such as skins and premium passes.
+2
PayPal

Report42 pages
For the Game: Data Fusion Sheds a New Light on Players
Gaming is projected to reach 3.5 billion players and generate over US$225 billion in revenue by 2025, establishing the medium as a mass‑scale platform with extensive brand opportunities. Dentsu’s data‑fusion approach merges a 420,000‑respondent consumer panel with GWI gaming insights across 21 markets to create high‑fidelity gamer portraits that link lifestyle, media habits and in‑game behaviors. This methodology enables brands to segment audiences by motivation rather than device or genre, a strategy shown to produce the most authentic and attention‑driven brand experiences.
Key demographic insights reveal that 57 % of gamers are female, with gaming serving as a tool for identity reinvention and social bonding. Shooters dominate play preferences (63 %), while sports and puzzle/strategy titles attract 16 %. Device usage is nearly evenly split among console, handheld, and a growing smartphone/tablet share. Community engagement is strong: 40 % of U.S. gamers play to belong, and 63 % rely on friends for game information, with platforms such as Discord, Reddit, and Twitch amplifying fandoms.
Commercially, 71 % of gamers consume gaming content across multiple devices and 55 % of esports fans welcome sponsorships, underscoring high engagement. Brands that add genuine value—through exclusive rewards, immersive metaverse experiences, or AR scavenger hunts—achieve near‑perfect ad completion rates (96 %) and significant click‑throughs. Successful activations require clear brand rules, diversity inclusion, strategic partnerships with publishers or esports teams, and a focus on authentic integration rather than intrusive advertising. The analysis spans 22 global markets, including Australia, Brazil, Canada, China and the United States, offering a comprehensive framework for brands to identify entry points and growth opportunities within the evolving gaming ecosystem.
- The global gaming market is projected to reach 3.5 billion players and generate over US$225 billion in revenue by 2025.
- Brands that integrate value-add experiences like exclusive rewards or AR scavenger hunts achieve a 96% ad completion rate.
- Gamer demographics show that 57% of players are female, with 40% of U.S. gamers citing social belonging as a primary motivation for play.
- Shooters remain the dominant genre at 63% of play preferences, while sports and puzzle/strategy titles account for 16%.
- Consumer engagement is high, with 71% of gamers using multiple devices and 55% of esports fans expressing openness to brand sponsorships.
+3
InvestGame

Report4 pages
Is There a Shift from Content to Tech Startups Among Gaming VCs?
The analysis examines venture capital activity in the gaming sector from 2020 to early 2024, focusing on whether investment priorities are shifting from traditional content creation and publishing toward technology‑driven startups. Data show that, across all stages, content creators and publishers continue to dominate VC allocations, representing over half of both capital deployed (≈$1.76 billion) and the number of deals in early‑, mid‑, and late‑stage rounds. However, a closer look at seed and Series A financing reveals a notable trend: PC and console studios now secure more funding than mobile startups, indicating a pivot toward higher‑budget, platform‑centric projects.
In the last twelve months, gaming‑focused VC funds have increased their exposure to technology and platform companies. Capital deployed by select funds such as VENTURES, BEHOLD Venture, and Lightspeed Lvp. rose from roughly $1.3 billion in early 2020 to over $2.4 billion by H1 2024, while the number of rounds led by these funds grew from 67 to 289. This shift is evident across multiple funds, with several moving a larger share of their capital into tech‑centric ventures rather than pure content studios.
Geographically, the data encompass global markets with a concentration in North America and Europe, covering all major gaming segments—mobile, PC, console, and emerging platform technologies. The methodology aggregates publicly disclosed VC‑led rounds from 2020 through H1 2024, using capital deployed and round counts as primary metrics. The findings suggest that while content remains the core focus, gaming VCs are progressively allocating more resources to technology and platform innovations, reflecting an evolving investment landscape in the industry.
- Content creators and publishers remain the primary focus of gaming VC, accounting for over half of all capital deployed (approximately $1.76 billion) and the majority of deal volume across all stages.
- Gaming-focused VC funds, including VENTURES, BEHOLD Venture, and Lightspeed Lvp., significantly increased their activity between 2020 and H1 2024, with capital deployed rising from $1.3 billion to over $2.4 billion.
- The number of VC-led funding rounds grew substantially from 67 in early 2020 to 289 by H1 2024, reflecting an overall increase in investment activity.
- While content dominates total funding, there is a clear strategic pivot among VCs toward technology and platform-centric startups, particularly within seed and Series A financing.
- Within the content sector, investment is shifting toward higher-budget, platform-centric projects, as evidenced by PC and console studios now securing more funding than mobile startups.
+3
InvestGame

Report10 pages
Europe’s Gaming Consolidators: The Magnificent Seven Post-M&A Rush
The analysis examines the surge of M&A activity among European gaming publishers between 2020 and 2024, highlighting a capital deployment of $19 billion across more than 140 deals. Seven leading consolidators—mienn Easybrain Group, Stillfront, Keywords, Multiplay Media, Management Studios, The Label Yippee!, and SoftWare—dominated the market, with mienn Easybrain Group alone executing 78 deals worth $14.1 billion and acquiring studios such as Ashodee, CrazyLabs, and Aspyr. The largest individual acquisitions include Asmodee Group’s $3.145 billion purchase of a target in March 2022 and Plarium MO’s $620 million deal for SoftWare in November 2024.
Revenue growth data reveal that reported year‑over‑year increases were largely driven by inorganic expansion, with average revenue growth rates ranging from 21 % to 66 %. In contrast, organic growth remained modest; only a handful of firms maintained double‑digit positive trajectories without M&A. Adjusted EBITDA minus CAPEX (AEBITDAC) trends show a decline for many PC and console publishers, reflecting high‑budget projects that failed to deliver expected returns.
Share price performance indicates a post‑pandemic correction: most acquirers’ stocks fell 30–70 % from December 2019 levels, and the aggregate market cap of the seven firms peaked at $25.5 billion in April 2021 before stabilizing around $5.4 billion after share issuances financed acquisitions. Valuation multiples peaked during the 2020 bull market (EV/NTM revenue up to 30×) and subsequently contracted as investors shifted focus toward profitable organic growth.
Overall, the report underscores that aggressive inorganic strategies during low‑interest periods did not generate sustainable shareholder value, prompting leadership changes, layoffs, and restructuring initiatives across the sector.
- Between 2020 and 2024, seven major European gaming consolidators deployed $19 billion across over 140 deals, with mienn Easybrain Group accounting for 78 deals totaling $14.1 billion.
- Aggressive inorganic growth strategies failed to deliver sustainable shareholder value, as evidenced by a market cap collapse from a $25.5 billion peak in April 2021 to approximately $5.4 billion.
- Share prices for the primary acquirers corrected significantly, falling 30–70% from December 2019 levels as valuation multiples contracted from highs of 30× EV/NTM revenue.
- Revenue growth was primarily driven by M&A activity, with inorganic expansion rates ranging from 21% to 66%, while organic growth remained modest and rarely reached double digits.
- Financial performance metrics show a decline in AEBITDAC for many PC and console publishers, largely due to high-budget projects failing to meet return expectations.
+1
InvestGame

Report6 pages
The Alumni Effect: Studios Founded by Ex-Activision, Blizzard, and King Employees
The analysis examines venture capital activity directed toward studios founded by former Activision Blizzard employees between 2020 and 2024. It identifies 30 such startups that secured a total of approximately $0.7 billion across 45 VC‑led funding rounds, compared with 27 alumni studios from Riot Games that raised $0.5 billion in 38 rounds. Funding is concentrated in early‑stage rounds, with an average check size of $15.8 million for ex‑Activision studios versus $13.1 million for ex‑Riot ventures, and a notable skew toward PC & console and multiplatform projects. Web3 gaming represents a smaller share of the portfolio.
The study highlights a “first‑round momentum” effect: ex‑Activision studios are roughly twice as likely to secure a second round of financing within the same calendar year as other VC‑backed gaming startups. In 2021, 43 % of ex‑Activision studios raised a subsequent round versus only 9 % of peers; by 2023 the gap narrowed to 33 % versus 8 %. This pattern suggests stronger investor confidence in alumni teams during the 2021‑2022 peak.
Key investors include gaming‑focused funds such as GRIFFIN, PARTNERS COLLECTIVE, and SSSU, which together accounted for more than half of the capital deployed. Notable portfolio companies include Mythical Games (Series C, $262 million), Second Enap (Series B, $100 million), and TheoryCraft (Series A, $87.5 million). While many projects remain in development, releases such as Marvel Snap and Stormgate demonstrate commercial viability, whereas titles like Lightforge’s Project O.R.C.S. were shut down due to lack of traction.
Overall, the report underscores a robust investment climate for studios led by former Activision Blizzard talent, driven by early‑stage funding success and a higher likelihood of follow‑on rounds compared to broader gaming startup cohorts.
- Between 2020 and 2024, 30 studios founded by former Activision Blizzard employees secured approximately $0.7 billion in venture capital across 45 funding rounds.
- Ex-Activision studios demonstrate a 'first-round momentum' effect, being roughly four times more likely than peer startups to secure a second round of financing within the same calendar year.
- Investor confidence in alumni teams peaked in 2021, when 43% of ex-Activision studios raised a subsequent round compared to only 9% of broader gaming startups.
- Funding for ex-Activision alumni is primarily concentrated in early-stage rounds for PC, console, and multiplatform projects, with an average check size of $15.8 million.
- GRIFFIN, PARTNERS COLLECTIVE, and SSSU are the primary investors in this sector, collectively deploying more than 50% of the total capital.
+2
InvestGame

Report9 pages
Corporate Overhaul: Why Does CVC Play a Bigger Role Than Ever?
The analysis demonstrates that corporate venture capital (CVC) has become the dominant force in gaming investment from 2020 to 2024, accounting for more than half of all capital raised in the sector. CVC‑led rounds total $4.0 billion across 93 deals, while VC‑only and joint VC‑CVC rounds raise $3.5 billion in 80 deals, indicating a strategic shift toward co‑investment models that spread risk and access higher‑profile startups. Geographic focus is heavily weighted toward Asian strategics, with South Korean and Japanese firms such as Riot, NetEase, and Gigaom leading the pack; these investors collectively completed 105 deals worth $1.8 billion, surpassing Western peers in volume but not always in value.
The largest disclosed CVC‑led investments target mature gaming studios and multiplatform developers, with EPIC Games securing $2.0 billion in April 2022 and Roblox raising $150 million in February 2020. In contrast, VC‑CVC co‑investments concentrate on platform and technology (“picks and shovels”) startups, exemplified by GreenOak’s $500 million Series I in September 2021 and Samsung‑backed CENVID’s $113 million Series C in July 2021. Mobile segments have seen a decline, with CVC interest shifting toward PC and multiplatform titles; mobile deals now represent only 10–15 % of total CVC activity.
Methodologically, the study aggregates public funding announcements from 2020‑2024, categorizing deals by investor type (CVC only, VC only, or joint), segment (studio, platform/tech, mobile, PC/console), and geographic origin. Deal counts and capital raised are sourced from press releases, regulatory filings, and secondary databases, providing a comprehensive view of investment flows. The findings suggest that corporates are increasingly willing to share risk with traditional VCs, enabling larger funding rounds for gaming studios while maintaining strategic alignment and access to emerging technologies.
- Corporate venture capital (CVC) has become the dominant force in gaming investment from 2020 to 2024, accounting for over half of all capital raised with $4.0 billion across 93 CVC-led deals.
- Investment strategies have shifted toward co-investment models between CVCs and traditional VCs, which collectively raised $3.5 billion across 80 deals to spread risk and access high-profile startups.
- Asian firms, specifically from South Korea and Japan, are the most active investors, completing 105 deals worth $1.8 billion and surpassing Western peers in total deal volume.
- CVC-led investments prioritize mature studios and multiplatform developers, highlighted by major capital injections such as the $2.0 billion raised by Epic Games in April 2022.
- VC-CVC co-investments are primarily focused on 'picks and shovels' platform and technology startups, exemplified by the $500 million Series I round for GreenOak in September 2021.
+2
InvestGame
Presentation41 pages
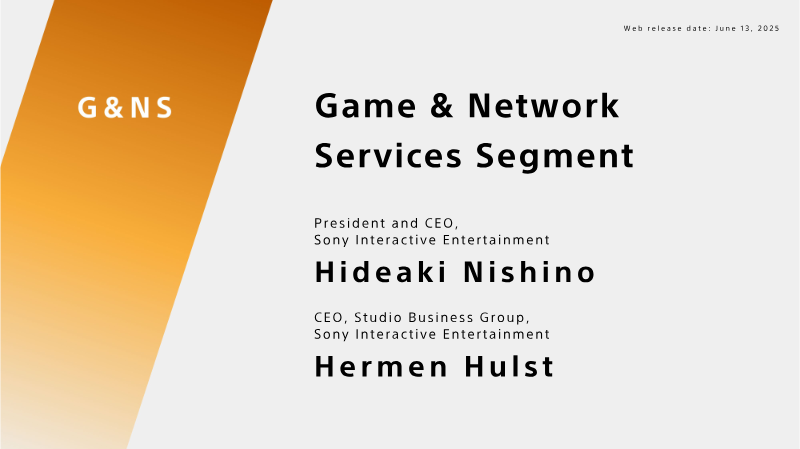
Game & Network Services Segment Presentation
Sony Interactive Entertainment’s Game & Network Services segment demonstrates a clear trajectory of growth and increasing operating leverage. Console sales have risen from $24 B in 2000 to $136 B in 2024, while operating income has shifted from a –$4 B loss to $13 B. The PlayStation ecosystem now supports 124 million monthly active users, a 14% year‑over‑year increase, and generates $846 in life‑to‑date spend per console. A diversified content mix of over 12 000 titles and high‑engagement live‑service games underpins this momentum, with revenue increasingly driven by services such as PlayStation Plus, the Store, and peripherals—accounting for roughly 52–54 % of total revenue.
Strategically, Sony is building a multi‑device ecosystem that expands single‑player franchises to PC, television, film, and location‑based entertainment while reinforcing live‑service titles like HellDivers and Astro. The company leverages artificial intelligence, cloud computing, and cross‑Sony Group partnerships to broaden audience reach and enhance operational efficiency. Portfolio diversification, rigorous development processes, and strategic collaborations are central to capitalizing on the current console generation’s momentum.
The company’s roadmap balances sustainability initiatives—“Road to Zero & Safety & Community”—with profitable growth. Projected platform revenue of $26.8 B and operating income rising from $1.8 B to $2.7 B reflect disciplined investment in intellectual property, content, and services within an agile cost structure. Sony aims to maintain its leading market position while extending franchise reach across PC, television, and media, ensuring long‑term profitability in a rapidly evolving industry.
- Sony’s Game & Network Services segment has achieved a significant financial turnaround, growing from a $4 billion operating loss in 2000 to $13 billion in operating income by 2024.
- Revenue is increasingly driven by services, the PlayStation Store, and peripherals, which now account for 52–54% of the segment's total revenue.
- The PlayStation ecosystem has reached 124 million monthly active users, representing a 14% year-over-year increase, with a life-to-date spend of $846 per console.
- Sony is projecting platform revenue of $26.8 billion and an increase in operating income from $1.8 billion to $2.7 billion through disciplined investment in IP and content.
- The company is executing a multi-device strategy that expands single-player franchises to PC, film, television, and location-based entertainment to broaden audience reach.
+3
Sony Interactive Entertainment

Report12 pages
The Great Mobile Reversal: Why Buyers Pay Billions for What VCs Abandoned
The analysis examines the evolution of mobile gaming investment and M&A activity from 2020 through the first half of 2025. Mobile platforms have dominated the sector, accounting for 61 % of total gaming deal value (excluding ATVI) and nearly all first‑half 2025 volume, driven by strategic and private‑equity deals. Venture capital enthusiasm peaked in 2021 with 137 rounds totaling $2.2 B, but post‑2021 the focus shifted toward profitability and sustainable unit economics, leading to a sharp decline in mid‑core deals—from 49 in 2021 to only eight by H1 25—while casual studios captured 65 % of all deals due to faster iteration and broader audience reach.
Geographically, Turkey led casual gaming with 27 % of deals, whereas Europe and Asia dominated mid‑core, contributing 66 % of transactions in 4X, RPGs, and shooters. Early‑stage activity remained steady at pre‑seed/seed levels, yet Series A and later rounds became rarer as scaling challenges intensified. Median early‑stage check sizes hovered around $10 M, with notable large rounds such as Spyke’s $55 M seed and Scopely’s $340 M Series E.
Strategic buyers intensified their presence, executing $7 B in mobile M&A across six deals within a year. The largest acquisitions include Af’s $12.7 B purchase of 2yga (casual) and Scopely’s $4.9 B takeover of GamesGroup (mid‑core). Overall, the data illustrate a market shift from VC‑led growth to strategic consolidation, with casual titles and recurring revenue models becoming the primary drivers of investment value.
- Mobile gaming accounted for 61% of total gaming deal value (excluding ATVI) between 2020 and H1 2025, with strategic buyers and private equity firms driving nearly all deal volume in the first half of 2025.
- Strategic consolidation has replaced VC-led growth, highlighted by $7 billion in mobile M&A activity across six major deals, including Af’s $12.7 billion acquisition of 2yga and Scopely’s $4.9 billion purchase of GamesGroup.
- Venture capital interest has shifted heavily toward casual gaming, which now captures 65% of all deals due to its broader audience reach and faster iteration cycles.
- Mid-core gaming investment has collapsed, with deal volume falling from 49 rounds in 2021 to only eight by H1 2025 as investors prioritize sustainable unit economics over high-growth scaling.
- While early-stage funding remains stable with median check sizes around $10 million, Series A and later-stage rounds have become increasingly rare due to heightened scaling challenges.
+3
InvestGame

Report7 pages
Public Mobile Gaming Publishers: Resilience & Adaptation in a Shifting Landscape
The analysis examines the post‑IDFA mobile gaming landscape, focusing on revenue dynamics, user acquisition spending, profitability trends, and market valuation shifts across key publishers. Data reveal that annual reported revenue growth has slowed markedly, with many companies experiencing negative organic revenue and overall declines in 2023‑24. User acquisition expenses have surged, reaching peaks of $40 million for some firms, yet returns from these campaigns have weakened, driving higher operating expenses and compressing EBITDA margins. Consequently, publishers are pivoting from aggressive scaling toward profitability, reflected in tighter cost controls and a renewed emphasis on player retention and lifetime value.
Daily active user metrics illustrate the broader market contraction, with average DAU figures falling across the sector. Valuation impacts are stark: aggregate market capitalisation for major publishers has fallen by more than 50 % since January 2022, and most stocks remain below their pre‑IDFA peaks. An exception is MTG, whose disciplined mergers and acquisitions strategy and operational efficiency yielded 9 % organic growth in Q4 2024, translating into a 50 %+ share price increase and outperforming the S&P 500.
The study covers global mobile gaming publishers over a 2022‑2025 timeframe, drawing on quarterly financial statements and market data. Methodology includes analysis of reported revenue, user acquisition spend, EBITDA adjustments for capitalised development costs, and market cap changes. The findings underscore a sector in transition, where resilience hinges on profitability focus, retention strategies, and disciplined capital allocation.
- Aggregate market capitalization for major mobile gaming publishers has plummeted by more than 50% since January 2022, with most stocks remaining below pre-IDFA valuation peaks.
- User acquisition costs have surged to as high as $40 million per firm, while diminishing returns on these campaigns have compressed EBITDA margins and forced a shift toward cost control.
- MTG outperformed the broader market with a 50%+ share price increase and 9% organic growth in Q4 2024, driven by disciplined M&A and operational efficiency.
- Annual revenue growth across the sector has slowed significantly, with many publishers reporting negative organic revenue and overall declines throughout 2023 and 2024.
- The mobile gaming sector is experiencing a broad contraction in engagement, evidenced by a decline in average daily active user (DAU) metrics across the industry.
+3
InvestGame

Report28 pages
Mobile Gaming by Genre: Hypercasual
The hypercasual segment continues to dominate mobile gaming revenue, with the top 100 titles achieving 5.48 billion downloads and $345 million in in‑app purchase (IAP) revenue during the first half of 2025—double the figures from 2024 and the highest ever recorded for this genre. Leading publishers such as AZUR GAMES, Supersonic Studios, and Voodoo have secured billions of lifetime downloads and are increasingly adopting hybrid monetization models that blend advertising with growing IAP streams. This shift signals a clear trend toward revenue diversification while maintaining the ultra‑light, rapid‑development ethos that characterizes hypercasual games.
Projected revenue for 2025 is expected to reach $690 million across the top 100 titles, a doubling of the H1 figure and an increase from $403 million in 2024. The analysis attributes this surge to the genre’s evolution toward hybrid‑casual, where light meta‑progression and deeper monetization extend player engagement beyond the typical 30–60 second sessions. Key performance indicators remain ultra‑low cost per install (CPI), high Day‑1 retention around 40 %, and creative‑driven user acquisition. Hybrid titles aim to lift Day‑7 retention into the teens, thereby boosting lifetime value (LTV).
Case studies of Mob Control, Color Block Jam, and Pizza Ready illustrate successful pivots to hybrid‑casual models. Each title combined strong user experience design, staged monetization (ads plus IAPs), and data‑driven acquisition strategies. Tactics such as adaptive market positioning, psychological ad hooks like the Zeigarnik effect, and seamless ad integration into gameplay produced multi‑million installs, daily revenues exceeding $250 k, and sustained top‑chart performance. These examples underscore that balancing simplicity with depth, timing releases to genre trends, and iterating creatives regionally are critical for scaling hybrid‑casual titles.
- Hypercasual revenue for the top 100 titles is projected to reach $690 million in 2025, a significant increase from $403 million in 2024.
- H1 2025 performance for the top 100 hypercasual titles hit record highs of 5.48 billion downloads and $345 million in IAP revenue, doubling the figures from the same period in 2024.
- Leading publishers like AZUR GAMES, Supersonic Studios, and Voodoo are shifting toward hybrid-casual models that blend traditional advertising with deeper IAP monetization to extend player engagement.
- Hybrid-casual titles aim to improve Day-7 retention into the teens and increase lifetime value by incorporating light meta-progression into the standard 30–60 second hypercasual session.
- Successful titles like Mob Control, Color Block Jam, and Pizza Ready have demonstrated that hybrid-casual models can generate daily revenues exceeding $250,000.
+5
Gamesforum

Report26 pages
Mobile Gaming: Casual
The analysis demonstrates that casual mobile gaming has entered a phase of mature monetization and strategic diversification. Download volumes peaked at 17.3 billion in 2020, dipped to 15.5 billion by 2024, and are projected to rebound to 16.4 billion in 2025, while in‑app purchase (IAP) revenue has risen from $16.8 billion to an expected $22.9 billion by year‑end 2025, indicating a higher revenue per user. Leading titles now blend advertising, IAPs, and brand partnerships to create multiple income streams, with celebrity‑driven campaigns further amplifying user acquisition and lifetime value.
In early 2025, Royal Match topped the earnings list with $540 million in IAP revenue, followed by Monopoly Go! at $431 million and Candy Crush Saga at $421 million. These leaders illustrate divergent monetization models: Royal Match and Monopoly Go! rely exclusively on IAPs, whereas Candy Crush Saga incorporates ads. Playrix’s suite of games—Township, Gardenscapes, Homescapes, and Fishdom—collectively generated $554 million, underscoring the potency of hybrid strategies and the enduring value of established franchises.
Celebrity endorsements have proven effective at generating short‑term spikes. Royal Kingdom’s A‑list television campaign produced a 112 % download surge, while Supercell’s WWE‑inspired “Clashamania” yielded $2.15 million in single‑day IAP revenue for Clash of Clans. However, long‑term return on investment hinges on sustained engagement and lifetime value; Scopely’s “Friendship Pays” campaign achieved payback within 120 days, whereas Royal Kingdom’s lift suggests a longer monetization horizon. These findings highlight that high‑profile campaigns must be coupled with robust retention loops and rigorous LTV measurement to justify multi‑million dollar spend.
Overall, the casual mobile gaming sector is characterized by a shift toward higher monetization per download, diversified revenue models that combine ads and IAPs, and a strategic use of celebrity partnerships to accelerate growth. Success increasingly depends on balancing short‑term acquisition tactics with long‑term retention and monetization strategies across global markets, primarily in North America, Europe, and Asia-Pacific.
- Casual mobile gaming is shifting toward higher revenue per user, with IAP revenue projected to grow from $16.8 billion to $22.9 billion by the end of 2025 despite a fluctuating download volume.
- Market leaders demonstrate divergent monetization strategies: Royal Match ($540M) and Monopoly Go! ($431M) rely exclusively on IAPs, while Candy Crush Saga ($421M) successfully integrates advertising.
- Playrix’s portfolio approach, utilizing a suite of titles like Township and Gardenscapes, generated a combined $554 million, proving the effectiveness of hybrid monetization and established franchise management.
- Celebrity-driven marketing can trigger significant short-term growth, such as Royal Kingdom’s 112% download surge or Clash of Clans’ $2.15 million single-day IAP spike from the 'Clashamania' campaign.
- High-profile acquisition campaigns require rigorous LTV measurement and retention loops to be viable, as evidenced by Scopely’s 'Friendship Pays' campaign achieving payback within 120 days.
+3
Gamesforum

Report23 pages
Mobile Gaming by Genre: Midcore
The analysis demonstrates that midcore mobile games—those offering depth while remaining accessible on handheld devices—are experiencing a post‑pandemic rebound, with Q1 2025 downloads and revenue surpassing 2024 levels. Five‑year data (2020‑2024) reveal a temporary decline during the pandemic, followed by a steady uptick in 2024 and forecasts that growth will continue into 2025. The primary thesis is that monetization success in this segment hinges on data‑driven ad integration and player‑centric design.
Key findings show that midcore titles command higher eCPMs than casual games, yet player retention and in‑app purchase (IAP) conversion rates are sensitive to ad placement. A phased, A/B‑tested approach—beginning with limited rewarded videos and expanding based on performance metrics such as retention, playtime, and IAP conversions—maximizes revenue while preserving engagement. Case studies illustrate tangible benefits: Bytro Labs’ rewarded video strategy lifted average revenue per daily active user (ARPDAU) by 32.9 %, increased Day‑3 retention on iOS by 6.1 %, and achieved eCPMs of 23 (iOS) and 25 (Android). These results confirm that well‑timed ads can rival or complement IAP revenue when aligned with player incentives.
The scope covers the global midcore mobile market, focusing on 2025 performance and projecting trends through 2026. It emphasizes long‑term player value, streamlined gameplay, social hooks, and frequent content updates as critical success factors. The conclusions underscore that responsive development cycles, continuous data analysis, and fair live‑service practices are essential for sustaining growth in the competitive midcore landscape.
- Midcore mobile gaming is experiencing a post-pandemic rebound, with Q1 2025 revenue and download figures exceeding 2024 levels.
- Strategic rewarded video integration can significantly boost performance, as evidenced by Bytro Labs increasing ARPDAU by 32.9% and Day-3 iOS retention by 6.1%.
- Midcore titles achieve higher eCPMs than casual games, with Bytro Labs reaching eCPMs of 23 on iOS and 25 on Android through optimized ad placement.
- Monetization success in the midcore segment requires a phased, A/B-tested approach to ad integration to protect retention and in-app purchase conversion rates.
- Long-term growth in the midcore landscape depends on responsive development cycles, frequent content updates, and the implementation of social hooks.
+5
InvestGame

Report11 pages
Enabling Growth: Cohort User Acquisition Financing
Mobile gaming has rebounded from the downturn of 2022‑23, with a projected compound annual growth rate of 5.0% from 2020 to 2025, driven largely by a 16.2% rise in in‑app advertising and the continued popularity of casual puzzle titles. The sector’s resilience is underpinned by AI‑powered ad tech, rewarded advertising platforms, multiplatform releases that bypass app‑store fees, and strategic IP licensing collaborations. Despite this growth, venture capital remains cautious; VC deployments in mobile studios have plateaued while high‑profile exits such as King, Zynga, and Playtika illustrate that capital is still scarce. Mature studios reinvest roughly one‑third of revenue into user acquisition (UA), yet only a minority secure the $30 million+ funding needed to sustain such spend, and smaller studios often allocate 70% or more of net revenue to marketing.
PvX Partners’ cohort‑based UA financing addresses this gap by providing credit secured against future cohort revenues. The model offers up to 80% of monthly customer acquisition costs, recovers 80% of net revenues until repayment, and imposes a modest interest rate tied to Net Return on Ad Spend (ROAS). Case studies show that studios receiving this financing can increase monthly spend by 16–38% while boosting cash balances, achieving accelerated growth and faster exits—examples include Playtika’s acquisition of a $2 billion‑valued studio within 35 months.
Overall, the analysis suggests that cohort‑based UA financing can unlock scalable growth for mobile studios that lack traditional VC backing, potentially expanding the market’s total UA spend from $143 billion to an additional $3.2 billion by 2027, while maintaining equity and IP control for founders.
- Mobile gaming is projected to grow at a 5.0% CAGR from 2020 to 2025, supported by a 16.2% increase in in-app advertising and AI-driven ad tech.
- Cohort-based UA financing allows studios to fund up to 80% of monthly acquisition costs by leveraging future revenues, providing an alternative to scarce venture capital.
- Studios utilizing cohort-based financing have demonstrated the ability to increase monthly marketing spend by 16–38% while maintaining founder control over equity and IP.
- While mature studios typically reinvest one-third of revenue into UA, many struggle to secure the $30 million+ in funding required to sustain competitive growth.
- Cohort-based financing models have the potential to add $3.2 billion to the global UA market by 2027, helping studios scale without traditional VC backing.
+4
HPvX Partners
Report31 pages
The 2025 Benchmark Report: Roblox Platform Trends
The report establishes that Roblox’s player base is sharply divided between casual users who spend only a few minutes per session and core players who log in multiple times daily, often exceeding 30‑minute sessions. Across 2023‑2025, titles that sustain longer playtimes achieve double‑digit retention rates and significantly higher monetization; the top 5 % of games generate over $20 per day from a single player. In contrast, games with median sessions under six minutes exhibit negligible Day‑1 retention (≈6 %) and ARPPU below $1, indicating that brief curiosity rarely translates into repeat play or meaningful spend.
Cross‑device usage remains high, with nearly 40 % of players alternating between PC and mobile. Daily session frequency has risen by roughly one third among the most active users, while median session length has fallen from 36 to 26 minutes. These dynamics underscore the importance of seamless PC‑mobile experiences and micro‑sessions that incorporate strong re‑entry hooks to capture the growing multi‑session behavior.
Platform discovery mechanisms reward repeat spending and long‑term engagement. Games that maintain 7‑day spend per user climb recommendation rankings, while low‑engagement titles (0–3 min) suffer from poor retention (<5 % Day 1, <2 % Day 7) and modest ARPPU (<$1). Conversely, higher‑engagement games achieve Day‑30 retention above 1 % at the upper percentiles and ARPPU exceeding $6, with average transaction values reaching $3–$4. These findings demonstrate that sustained engagement directly fuels higher per‑payer revenue and larger purchase sizes.
The overarching thesis is that success on Roblox follows a systematic progression rather than chance. Developers must align their game’s current stage with benchmark metrics, prioritizing clear early hooks, repeat‑play incentives, and engagement‑driven spend such as quests, streaks, or battle passes. Leveraging analytics tools like GameAnalytics to track custom events and player behavior enables studios to refine strategies, move from fragile prototypes toward million‑player hits, and capitalize on the platform’s reward structure for long‑term growth.
- Games with median session lengths under six minutes suffer from negligible Day-1 retention of approximately 6% and ARPPU below $1, while top-tier titles achieve ARPPU exceeding $6 with average transaction values of $3–$4.
- The top 5% of Roblox games generate over $20 per day from a single player, demonstrating that sustained engagement is the primary driver of high-value monetization.
- Platform discovery algorithms prioritize games with consistent 7-day spend and high engagement, causing low-engagement titles to fall below 5% Day-1 and 2% Day-7 retention.
- While median session lengths have decreased from 36 to 26 minutes between 2023 and 2025, daily session frequency among the most active users has increased by roughly one-third.
- Nearly 40% of the player base alternates between PC and mobile, necessitating seamless cross-device experiences to support the growing trend of multi-session play.
+3
InvestGame
Report41 pages
PC/Console Gaming Index: 2025
The 2025 PC/Console Gaming Index demonstrates that action titles dominate the market, with approximately 262 million downloads year‑to‑date. Indie and AA developers such as R.E.P.O., Split Fiction, and Peak contribute the majority of these downloads, while Steam remains the leading platform for both volume (≈450 million downloads) and premium revenue. Console ecosystems differ: PlayStation and Xbox each secure around 376 million and 283 million downloads respectively, with a pronounced preference for AAA releases (≈50 % each).
Electronic Arts leads global download counts at roughly 82.8 million, followed by Microsoft (≈71 million) and Sony (≈55 million). Steam’s marketplace favors indie publishers, who account for 60 % of downloads, whereas PlayStation and Xbox are dominated by large studios. Monetization patterns diverge across platforms: Xbox users largely adopt free‑to‑play models (≈39 % of downloads), driven by Game Pass and cross‑platform titles, whereas Steam users prefer premium content (≈79 % paid). PlayStation exhibits the highest premium skew among consoles, with 83 % of downloads from paid titles.
Microsoft’s year‑to‑date download total reaches 452 million, with mobile accounting for 83 % of that figure and PC/console contributing 75 million. Sony’s strategy focuses on internal studios, generating 55 million PC/console downloads and 15 million mobile downloads centered on anime‑IP titles. Key publishers such as Kepler Interactive and Deep Silver excel in AA performance, while American and Japanese studios dominate global PC/console downloads—particularly on Xbox (over 50 % US share) and PlayStation (22 % Japanese share).
Monster Hunter Wilds illustrates a shift from pre‑launch pet and cooking themes to post‑launch epic gameplay, with US creatives featuring PlayStation branding and Japanese creatives using Capcom branding. Steam remains the dominant download platform, delivering nearly four times more downloads than PlayStation. The campaign’s channel shift saw TikTok fall from #2 to #7 post‑launch, while OTT rose to #2 in US spend, indicating a transition from trend‑driven hype to sustained engagement.
- Steam remains the dominant platform for PC/console gaming, generating approximately 450 million downloads year-to-date, which is nearly four times the volume of PlayStation.
- Monetization strategies are platform-specific: 79% of Steam downloads and 83% of PlayStation downloads are premium, while 39% of Xbox downloads are free-to-play, largely driven by Game Pass.
- Indie and AA developers drive the majority of the 262 million action-genre downloads, with indie titles accounting for 60% of total downloads on Steam.
- Electronic Arts leads global download counts at 82.8 million, followed by Microsoft at 71 million and Sony at 55 million for PC/console segments.
- Console ecosystems show a strong preference for AAA releases, which constitute approximately 50% of downloads on both PlayStation and Xbox.
+3
Sensor Tower

Report9 pages
The Rise of the Financial Kingmakers: Private Equity’s $21B+ Bet on Gaming
The analysis demonstrates that private equity (PE) has increasingly positioned itself as a decisive force in the gaming sector, channeling more than $21 billion into acquisitions and growth investments from 2018 through the first half of 2025. Annual deal values consistently exceeded $1 billion, underscoring the industry’s institutional maturity and attracting a broad spectrum of PE participants. Control acquisitions dominate, accounting for roughly 60 % of total capital deployed, with notable deals such as Scopely’s $4.9 billion purchase of Games Group and ESL’s $1.5 billion takeover of Facet Games Group. Minority stake purchases, while smaller in dollar terms, remain significant for content and ecosystem players, exemplified by Vungle’s $0.8 billion control of an ecosystem firm.
Geographically, the focus is global but heavily weighted toward North America and Europe, with a growing presence in mobile and PC/console segments. The data reveal that content creation—particularly studios with strong IP portfolios—is the most attractive segment, receiving 42 of the 68 PE‑led deals. Ecosystem investments, including platform and service providers, constitute a substantial share of growth capital, reflecting PE’s strategy to build scalable ecosystems around core IP.
Methodologically, the study aggregates publicly disclosed transactions from 2018 to mid‑2025, classifying deals by type (control acquisition, minority stake, growth investment, add‑on) and segment. Deal values are sourced from press releases, SEC filings, and reputable financial databases, with exit returns estimated where available. The findings illustrate a shift toward platform‑building and ecosystem consolidation as the default PE playbook, positioning financial investors as key enablers of scale in a structurally fragmented gaming market.
- Private equity firms deployed over $21 billion into the gaming sector between 2018 and mid-2025, with annual deal values consistently surpassing $1 billion.
- Control acquisitions represent the primary investment strategy, accounting for approximately 60% of total capital deployed in the sector.
- Content creation studios holding strong IP portfolios are the most targeted assets, securing 42 of the 68 total private equity-led deals identified.
- Notable high-value transactions include Scopely’s $4.9 billion acquisition of Games Group and ESL’s $1.5 billion takeover of Facet Games Group.
- Private equity strategy is shifting toward platform-building and ecosystem consolidation to scale fragmented gaming markets, supported by minority stake investments in service and platform providers.
+2
InvestGame