Square
Company
Documents about Square
Square Enix Holdings 1Q FY2018/3 Financial Results Briefing
Square Enix Holdings reported strong financial growth for the first quarter of the fiscal year ending March 31, 2018.
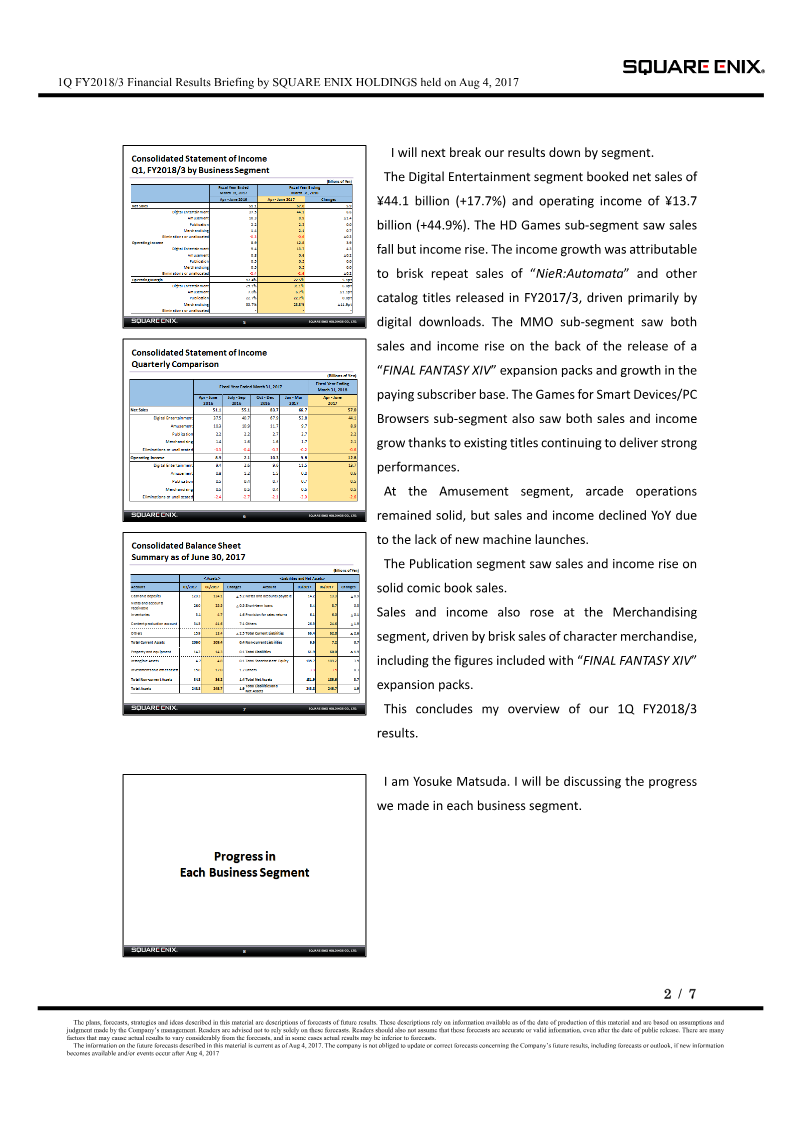
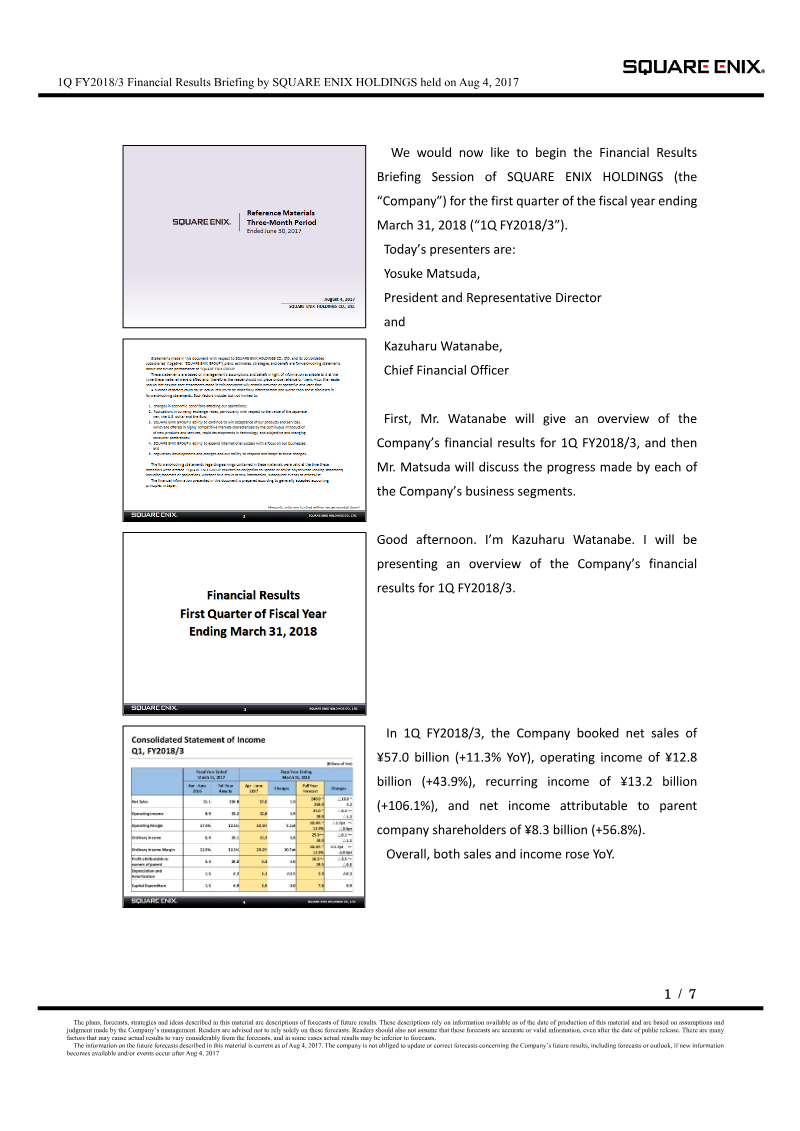
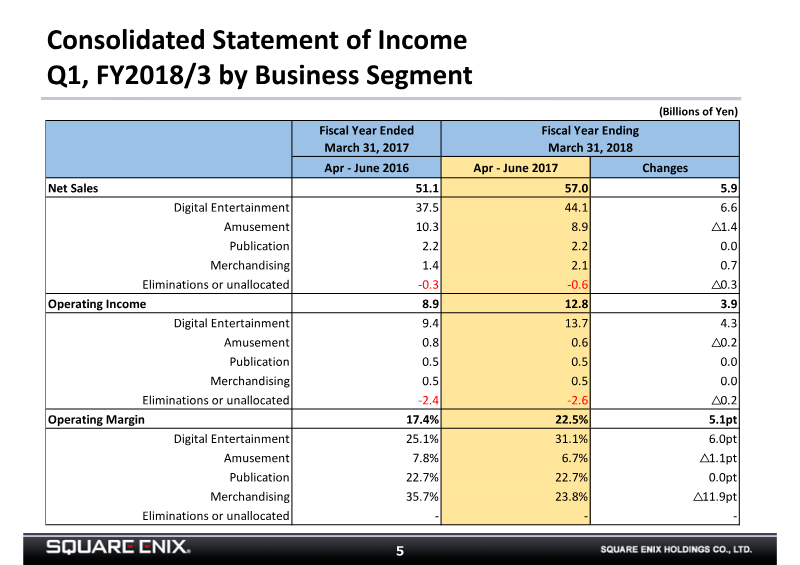
- Square Enix reported strong 1Q FY2018/3 results with net sales of ¥57.0 billion (+11.3% YoY) and operating income of ¥12.8 billion (+43.9% YoY).
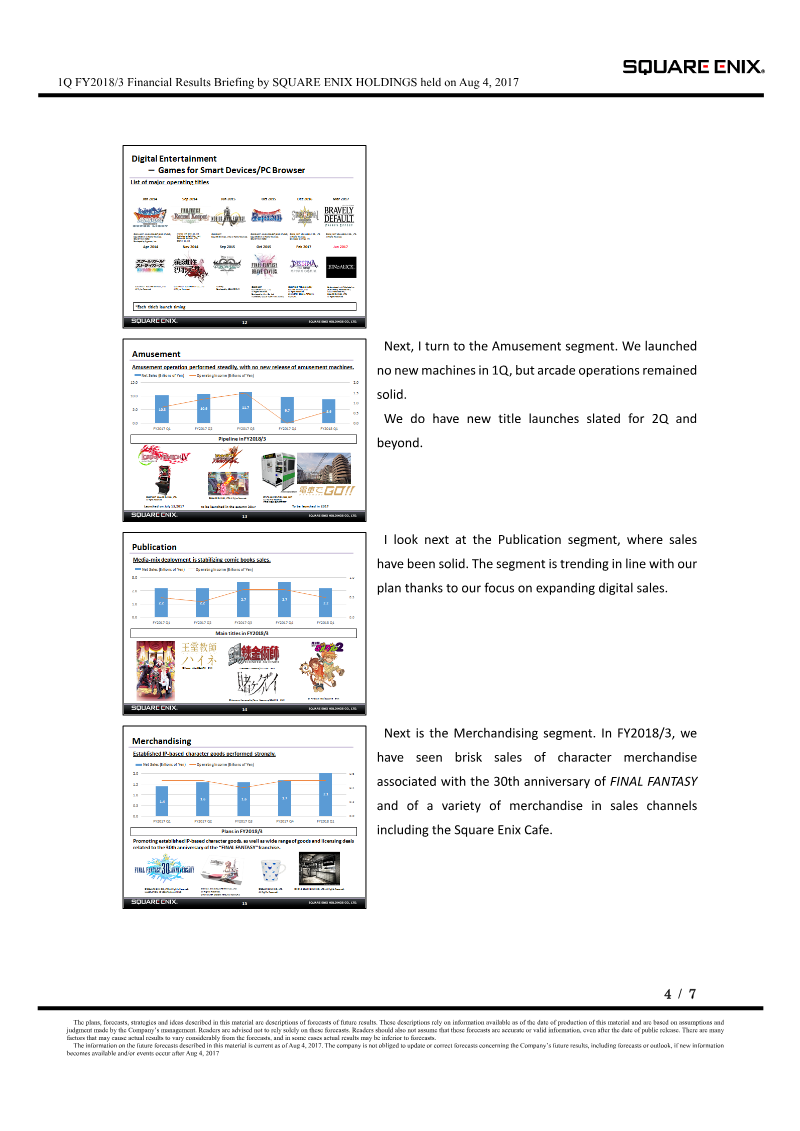
- The Digital Entertainment segment drove performance with ¥44.1 billion in sales (+17.7% YoY) and ¥13.7 billion in operating income (+44.9% YoY).
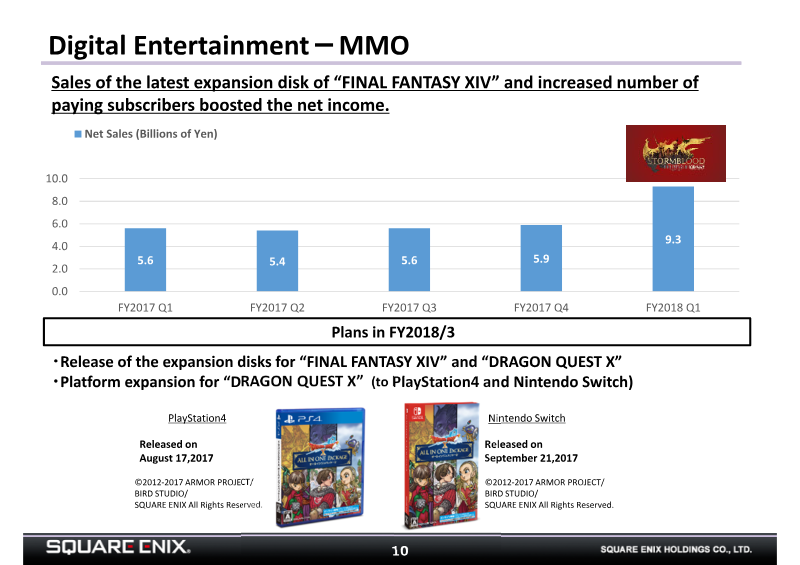
- Growth in the Games for Smart Devices/PC Browsers sub-segment was bolstered by license fees from Machine Zone, Inc. for 'FINAL FANTASY XV: A NEW EMPIRE' and the full amortization of development costs for existing titles.

Square Enix Holdings Three-Month Period Ended June 30, 2017: Reference Materials
Square Enix Holdings reported strong financial growth for the first quarter of the fiscal year ending March 31, 2018, covering the period from April 1 to June 30, 2017.
Square Enix Holdings Consolidated Financial Results: Three-Month Period Ended June 30, 2017
Square Enix Holdings reported strong financial growth for the three-month period ending June 30, 2017, driven primarily by robust performance in its Digital Entertainment segment.
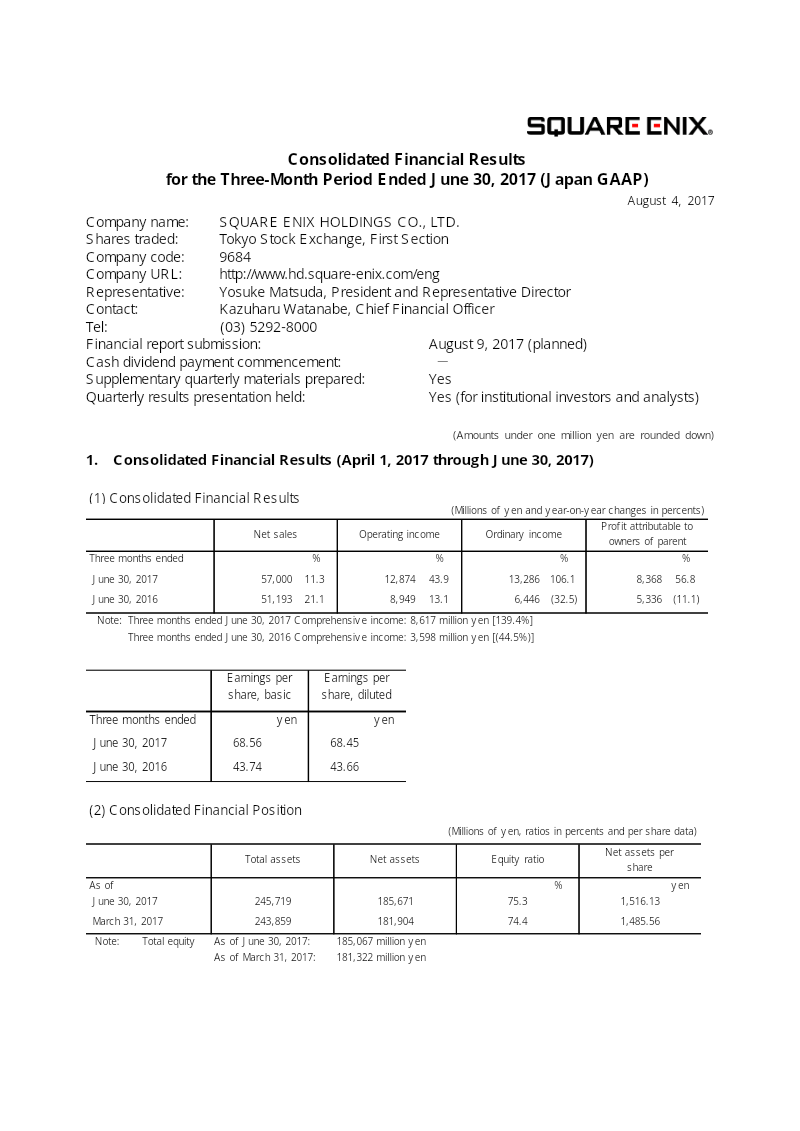
- Square Enix reported strong growth for the three-month period ended June 30, 2017, with net sales rising 11.3% to ¥57,000 million and operating income increasing 43.9% to ¥12,874 million compared to the same period in 2016.
- The Digital Entertainment segment was the primary growth driver, achieving ¥44,168 million in net sales and ¥13,724 million in operating income, representing year-on-year increases of 17.7% and 44.9% respectively.
- Digital Entertainment performance was bolstered by strong download sales of catalogue titles like 'NieR:Automata,' consistent success from smart device games such as 'FINAL FANTASY BRAVE EXVIUS,' and increased revenue from 'FINAL FANTASY XIV' following its latest expansion.

The Hitman GO Design Postmortem
The transition of Square Enix Montreal from cancelled AAA console development to mobile production necessitated a strategic pivot that prioritized creative incubation and brand adaptation.
- Square Enix Montreal developed Hitman GO within a six-month production window by utilizing a small, agile team and an incubation process that allowed staff to propose mobile-first concepts for established brands.
- The core gameplay mechanics were prototyped in just two weeks, focusing on turn-based strategy and diorama-style visuals to differentiate the title from traditional AAA stealth games.
- The team adopted a 'bottom-up' design philosophy, embracing unconventional ideas and constraints—such as the board game aesthetic—to solve the challenge of adapting a complex franchise for mobile platforms.
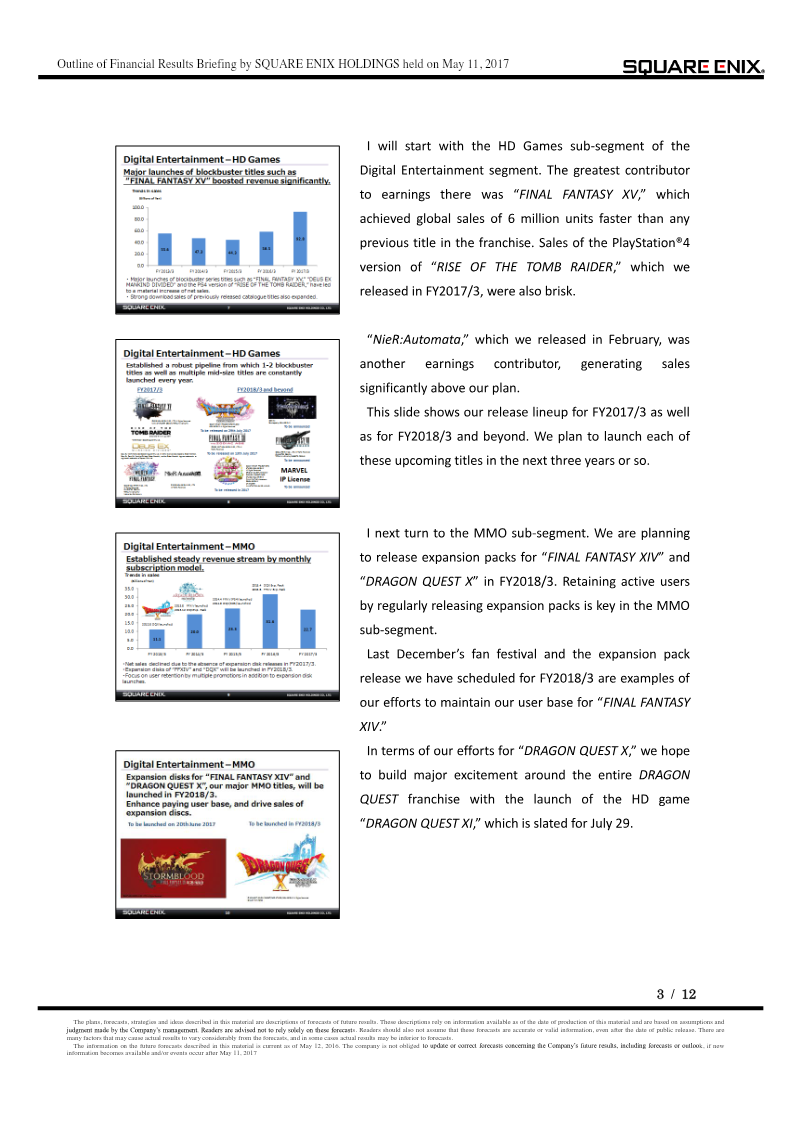
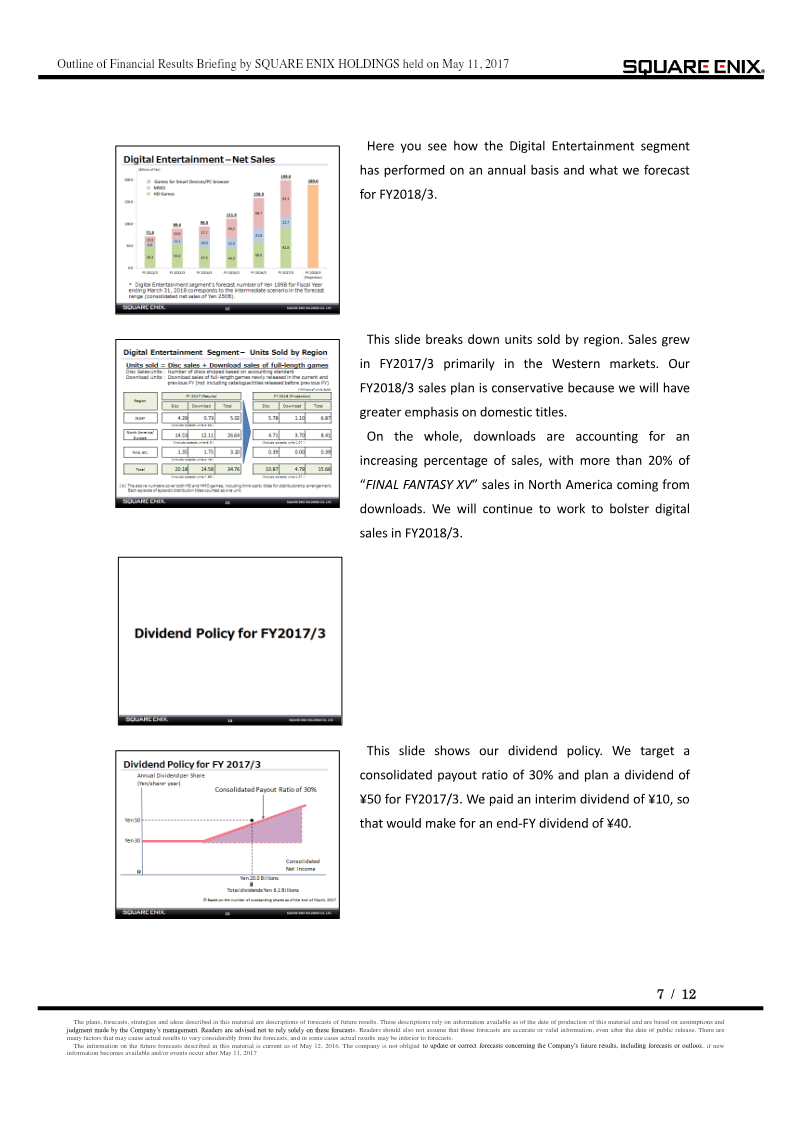
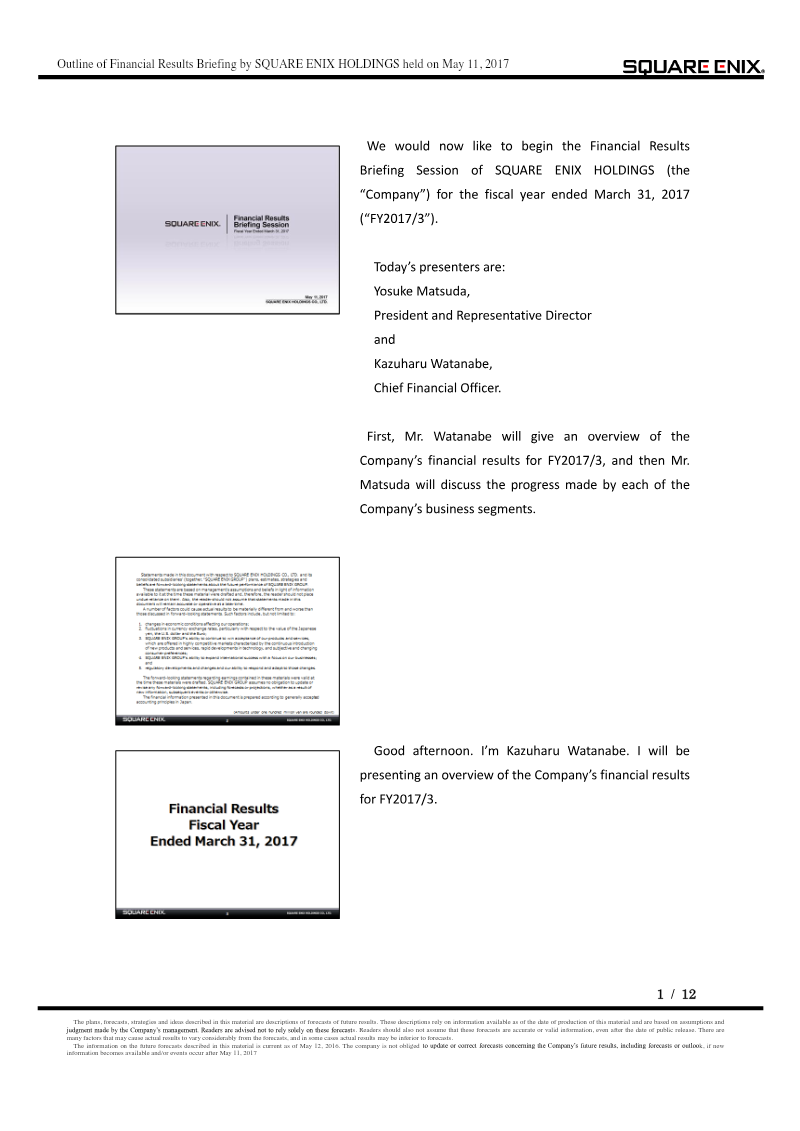
Financial Results Briefing: Square Enix Holdings FY2017/3
Square Enix Holdings achieved record-breaking financial performance for the fiscal year ended March 31, 2017, reporting net sales of ¥256.8 billion and operating income of ¥31.2 billion.
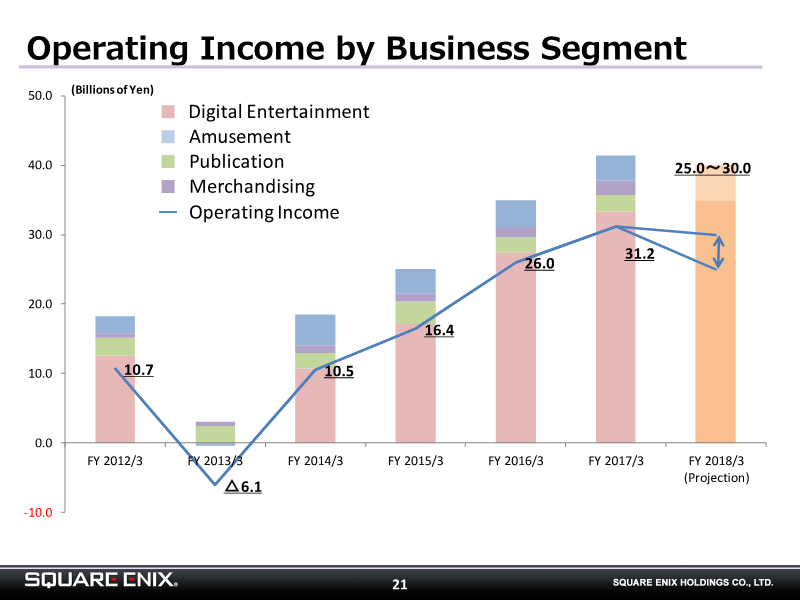
- Square Enix achieved record financial results for FY2017/3, reporting net sales of ¥256.8 billion and operating income of ¥31.2 billion, representing year-over-year growth of 20% and 20.3% respectively.
- The Digital Entertainment segment drove performance through the successful launches of Final Fantasy XV and NieR:Automata, while the company strategically divested from IO Interactive A/S to focus on core franchises.
- Management set a medium-term growth target for approximately 2020 of ¥300–400 billion in net sales and ¥40–50 billion in operating income.
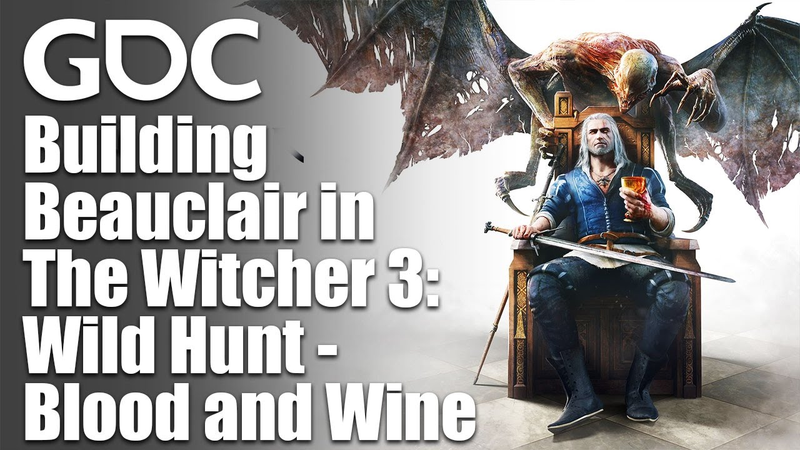
Building Beauclair in The Witcher 3: Wild Hunt - Blood and Wine
The development of Beauclair for The Witcher 3: Blood and Wine centered on creating a dense, vacation-inspired urban environment that balanced high visual fidelity with rigorous technical performance constraints.
- To manage performance in the dense city of Beauclair, the team used Umbra to optimize rendering by limiting the number of visible meshes based on the player's line of sight, significantly reducing triangle counts for complex structures.
- The development team implemented a custom blend shader that used monochromatic textures combined with color tints and pattern overlays to create unique visual variations for assets while minimizing memory usage.
- Designers controlled player navigation and visibility by bending streets and using landmarks like the Gorgon Mountain and the palace to break lines of sight, which helped hide asset popping and streaming latency.

Square Enix Holdings Financial Results: Fiscal Year Ended March 31, 2017
Square Enix Holdings reported strong financial growth for the fiscal year ended March 31, 2017, driven primarily by the successful launch of major blockbuster titles.
- Square Enix reported consolidated net sales of 256.8 billion yen and operating income of 31.2 billion yen for the fiscal year ended March 31, 2017, representing a year-over-year increase of 42.7 billion yen in sales and 5.2 billion yen in operating income.
- The Digital Entertainment segment remains the primary revenue driver, contributing 199.0 billion yen in net sales and 33.3 billion yen in operating income for FY2017/3.
- Revenue from games for smart devices and PC browsers saw significant growth, reaching 83.3 billion yen in FY2017/3 compared to 44.2 billion yen in FY2015/3.



FY2017 Third Quarter Financial Results
GREE’s financial results for the third quarter of fiscal year 2017 demonstrate a period of strategic transition and growth, characterized by a recovery in the domestic native game business and expansion into video-related media.
- GREE reported Q3 FY2017 net sales of ¥15.9 billion and operating income of ¥1.5 billion, marking quarter-on-quarter growth for both metrics.
- Domestic native game performance recovered, with coin consumption rising to 5.4 billion following a successful release blitz of new titles.
- The company released two new first-party IP titles, Rara-MAGI and A Farewell to Arms, and currently has ten titles in development, including the SINoALICE collaboration with Square Enix.

U.K. Road Show Material: February 2017
The February 2017 investor presentation outlines a mid-term growth strategy for Square Enix, centered on achieving six consecutive years of sales growth through the expansion of its Digital Entertainment segment.
- Square Enix aims to reach 400 billion JPY in sales by fiscal year 2019, targeting six consecutive years of growth in its Digital Entertainment segment.
- The company is prioritizing profitability in its high-definition (HD) gaming division while maintaining a stable revenue foundation through MMOs and smart device games.
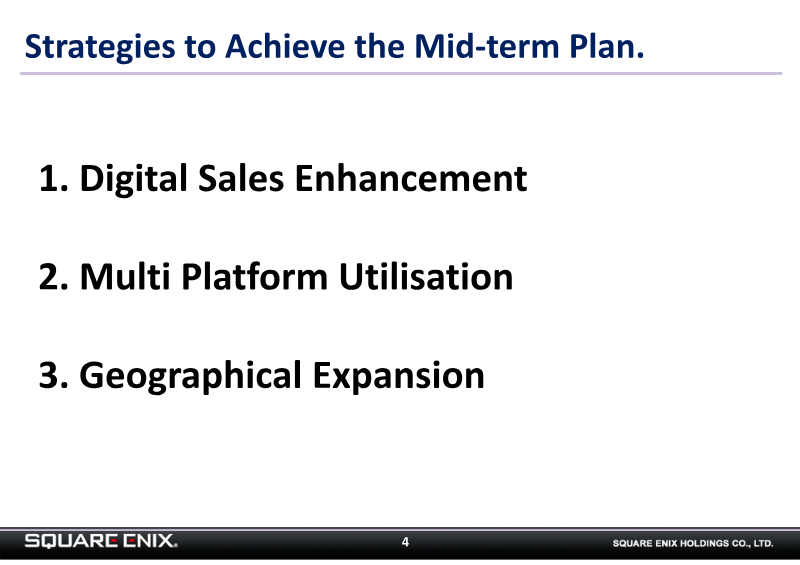
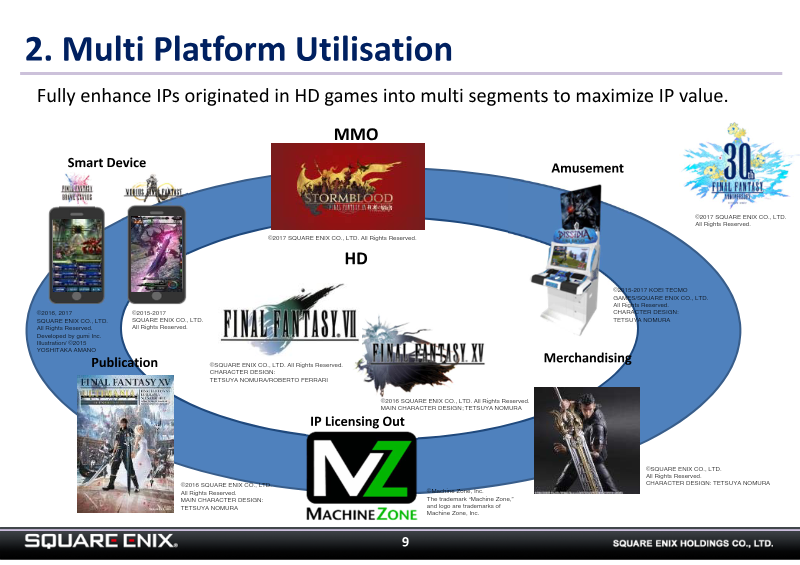
- Strategy focuses on three pillars: enhancing digital sales via a new global website, maximizing multi-platform accessibility across consoles, PC, and mobile, and expanding IP into merchandising and publishing.
Square Enix Holdings 3Q FY2017/3 Financial Results Briefing
Square Enix Holdings reported financial results for the nine-month period ending December 31, 2016, reflecting a period of high-profile releases balanced by significant development cost amortization.
- Square Enix reported 1-3Q FY2017/3 net sales of ¥190.1 billion and operating income of ¥21.5 billion, with operating income declining year-over-year despite a sharp rise in Digital Entertainment sales.
- Final Fantasy XV reached 6 million units in shipments by early 4Q, with development costs fully amortized in 3Q, allowing future downloads and repeat sales to contribute directly to earnings.
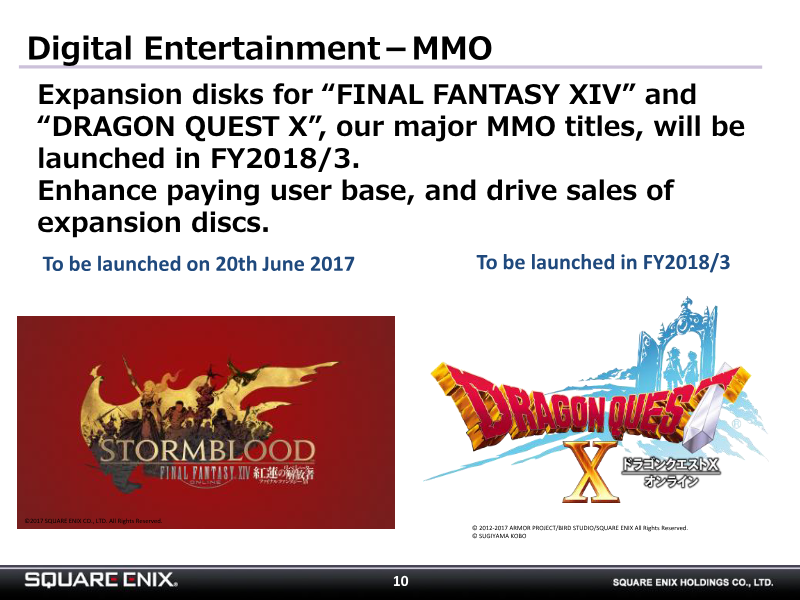
- The Digital Entertainment segment experienced a ¥1.4 billion decline in operating income due to lower MMO expansion disk sales compared to the previous year and the heavy amortization of FFXV development costs.

Reference Materials: Nine-Month Period Ended December 31, 2016
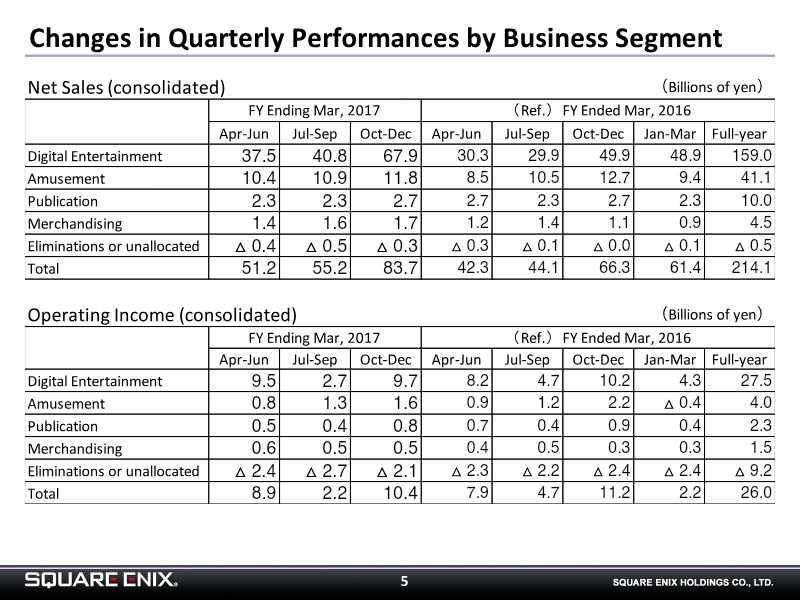
This financial summary outlines the performance of Square Enix Holdings Co., Ltd. for the nine-month period ending December 31, 2016.
- Square Enix reported net sales of 190.1 billion yen for the nine-month period ended December 31, 2016, a significant increase from 152.8 billion yen in the same period of the previous year.
- Operating income for the nine-month period declined to 21.5 billion yen from 23.8 billion yen in the prior year, despite the substantial growth in net sales.
- The Digital Entertainment segment remains the primary revenue driver, contributing 146.2 billion yen in sales, though its operating margin compressed from 21.0% to 14.9% year-over-year.
Square Enix Holdings Financial Results Briefing: 1H FY2017/3
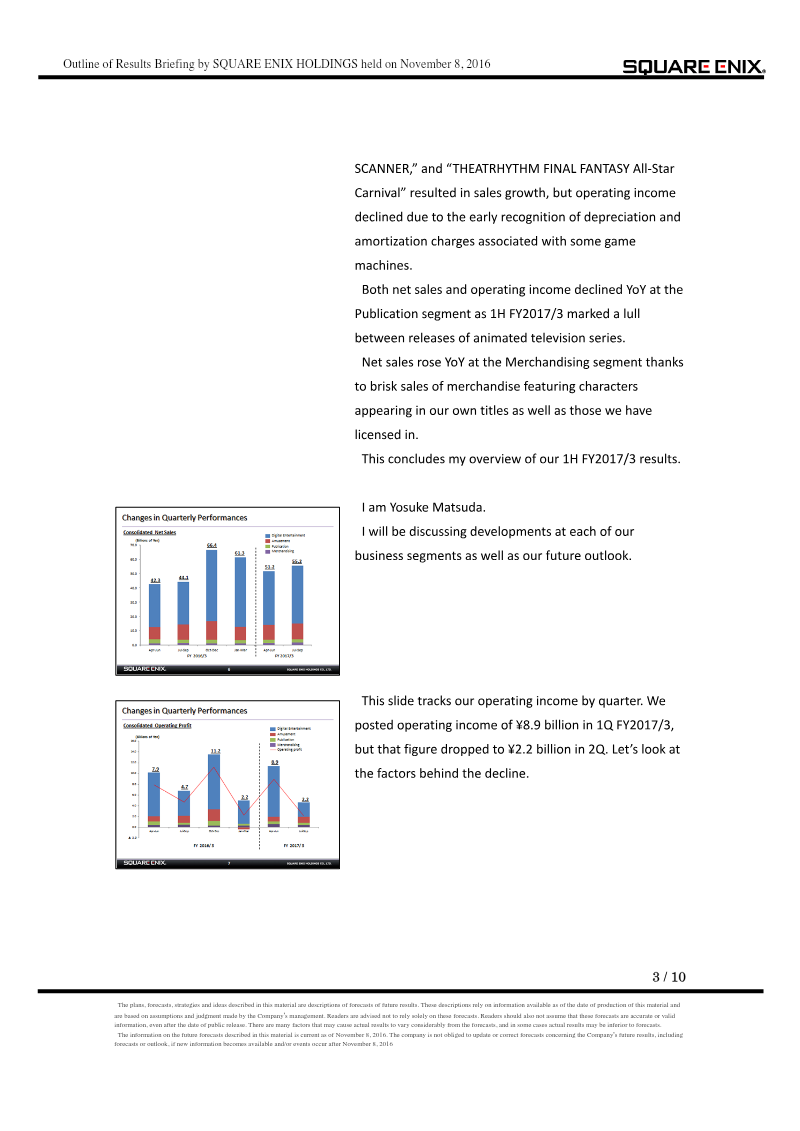
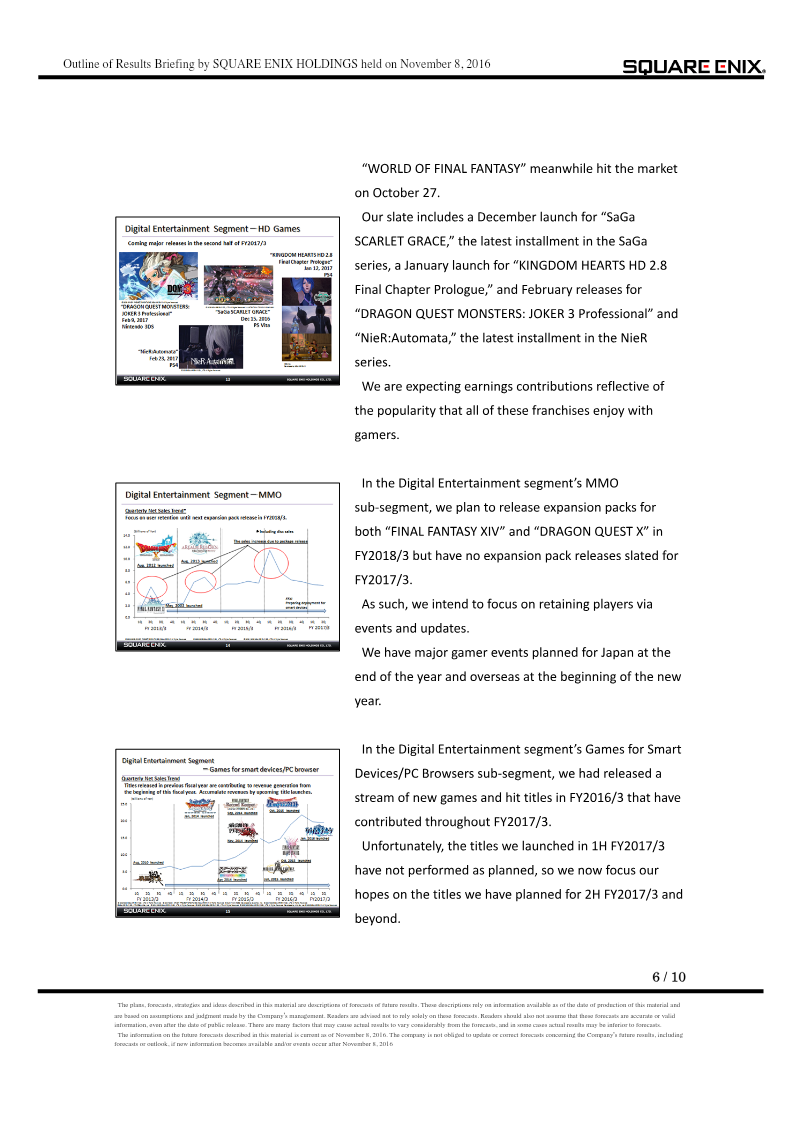
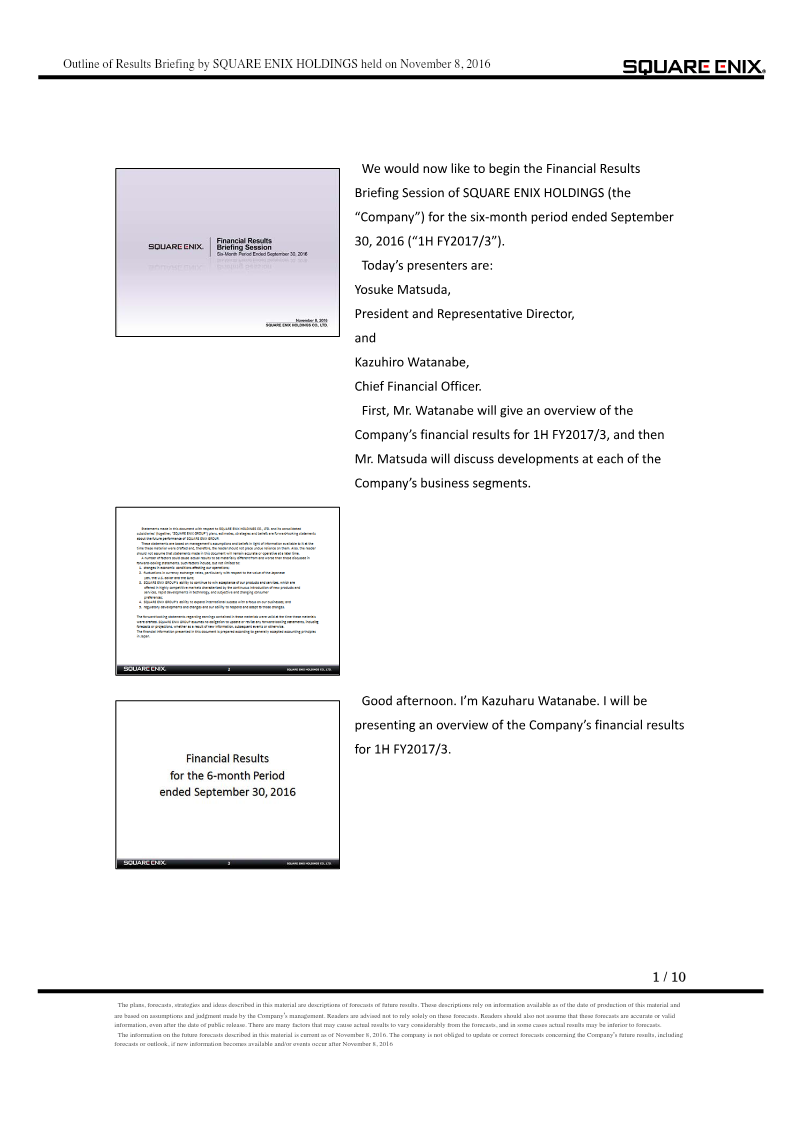
Square Enix Holdings reported financial results for the first half of fiscal year 2017, ending September 30, 2016. The company achieved net sales of ¥106.3 billion, representing a year-over-year increase of ¥20 billion.
- Square Enix reported 1H FY2017 net sales of ¥106.3 billion, a year-over-year increase of ¥20 billion, despite a decline in net income to ¥5.5 billion.
- Operating income fell by ¥1.5 billion to ¥11.1 billion, driven by high development cost amortization for major titles and underperforming smart device games.
- Digital Entertainment revenue growth was fueled by the overseas launches of Deus Ex: Mankind Divided, Hitman, and the PlayStation 4 version of Rise of the Tomb Raider.
