Square
Company
Documents about Square
Square Enix Holdings 1Q FY2019/3 Financial Results Briefing
Square Enix Holdings reported a decline in financial performance for the first quarter of the fiscal year ending March 31, 2019.
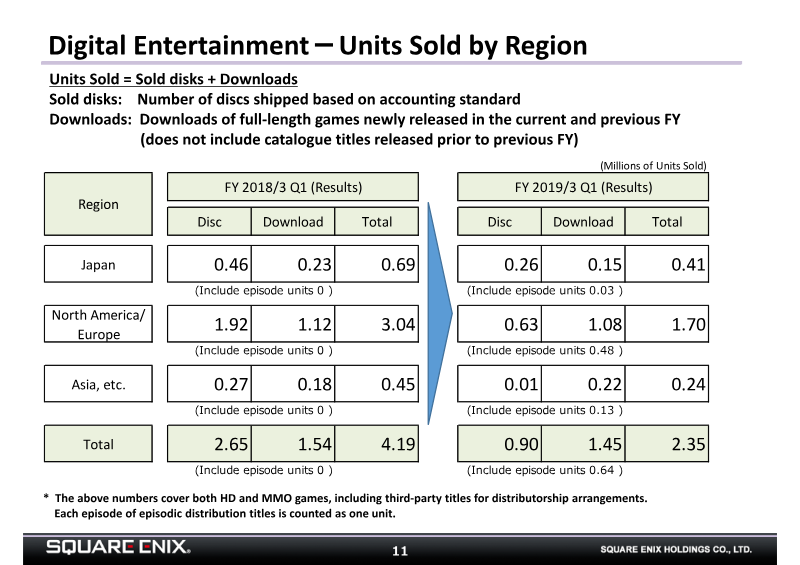

Square Enix Holdings: Reference Materials for the Three-Month Period Ended June 30, 2018
Square Enix Holdings’ financial results for the first quarter of the fiscal year ending March 31, 2019, reflect a period of year-over-year decline across most business segments.
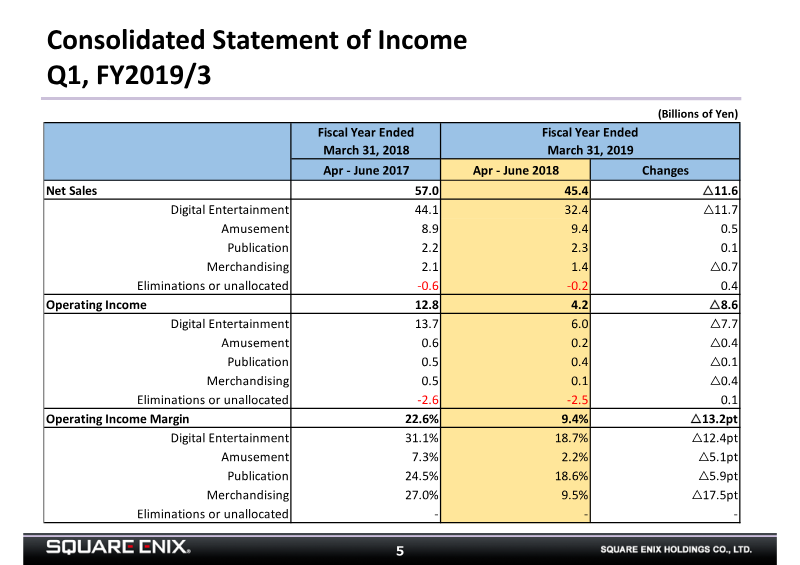
- Square Enix reported a decline in Q1 FY2019/3 performance compared to the same period in 2018, with net sales falling from 57.0 billion yen to 45.4 billion yen and operating income dropping from 12.8 billion yen to 4.2 billion yen.
- The Digital Entertainment segment, the company's primary revenue driver, saw net sales decrease to 32.4 billion yen in Q1 FY2019/3, down from 44.1 billion yen in Q1 FY2018/3.
- MMO revenue declined year-over-year due to the absence of a major expansion disk launch for 'Final Fantasy XIV' compared to the previous year's 'Stormblood' release.
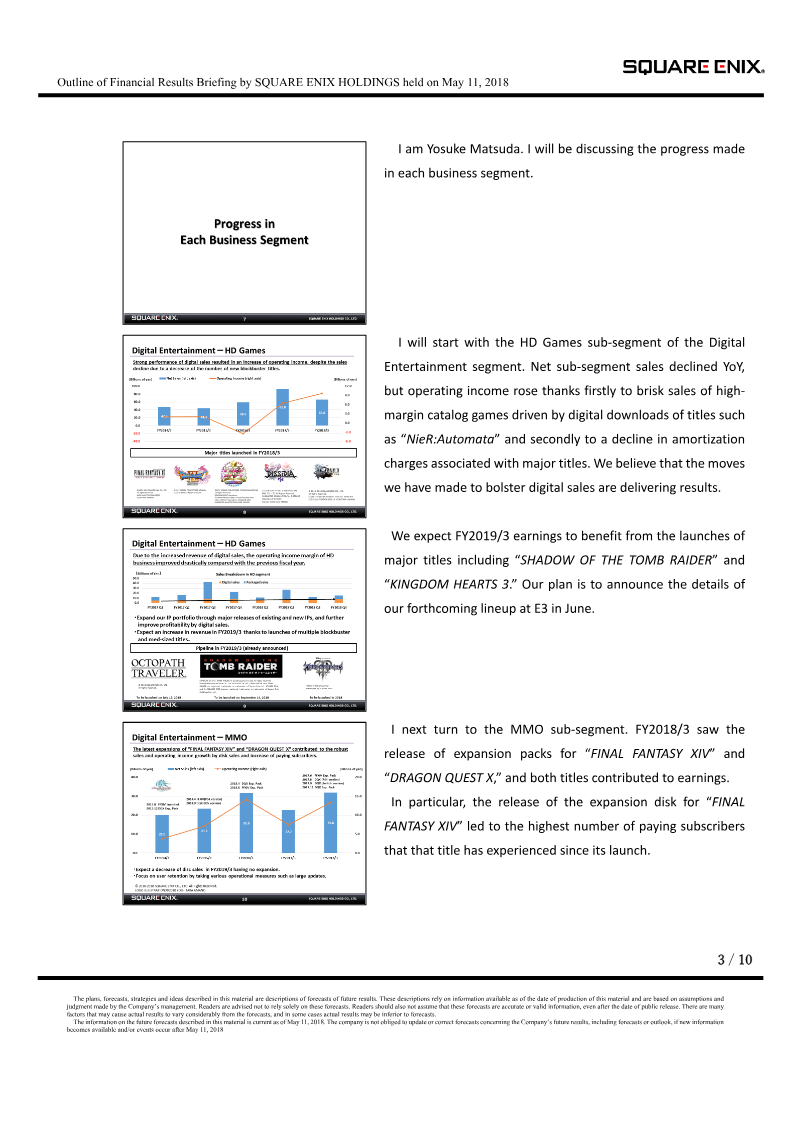
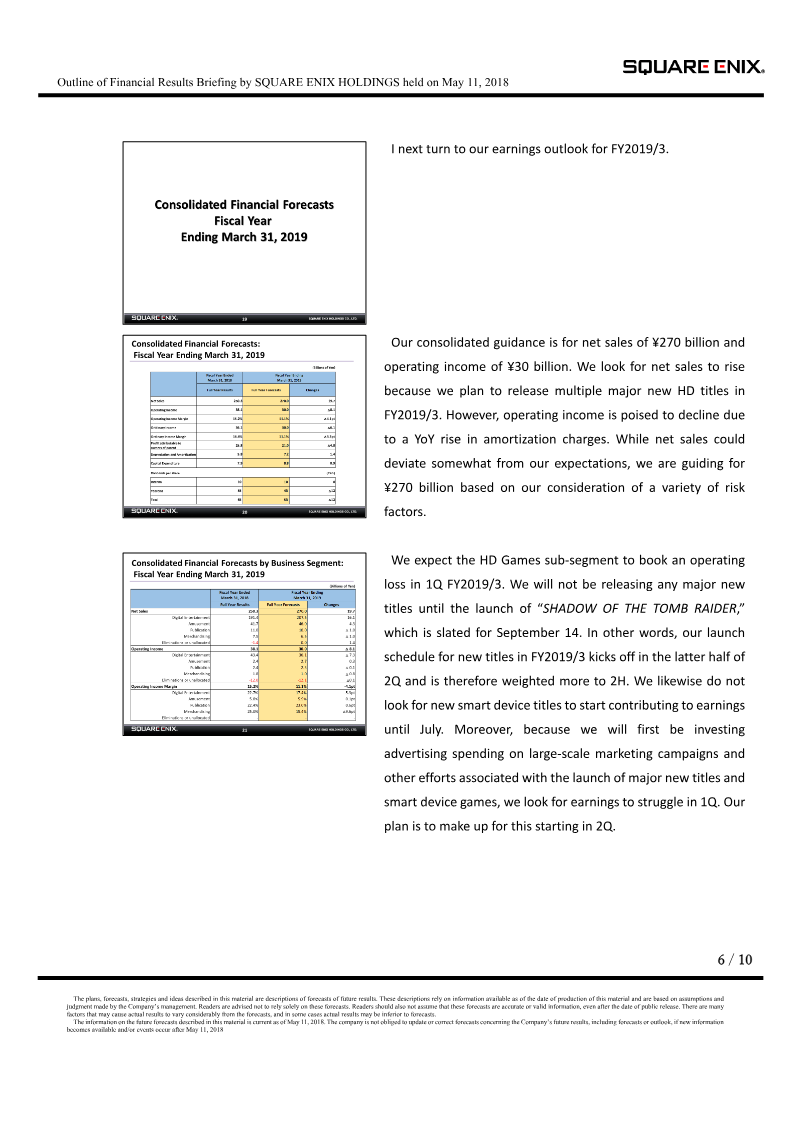
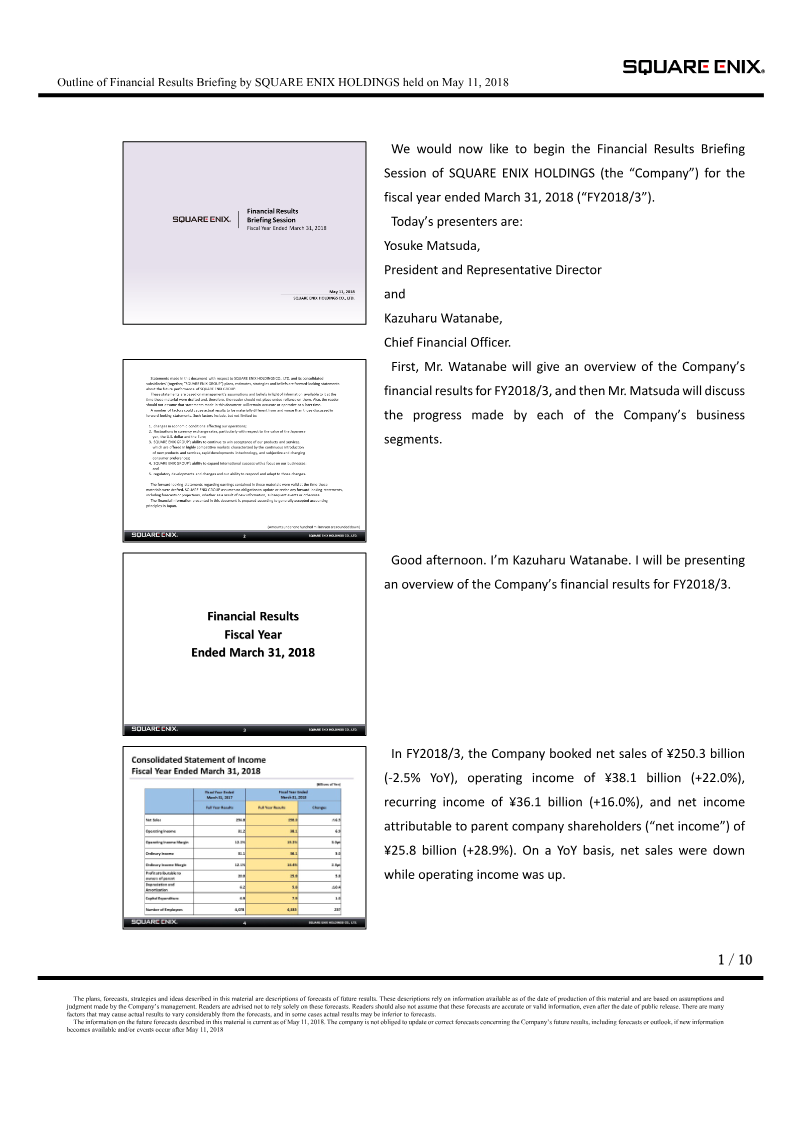
Financial Results Briefing: Fiscal Year Ended March 31, 2018
Square Enix Holdings reported its financial results for the fiscal year ended March 31, 2018, highlighting a period of strategic transition toward digital-first revenue streams.
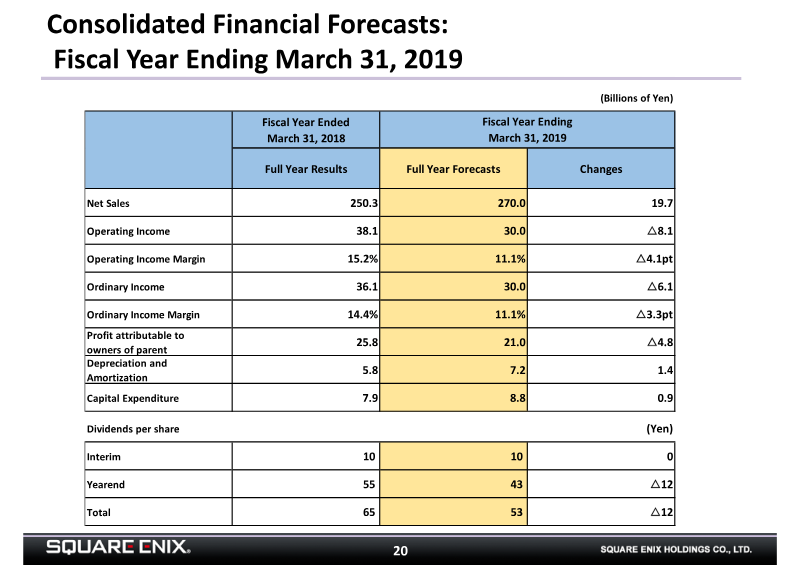
- Square Enix reported FY2018 net sales of ¥250.3 billion, a 2.5% decrease, while operating income grew 22.0% to ¥38.1 billion and net income rose 28.9% to ¥25.8 billion.
- The company set medium-term targets for the fiscal year ending March 31, 2020, aiming for ¥300–400 billion in net sales and ¥40–50 billion in operating income.
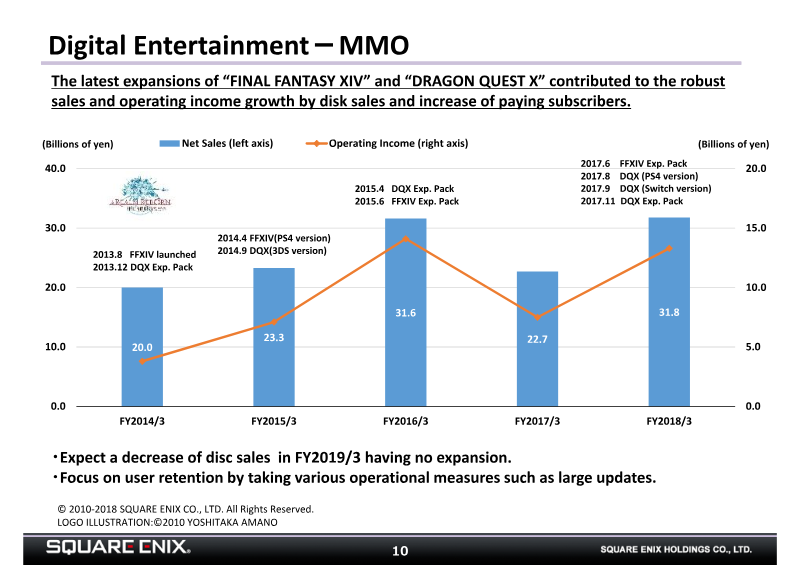
- Growth was driven by high-margin digital catalog sales, specifically NieR:Automata, and expansion packs for MMO titles Final Fantasy XIV and Dragon Quest X.

Square Enix Holdings Financial Results: Fiscal Year Ended March 31, 2018
Square Enix Holdings reported its financial results for the fiscal year ended March 31, 2018, demonstrating a period of improved profitability despite a slight decline in overall net sales.
- Square Enix reported a consolidated operating income of 38.1 billion yen for the fiscal year ended March 31, 2018, representing a 6.9 billion yen increase over the previous year despite a slight decline in net sales to 250.3 billion yen.
- The Digital Entertainment segment drove profitability with an operating income of 43.4 billion yen and a margin of 22.7%, bolstered by strong performance in smart device/PC browser games and MMO expansions.
- For the fiscal year ending March 31, 2019, the company forecasts a decline in operating income to 30.0 billion yen, down from 38.1 billion yen, alongside a projected reduction in dividends per share from 65 yen to 53 yen.
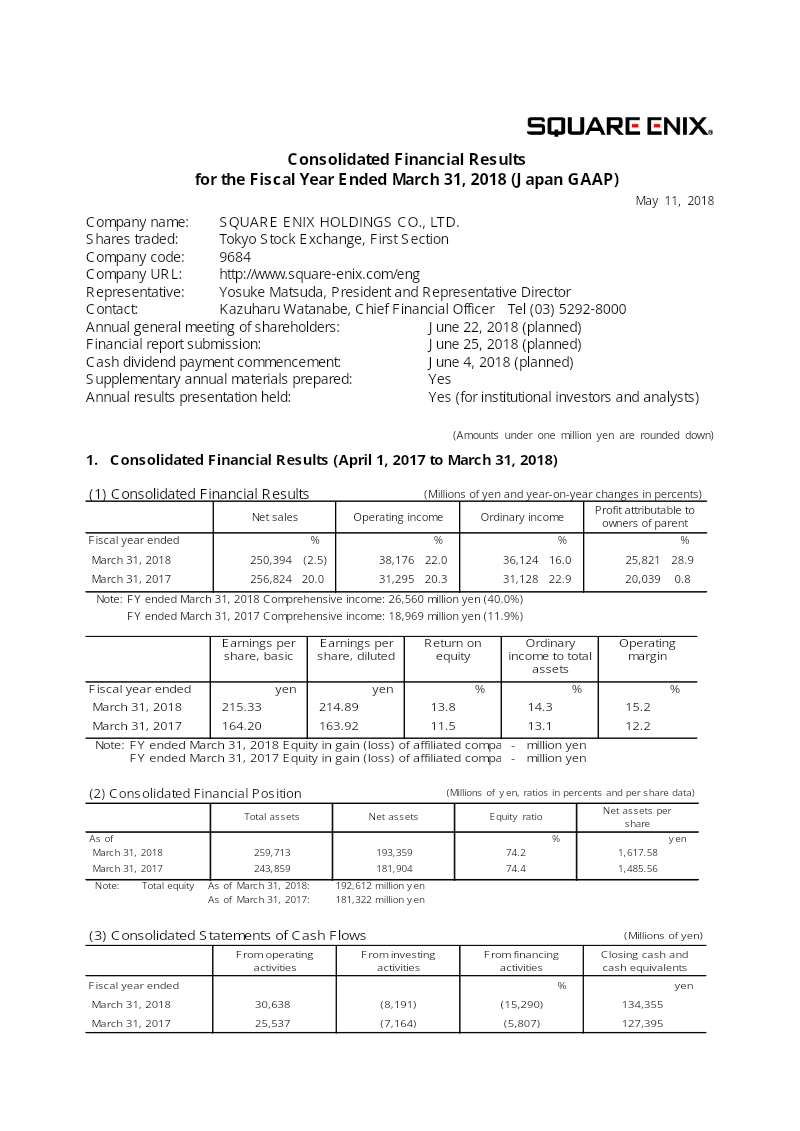
Square Enix Holdings Consolidated Financial Results for the Fiscal Year Ended March 31, 2018
Square Enix Holdings concluded the fiscal year ending March 31, 2018, with a strategic emphasis on high-margin digital content and operational efficiency.
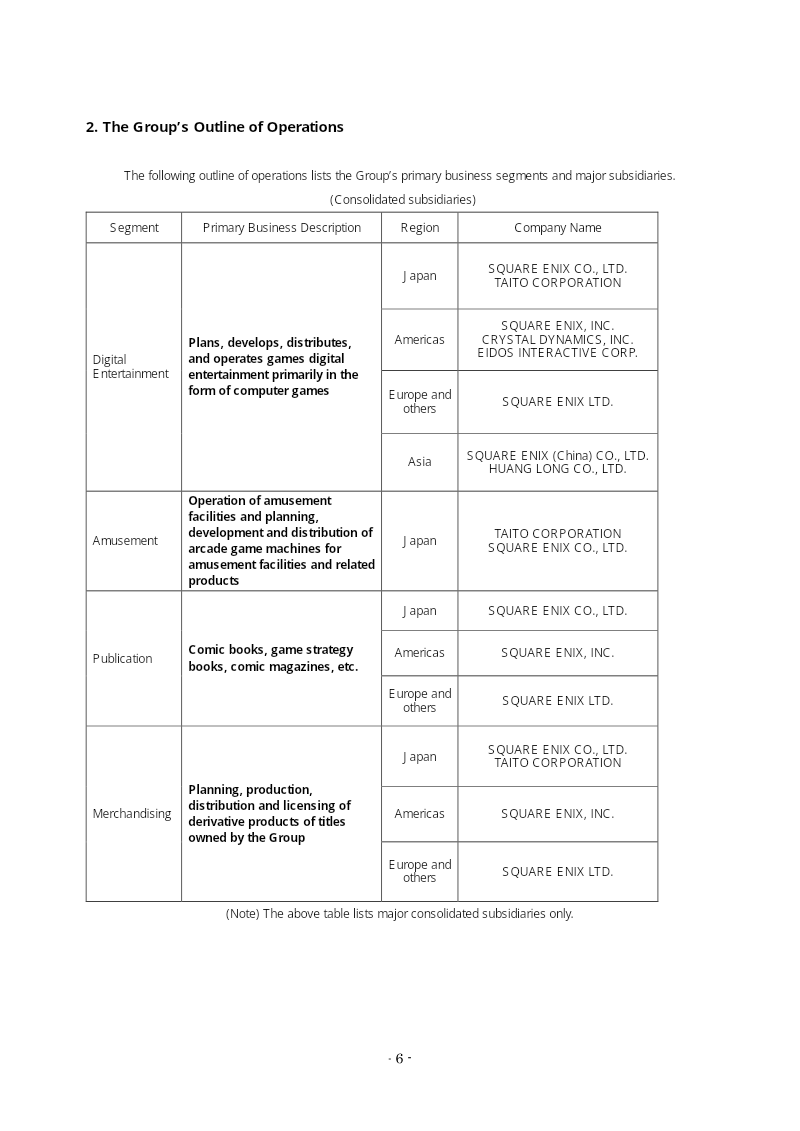
- Square Enix reported net sales of ¥250,394 million for the fiscal year ended March 31, 2018, a 2.5% decrease compared to the previous year.
- Operating income rose significantly to ¥38,176 million, representing a 22.0% year-on-year increase, while profit attributable to owners of the parent grew by 28.9% to ¥25,821 million.
- Ordinary income reached ¥36,124 million, a 16.0% increase over the prior fiscal year, supported by a 15.2% operating margin.

Hatch and the new opportunity of on-demand gaming
The emergence of on-demand, cloud-based gaming represents a significant shift in the mobile industry, mirroring the transition from ownership to subscription models seen in music and video streaming.
- The platform utilizes cloud architecture to stream native Android games, eliminating the need for HTML5 ports and reducing multiplayer prototype development time from months to days.
- The service operates on a dual-revenue model combining advertising and subscriptions, with a commitment to share 70% of generated revenue with content partners.
- The business model shifts mobile gaming from free-to-play monetization loops to a subscription-based, on-demand format that prioritizes premium content quality.
Square Enix Holdings Financial Results Briefing: Nine-Month Period Ended December 31, 2017
Square Enix Holdings reported its financial results for the nine-month period ending December 31, 2017, demonstrating a trend of declining net sales alongside significant growth in operating and recurring income.
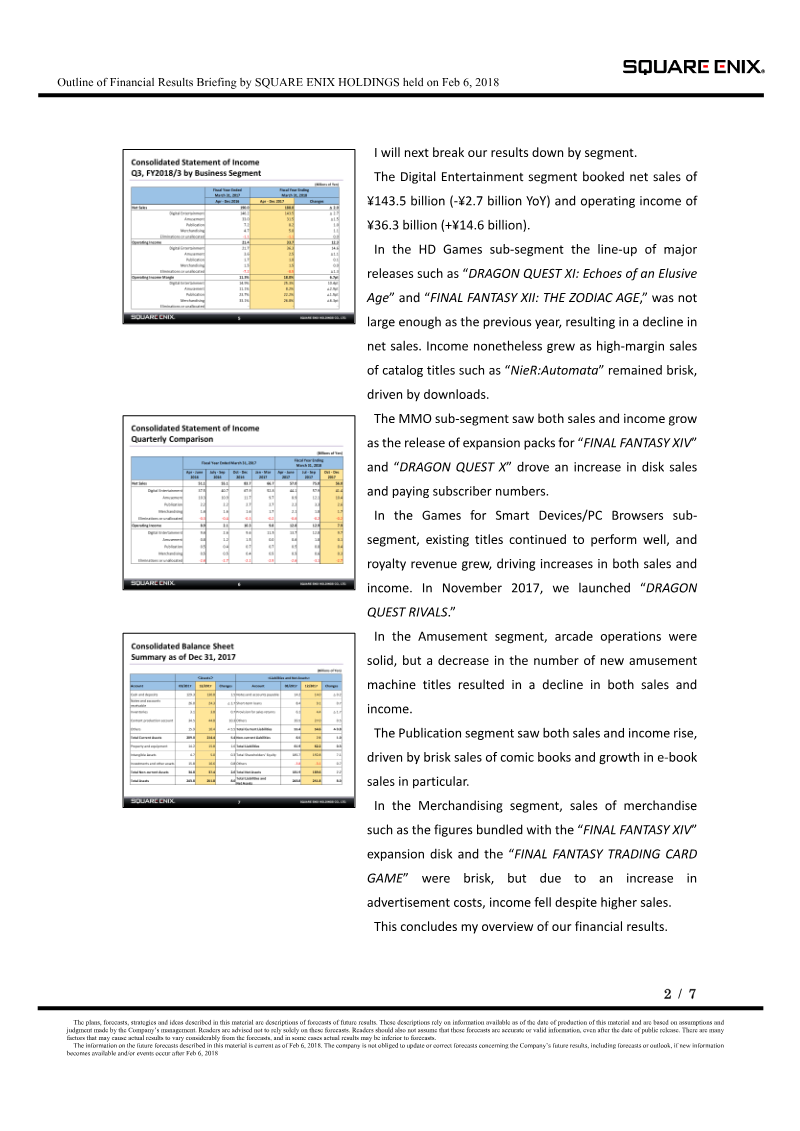
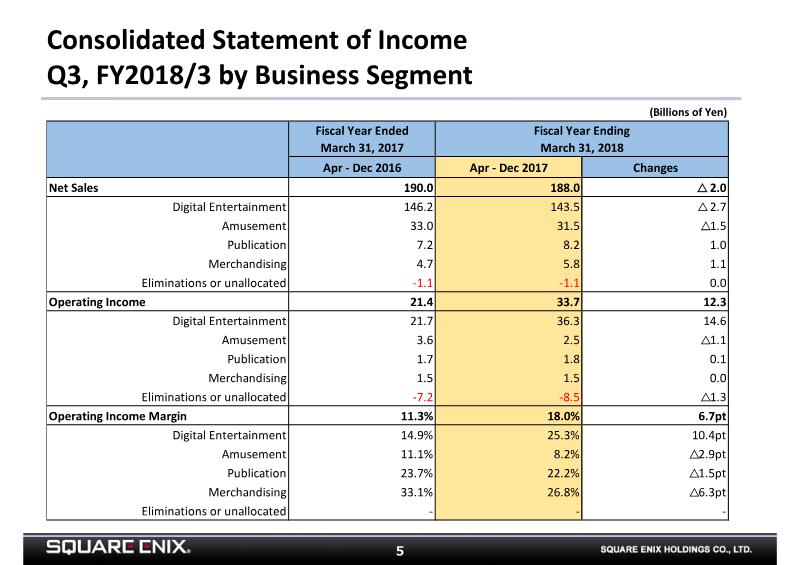
- Square Enix reported a 57.2% increase in operating income to ¥33.7 billion and a 30.9% rise in net income to ¥22.3 billion for the nine-month period ending December 31, 2017, despite a 1.0% decline in net sales to ¥188 billion.
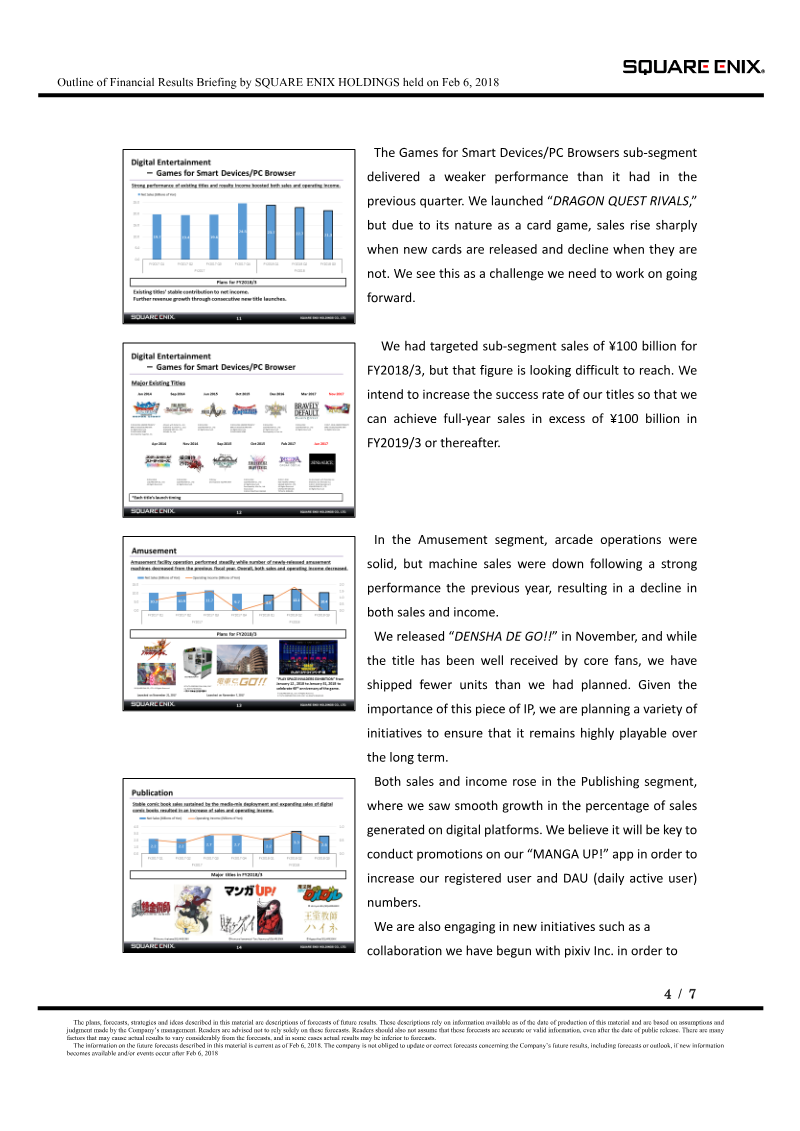
- The Digital Entertainment segment generated ¥143.5 billion in net sales, driven by strong digital catalog sales of titles like NieR:Automata and growth in MMO subscribers following Final Fantasy XIV and Dragon Quest X expansions.
- Profitability improved due to a strategic shift toward high-margin digital sales and catalog monetization, which successfully offset a lighter release schedule for new HD games compared to the previous year.

Square Enix Holdings Nine-Month Financial Results: Period Ended December 31, 2017
The Square Enix Holdings financial results for the nine-month period ending December 31, 2017, demonstrate a period of significant profit growth driven primarily by the company’s Digital Entertainment segment.
- Square Enix reported a significant increase in operating income for the nine-month period ending December 31, 2017, rising to 33.7 billion yen from 21.4 billion yen in the prior year, representing an operating margin of 18.0%.
- The Digital Entertainment segment was the primary driver of growth, with operating income surging to 36.3 billion yen compared to 21.7 billion yen in the previous year, fueled by strong performance in MMO expansions and mobile titles.
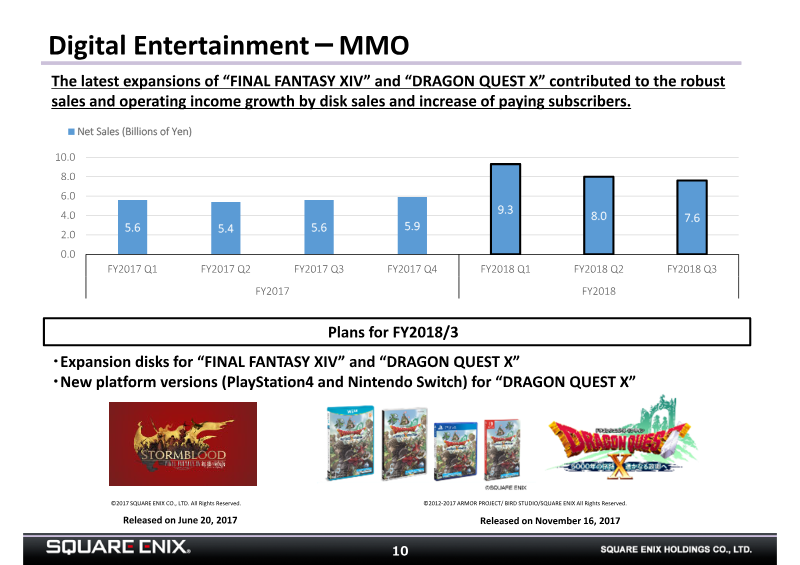
- MMO revenue saw substantial gains due to the release of expansion disks for 'FINAL FANTASY XIV' and 'DRAGON QUEST X' and an increase in paying subscribers.


2018 Annual Report
Square Enix Holdings concluded the 2018 fiscal year with a robust financial performance, characterized by record-high operating and net income despite a marginal 2.5% decline in consolidated net sales to ¥250.4 billion.
- The Square Enix Group's corporate philosophy is to spread happiness globally by providing unforgettable experiences through high-quality content, services, and products.
- The company aims to be a leader in entertainment, focusing on creating new and creative gaming experiences and hit titles, particularly revisiting development and operation organizations in the fiscal year ending March 2019.
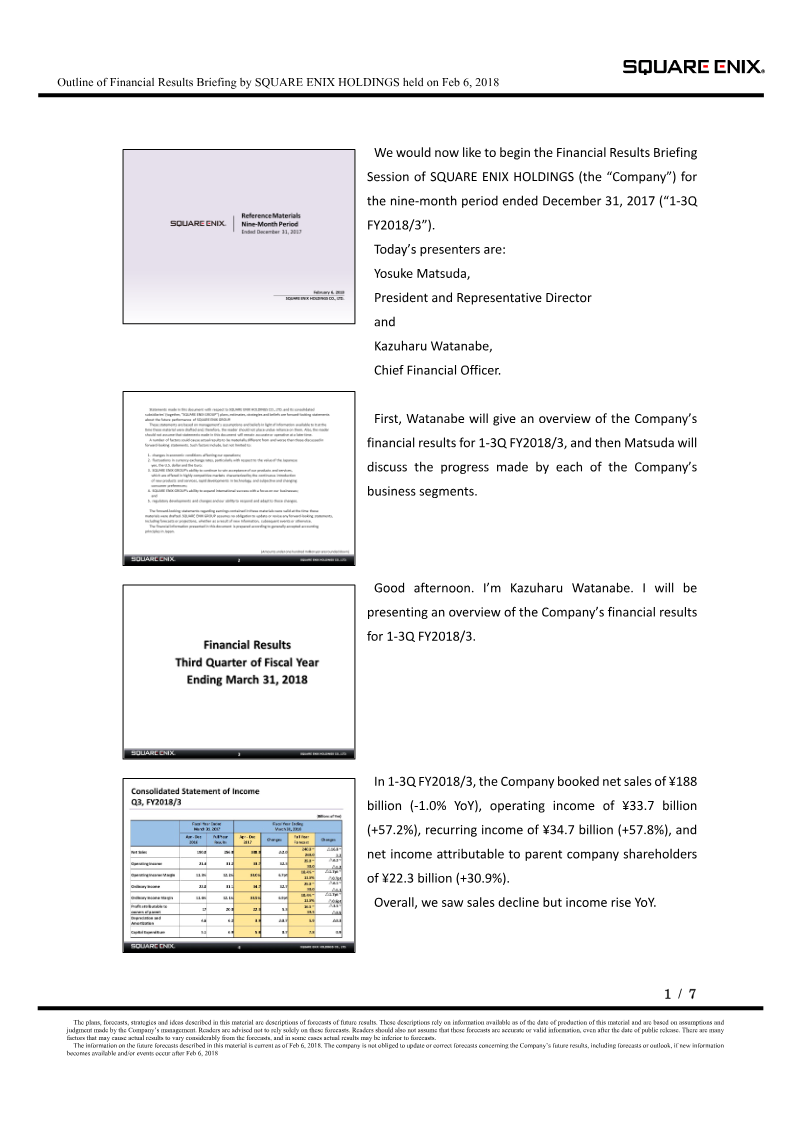
- In the fiscal year ended March 2018, the Amusement segment saw sales decline to ¥41.7 billion and operating income fall to ¥2.4 billion, despite stable arcade operations and new initiatives like renovating Taito Station Mizonokuchi and opening MEGARAGE.
Square Enix Holdings 2Q FY2018/3 Financial Results Briefing
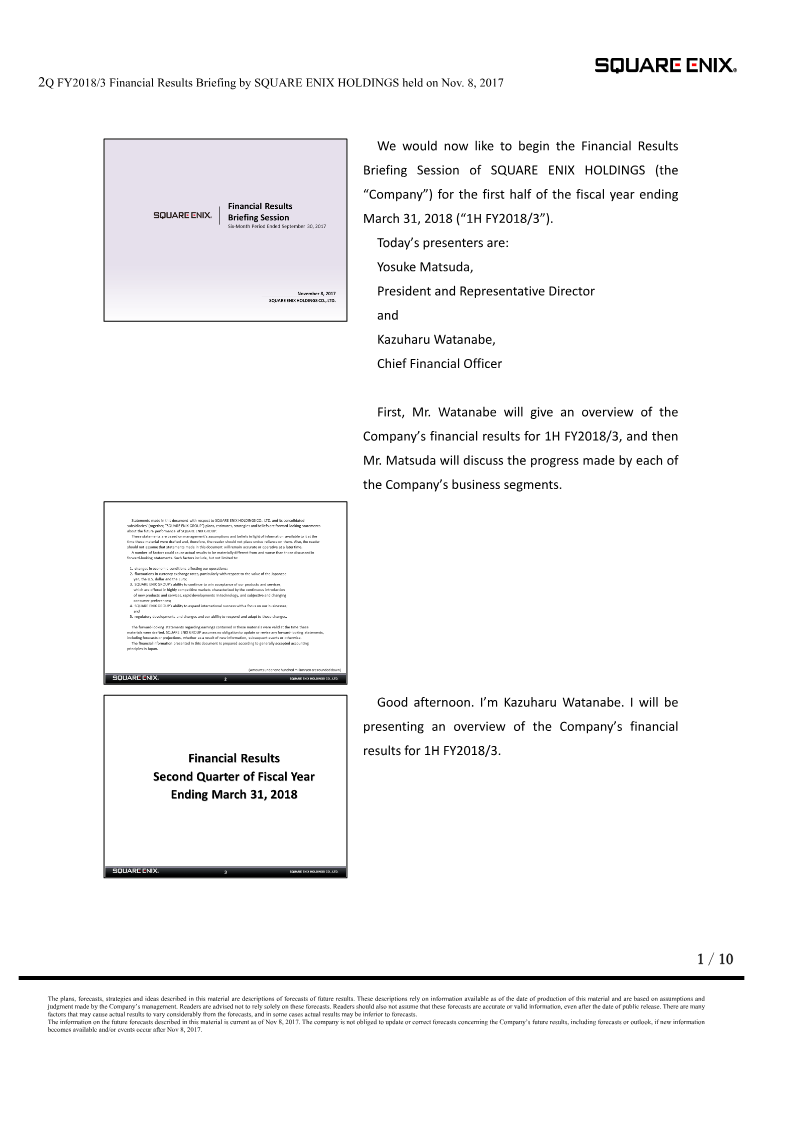
Square Enix Holdings reported strong financial growth for the first half of the fiscal year ending March 31, 2018.
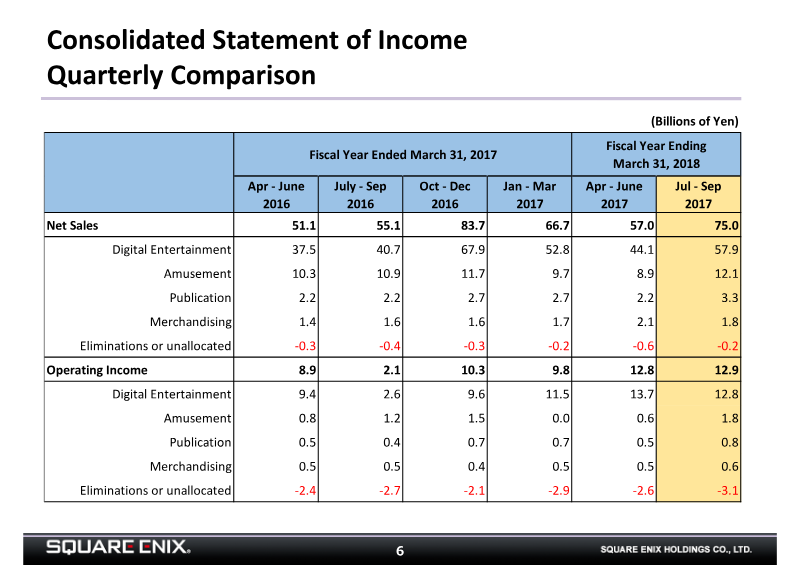
- Square Enix reported strong 1H FY2018/3 financial growth, with net sales reaching ¥132.0 billion (+24.2% YoY) and operating income rising 132.3% to ¥25.8 billion.
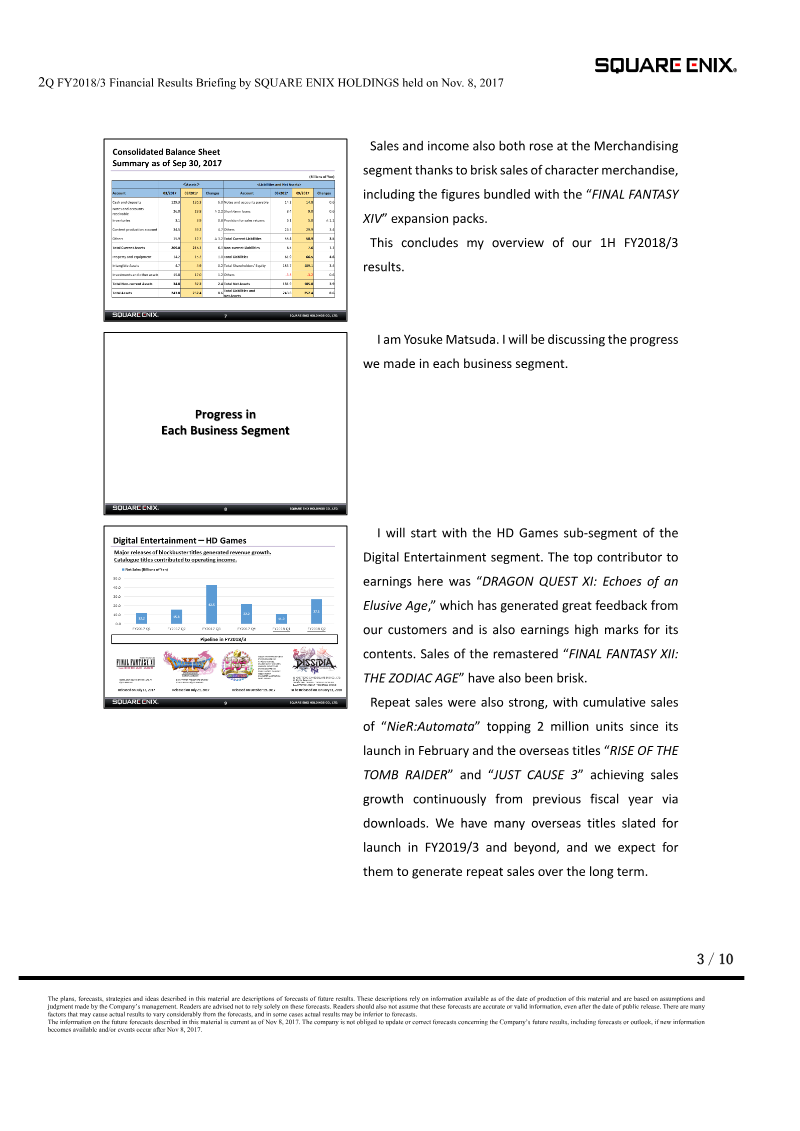
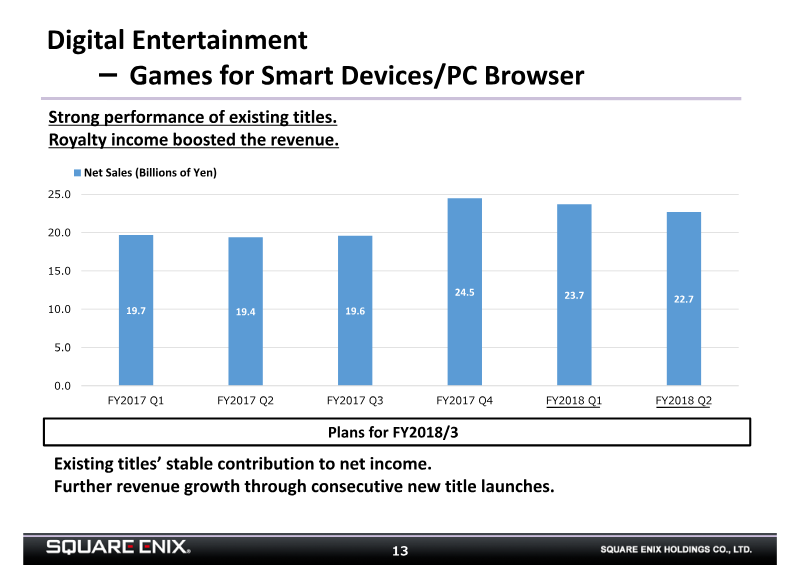
- The Digital Entertainment segment drove performance through the launch of 'DRAGON QUEST XI,' increased paying subscribers for 'FINAL FANTASY XIV,' and strong catalog title downloads.
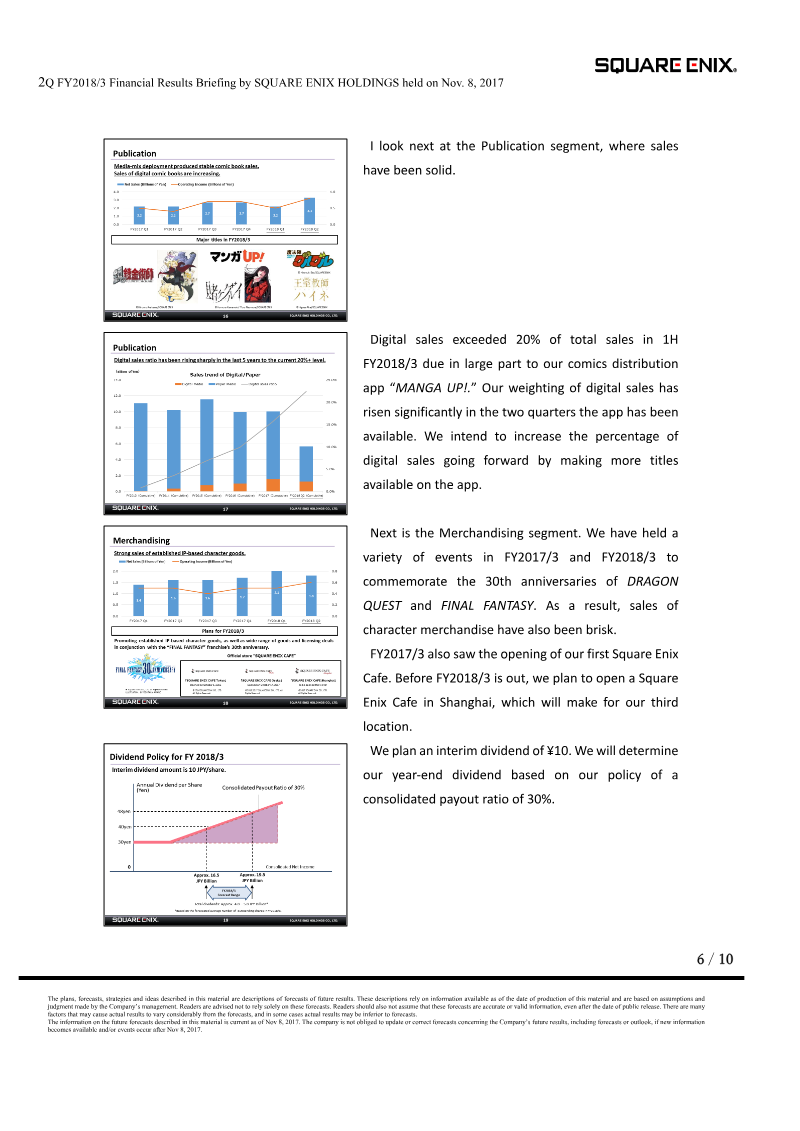
- Digital sales in the Publication segment exceeded 20% of total revenue in 1H FY2018/3, largely attributed to the success of the 'MANGA UP!' distribution app.

Square Enix Holdings Financial Results: Six-Month Period Ended September 30, 2017
Square Enix Holdings reported strong financial growth for the six-month period ending September 30, 2017, characterized by significant increases in both net sales and operating income compared to the same period in the previous fiscal year.
- Square Enix reported strong growth for the six-month period ending September 30, 2017, with net sales rising to 132.0 billion yen, a 25.7 billion yen increase over the same period in 2016.
- Operating income surged to 25.8 billion yen, more than doubling the 11.1 billion yen recorded in the prior year's first half, driven primarily by blockbuster HD game releases.
- The Digital Entertainment segment remains the primary revenue driver, contributing 102.1 billion yen in net sales and achieving an operating income margin of 26.0%.


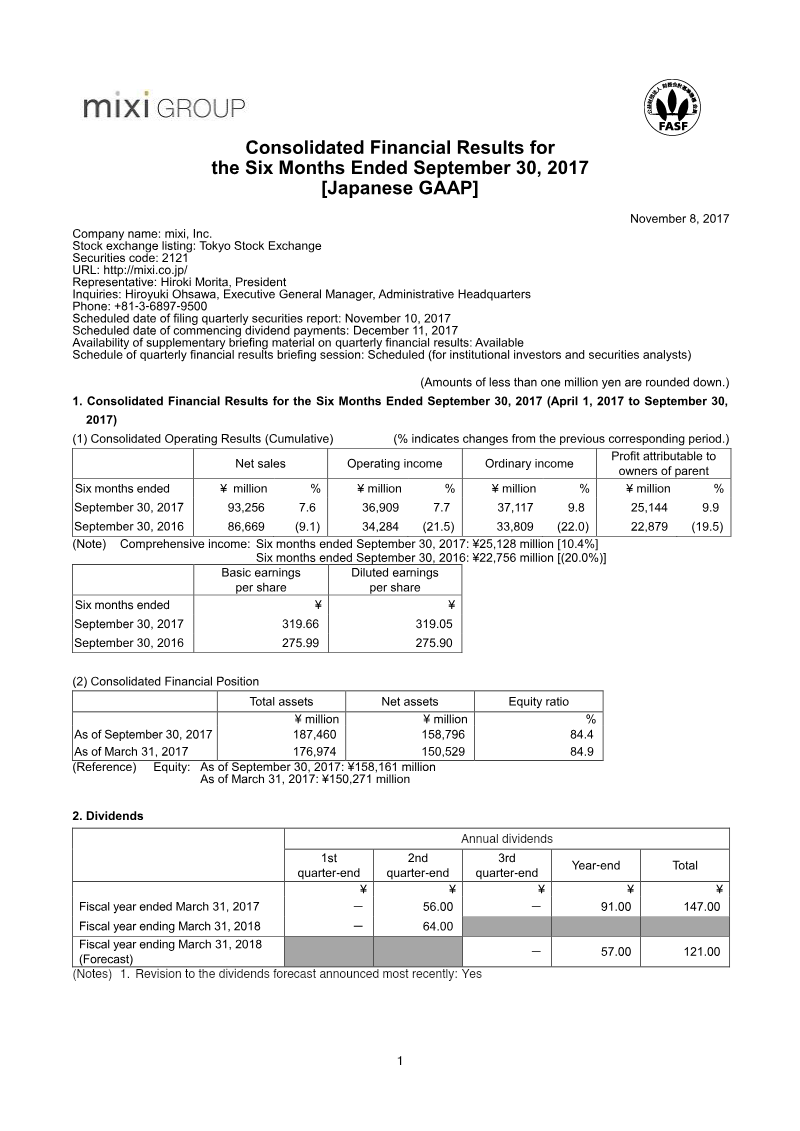
Consolidated Financial Results for the Six Months Ended September 30, 2017
Mixi, Inc. reported consolidated financial results for the first half of the fiscal year ending March 31, 2018, covering the period from April 1, 2017, to September 30, 2017.
- Mixi, Inc. reported strong H1 growth for the fiscal year ending March 31, 2018, with net sales rising 7.6% to ¥93,256 million and operating income increasing 7.7% to ¥36,909 million.
- The Entertainment Business segment remains the primary driver of performance, generating ¥86,252 million in external sales and ¥39,087 million in segment profit.
- Despite positive mid-year results, the company projects a conservative full-year outlook with anticipated declines in annual net sales of 3.5% and operating income of 21.4%.
