Quest
Company
Documents about Quest
State of the Game Industry 2020
The global game development landscape in 2020 is characterized by a transition toward next-generation hardware and a diversifying array of digital storefronts.
- The industry is experiencing a significant shift in revenue expectations, as most developers reject the standard 30% platform fee in favor of a 10-15% revenue split.
- Workforce demographics remain stagnant, with 75% of professionals identifying as male and nearly 50% of studios lacking formal diversity or accessibility initiatives.
- Labor concerns persist as workweeks exceeding 40 hours remain common, and while a majority of developers support unionization, there is widespread skepticism regarding its near-term feasibility.

Epic Games & The Quest to Push Boundaries
Epic Games has evolved through several distinct iterations since its founding in 1991, consistently leveraging the intersection of gaming and technology to maintain a competitive advantage.
- Epic Games operates as an iterative entity that leverages its internal successes, such as Fortnite, to build foundational infrastructure like the Unreal Engine that serves both the company and the broader developer ecosystem.
- Fortnite’s success was driven by a combination of social connectivity, cross-game avatar persistence, the Battle Pass monetization model, and high-profile live events featuring partners like Marshmello and Star Wars.
- The Epic Games Store (EGS) aims to challenge industry gatekeepers by offering a competitive 12% revenue cut to developers, attempting to disrupt the market dominance of platforms like Steam.
Pokémon GO Has Best Year Ever in 2019
Pokémon GO achieved its most successful year since its 2016 launch, generating an estimated $894 million in gross player spending throughout 2019.
- Pokémon GO achieved its highest annual revenue since its 2016 launch, generating $894 million in gross player spending during 2019.
- The game ranked as the fifth highest-earning mobile game globally in 2019, trailing only behind titles like Candy Crush Saga and Honor of Kings.
- Revenue growth in 2019 was driven by consistent live operations and in-game events, specifically the introduction of Team Rocket in July, which led to $116 million and $126 million in revenue for August and September respectively.



2020 Year in Review: Digital Games and Interactive Media
The global digital games and interactive media industry experienced significant growth in 2020, with total revenue rising 12% year-over-year to $126.6 billion.
- The global digital games and interactive media industry grew 12% year-over-year in 2020, reaching $126.6 billion in total revenue.
- Free-to-play titles dominated the market, accounting for 78% of total digital revenue, primarily driven by mobile gaming in Asian markets.
- Premium game sales experienced the fastest growth at 28%, bolstered by high-profile releases such as Animal Crossing: New Horizons and Call of Duty: Modern Warfare.
Square Enix Holdings 2Q FY2020/3 Financial Results Briefing
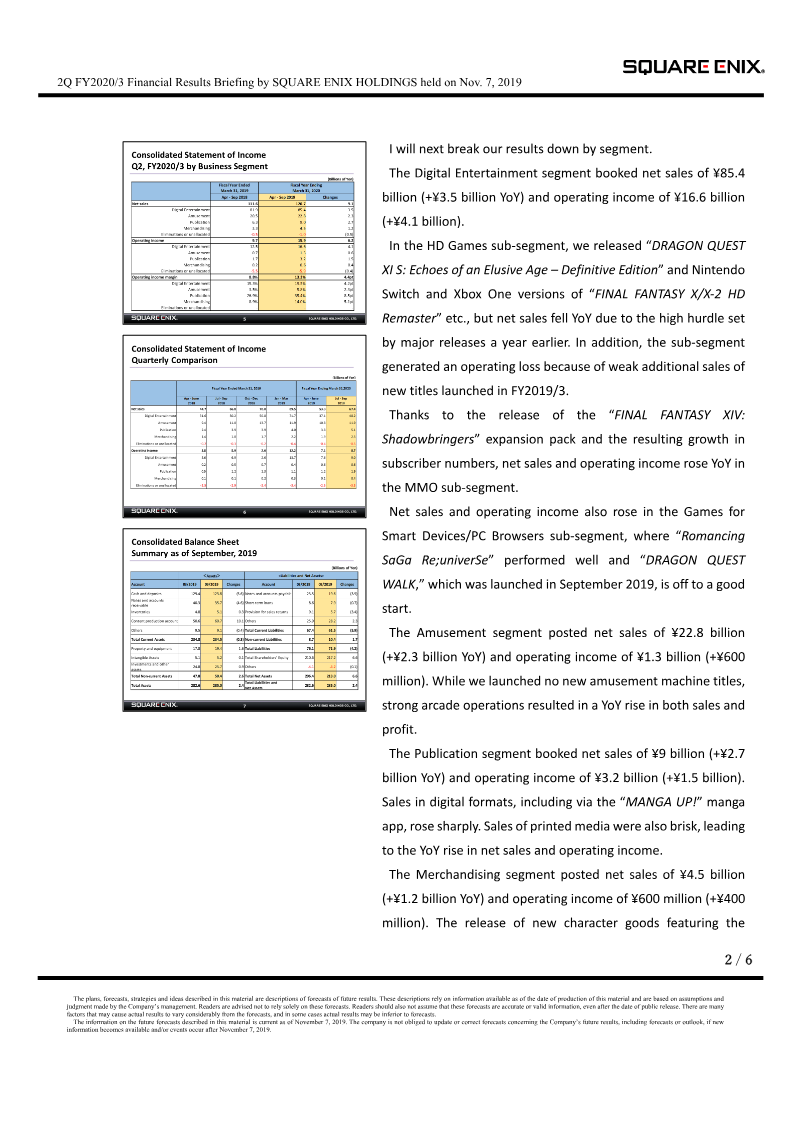
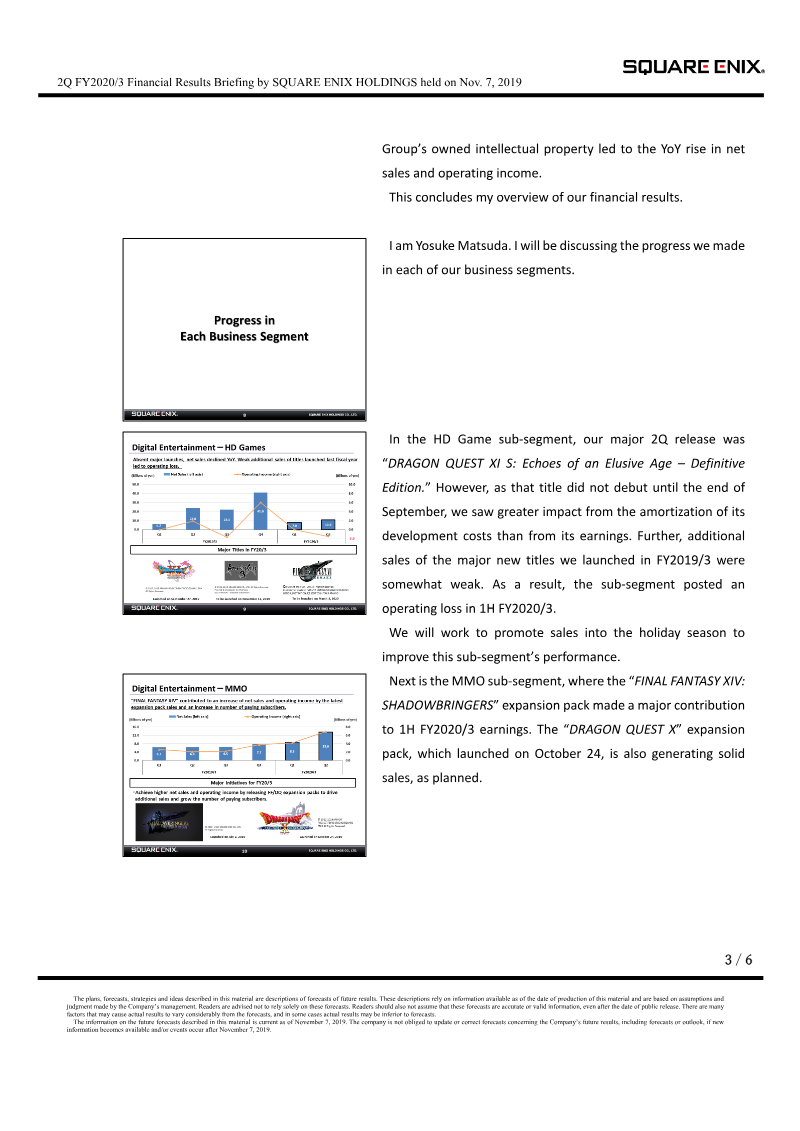
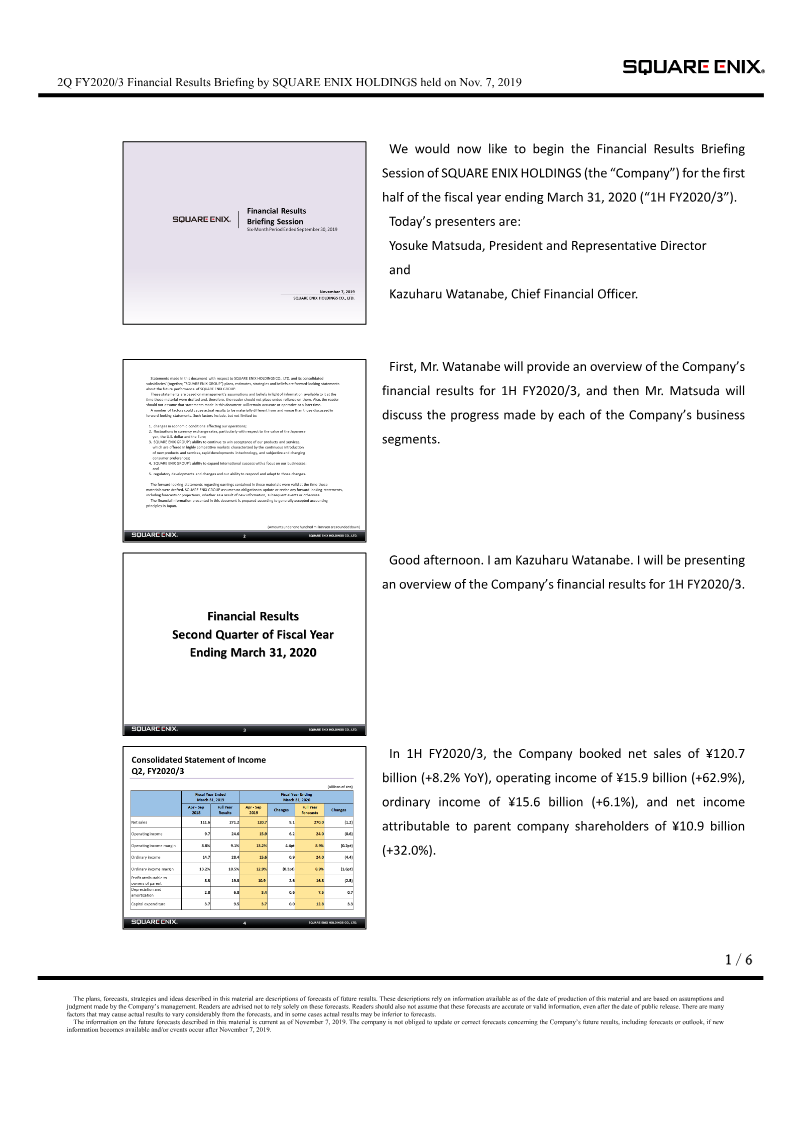
Square Enix Holdings reported positive financial growth for the first half of the fiscal year ending March 31, 2020.
- Square Enix reported strong H1 FY2020/3 growth with net sales of ¥120.7 billion (up 8.2% YoY) and operating income of ¥15.9 billion (up 62.9% YoY).
- The Digital Entertainment segment's MMO sub-segment and mobile titles like 'Dragon Quest Walk' and 'Romancing SaGa Re;univerSe' were primary drivers of financial performance.
- The HD Games sub-segment recorded an operating loss due to development cost amortization and a ¥2.35 billion impairment loss on content production.

Financial Results Briefing Session: Six-Month Period Ended September 30, 2019
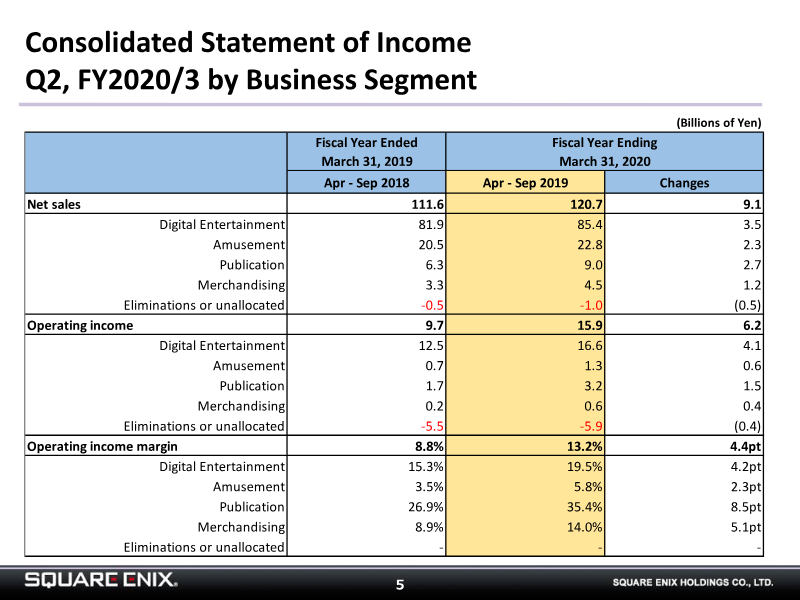
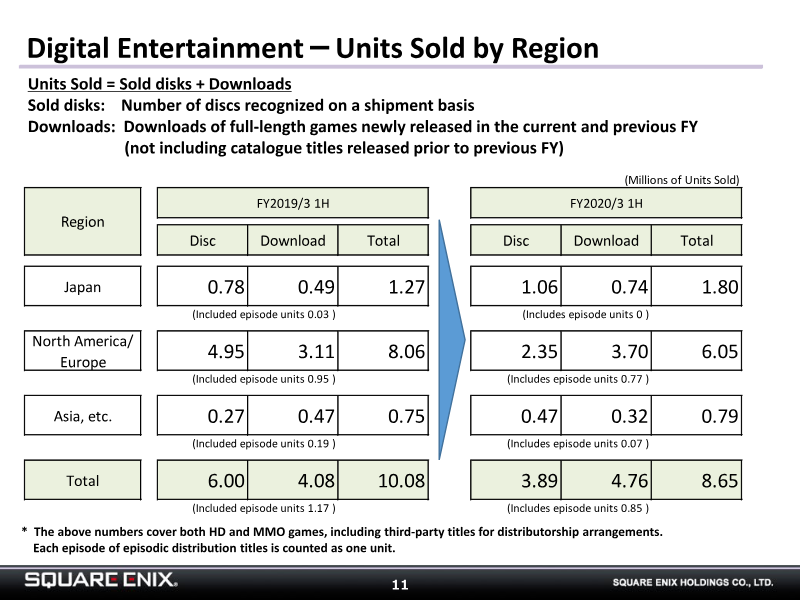
Square Enix Holdings Co., Ltd. reported its financial results for the six-month period ending September 30, 2019, reflecting a period of growth driven by strong performance in its digital entertainment and publication segments.
- Square Enix reported a strong first half for the fiscal year ending March 31, 2020, with net sales reaching 120.7 billion yen and operating income rising to 15.9 billion yen, a significant increase from 9.7 billion yen in the same period the previous year.
- The Digital Entertainment segment's MMO business saw growth in both net sales and operating income, driven by the release of the 'Final Fantasy XIV: Shadowbringers' expansion pack and an increase in paying subscribers.
- Games for smart devices and PC browsers performed well, with net sales and operating income rising due to the continued success of 'Romancing SaGa Re;univerSe' and the September 2019 launch of 'Dragon Quest Walk'.
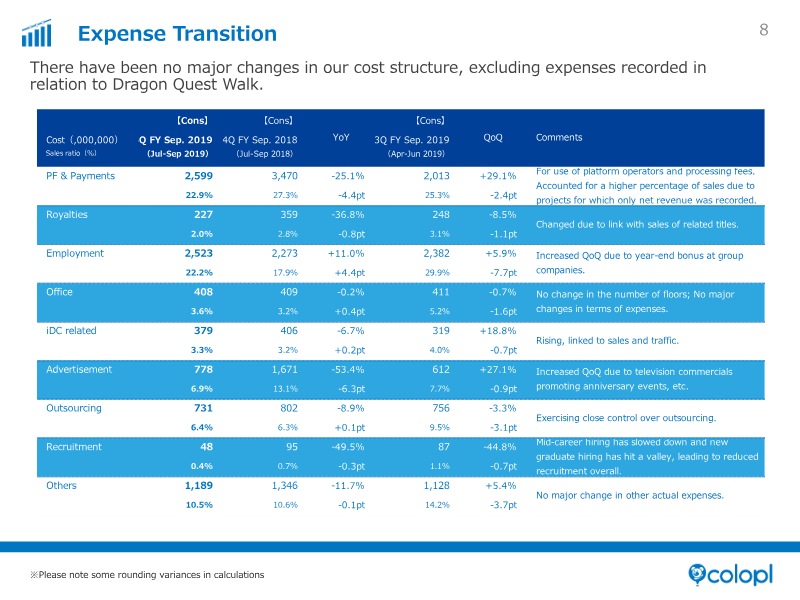
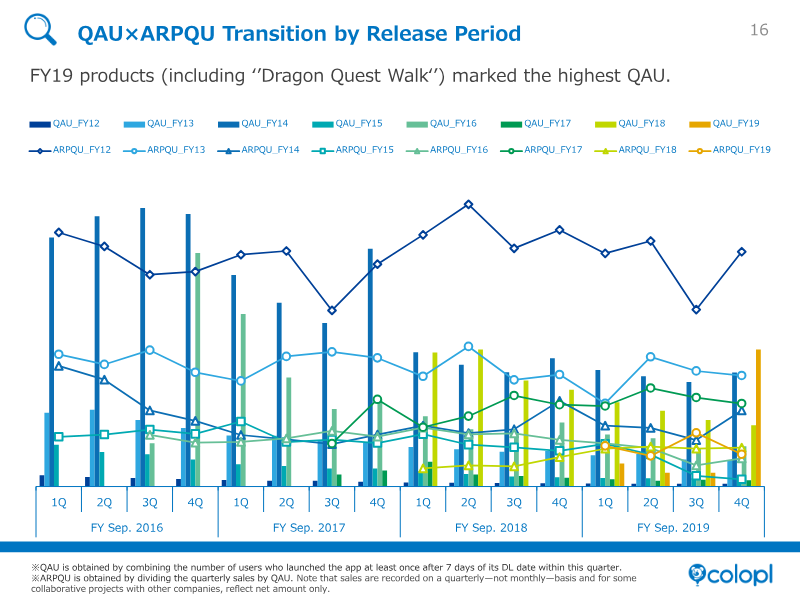

COLOPL 4Q FY September 2019 Financial Results
The financial results for the fourth quarter of the fiscal year ending September 2019 highlight a period of significant growth driven by the successful launch of Dragon Quest Walk.
- COLOPL achieved ¥11.3 billion in Q4 sales, a 42.5% increase over the previous quarter, driven primarily by the launch of Dragon Quest Walk.
- Operating profit rebounded to ¥2.4 billion in Q4 from a break-even point in the third quarter, contributing to a full-year operating profit of ¥2.9 billion on ¥38.9 billion in total sales.
- Quarterly Active Users (QAU) grew by 48.1% to reach 8 million, supported by anniversary events for White Cat Project and White Cat Tennis.
COLOPL 4Q FY2019 Operating Results Briefing: Question and Answer Summary
The fiscal year 2019 operating results briefing for Colopl highlights the strategic success of the location-based mobile game Dragon Quest Walk and outlines the company’s future development trajectory.
- Dragon Quest Walk has become the primary driver of Colopl's strategic success, validating the company's focus on location-based mechanics and real-world exploration.
- Colopl plans to leverage its technical proficiency in location-based development to adapt various intellectual properties into similar exploration-based gaming experiences.
- Existing game titles are expected to see a revenue decline in 1Q FY2020 due to a lack of anniversary events, shifting the company's earnings reliance toward Dragon Quest Walk.
Top Mobile Games by Worldwide Revenue: September 2019
This analysis details the top-performing mobile games by worldwide gross revenue for September 2019, utilizing data from the Store Intelligence platform.
- PUBG Mobile was the top-earning mobile game globally in September 2019, generating over $158.5 million in revenue, a 7.6x increase compared to September 2018.
- Pokémon GO secured the second-highest worldwide revenue at approximately $116 million, marking a 33% year-over-year growth.
- Square Enix’s Dragon Quest Walk, released exclusively in Japan on September 11, 2019, debuted in ninth place with $59.2 million in revenue from 1.5 million downloads.
Pokémon Masters Catches $33 Million Globally in Its First Month
Pokémon Masters achieved significant commercial success during its initial month of availability, generating $33.3 million in global player spending following its August 29, 2019, release.
- Pokémon Masters generated $33.3 million in global player spending during its first month following its August 29, 2019, release.
- While the title achieved the second-highest grossing launch month for a Pokémon mobile game, it earned significantly less than Pokémon GO, which grossed $302 million in its first month.
- The game significantly outperformed recent franchise releases, earning roughly 4.4 times more than Pokémon Quest ($7.6 million) and 44 times more than Pokémon Rumble Rush ($760,000) in their respective first months.
Pokémon Masters Revenue Surpasses $25 Million in Its First Week
Pokémon Masters achieved a strong commercial debut, generating an estimated $26 million in gross revenue during its first week of availability in September 2019.
- Pokémon Masters grossed approximately $26 million in its first week of release, marking the second-best mobile launch in the franchise's history.
- Japan was the primary market for the game's launch, accounting for $16 million or 62% of total first-week revenue.
- The title significantly outperformed other recent franchise entries, such as Pokémon Quest ($3 million), Pokémon: Magikarp Jump ($1 million), and Pokémon Rumble Rush ($300,000).
Nightmare Reaper: Doing a 1.0 Steam Release the Right Way
The transition from Early Access to a 1.0 full release on Steam represents a critical inflection point for indie developers.
- A successful 1.0 launch can drive massive momentum, as evidenced by Nightmare Reaper selling 10,400 units in six days—50% of its total volume accumulated over three years of Early Access.
- Strategic marketing for the 1.0 release, including a 70-streamer Twitch event and high-reach YouTube coverage, helped nearly double the game's wishlist from 39,000 to 75,000.
- Maintaining an 'Overwhelmingly Positive' review status throughout the development cycle is essential for securing long-term discoverability and consumer trust.