2015
Company
Documents about 2015
Nippon Ichi Software Q2 FY2015 Financial Results
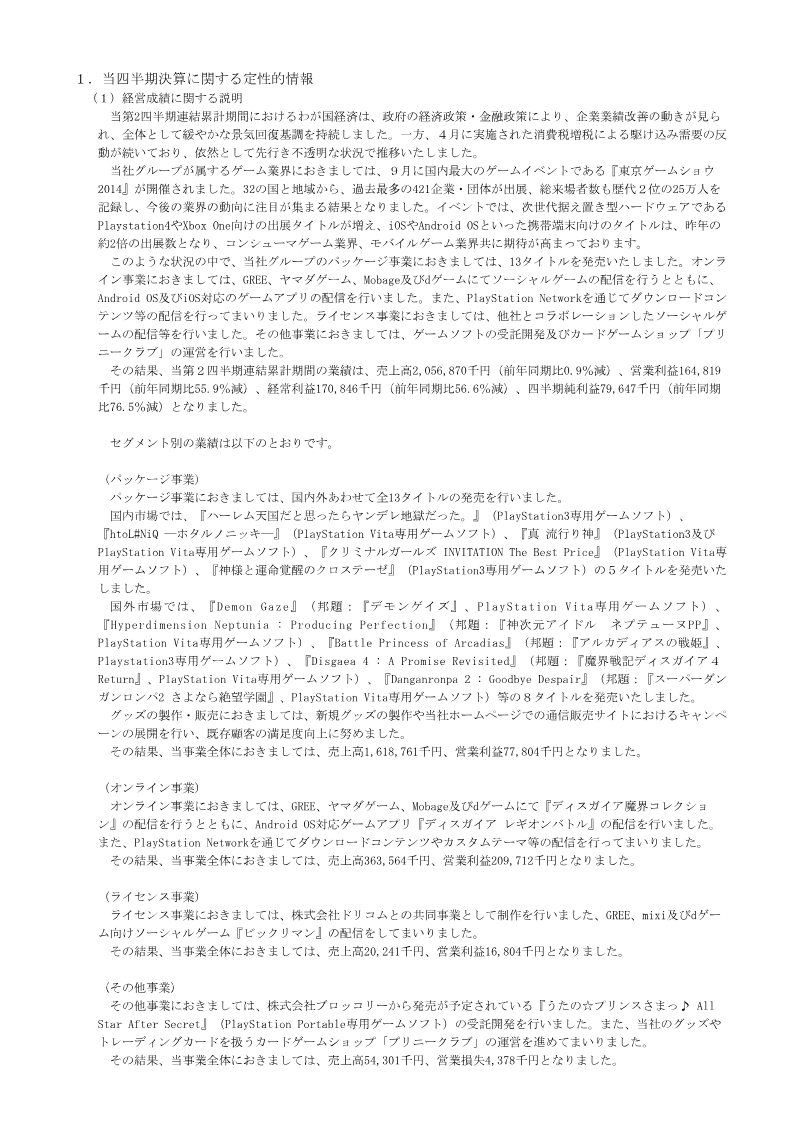
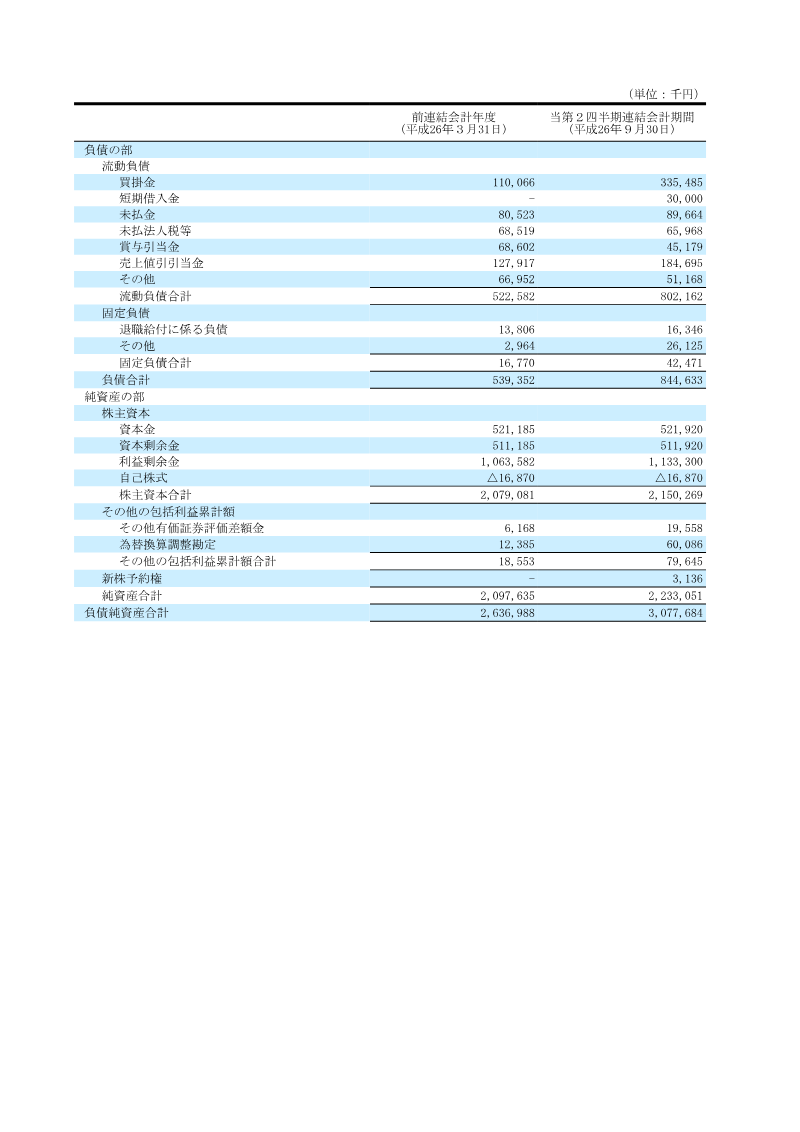
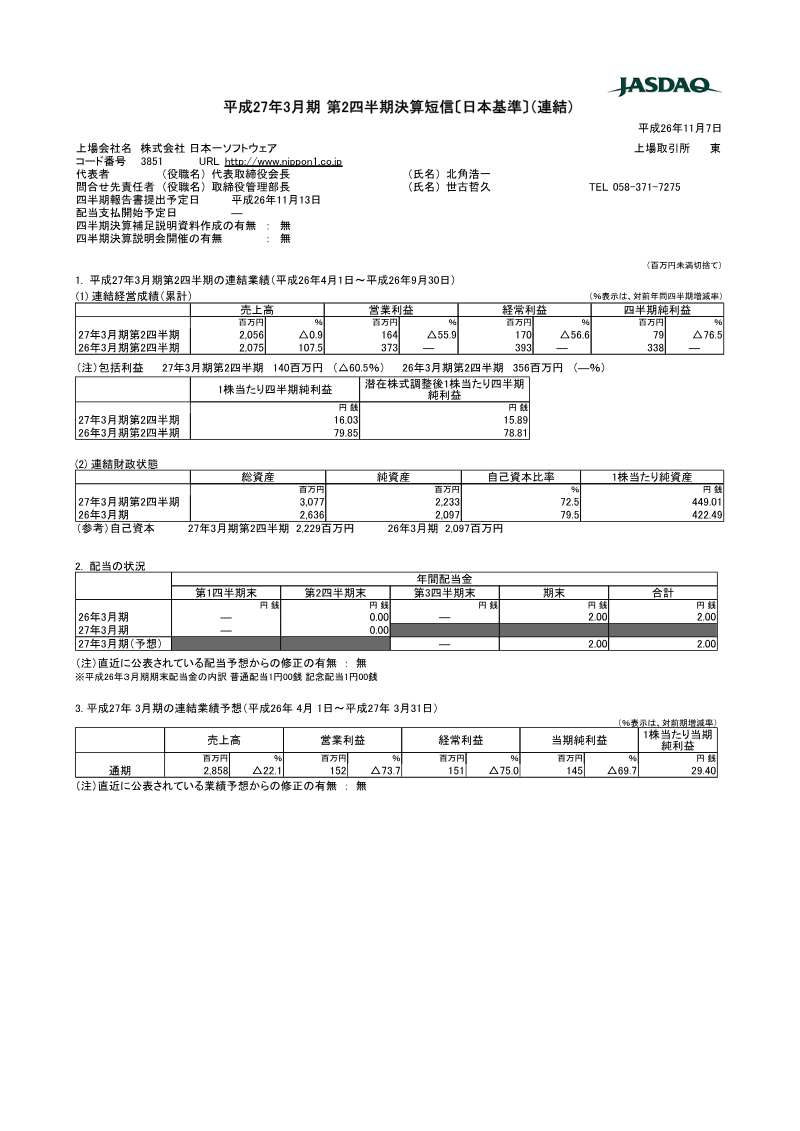
The Nippon Ichi Software financial results for the second quarter of the fiscal year ending March 2015 detail a period of significant earnings contraction.
- Nippon Ichi Software experienced a sharp decline in profitability for the six-month period ending September 30, 2014, with operating profit falling 55.9% to 164 million yen and net profit dropping 76.5% to 79 million yen.
- Consolidated net sales remained relatively stable at 2,056 million yen, representing only a marginal 0.9% decrease compared to the same period in the previous fiscal year.
- The package software segment, which released 13 titles, generated 1,618 million yen in sales but yielded a lower operating profit of 77 million yen compared to the online segment.

Bandai Namco Holdings FY2015.3 2nd Quarter Results Presentation
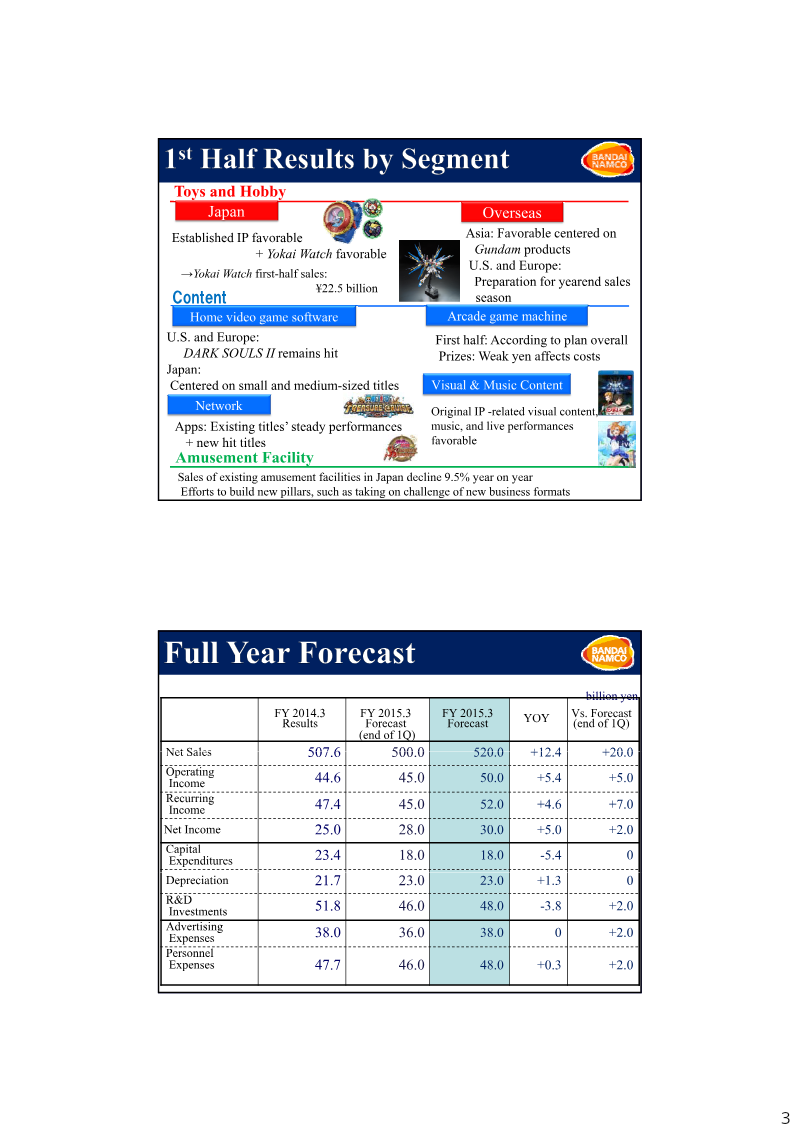
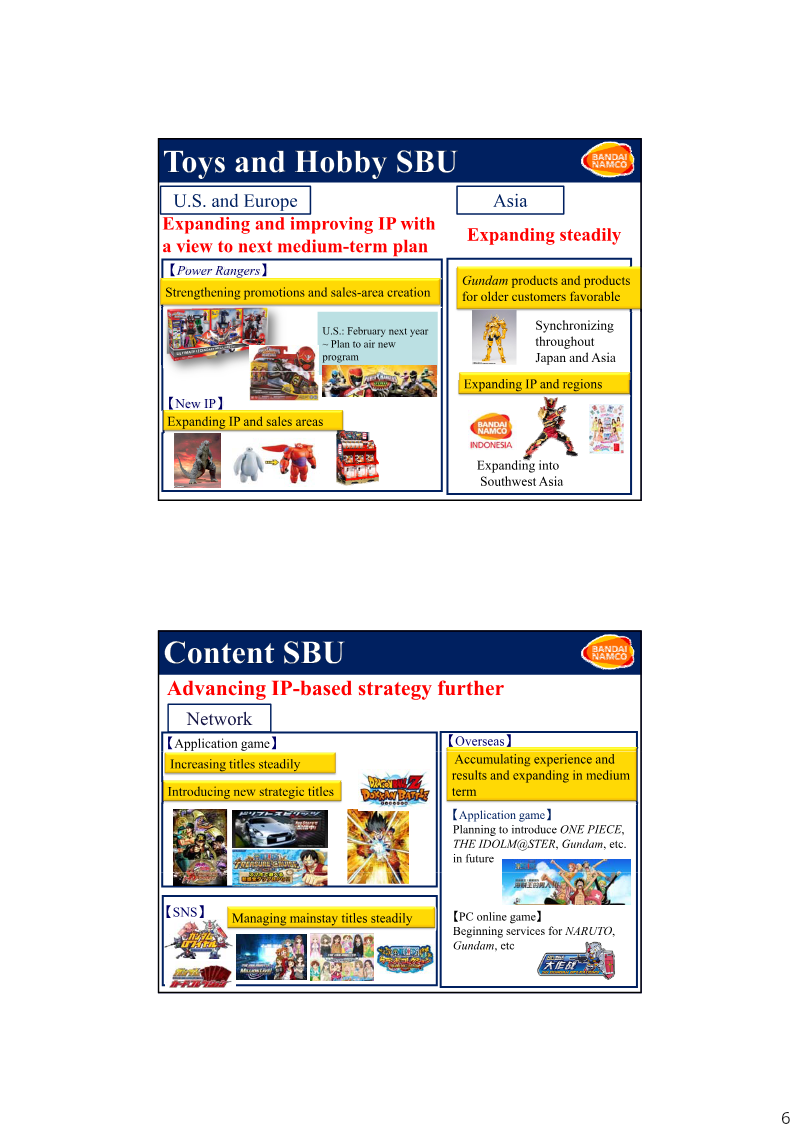
The Bandai Namco Holdings fiscal year 2015 second-quarter results presentation outlines the company’s financial performance for the first half of the fiscal year ending March 2015 and provides updated full-year forecasts.
- Bandai Namco raised its full-year fiscal 2015 projections to 520 billion yen in sales and 50 billion yen in operating income following a strong first-half performance.
- First-half net sales reached 259.3 billion yen with an operating income of 31.8 billion yen, both exceeding initial company forecasts.
- The Toy and Hobby segment generated 106.3 billion yen in sales, driven primarily by the commercial success of the Yokai Watch and Gundam intellectual properties.

Sega Sammy Holdings FY Ending March 2015: Interim Results Presentation
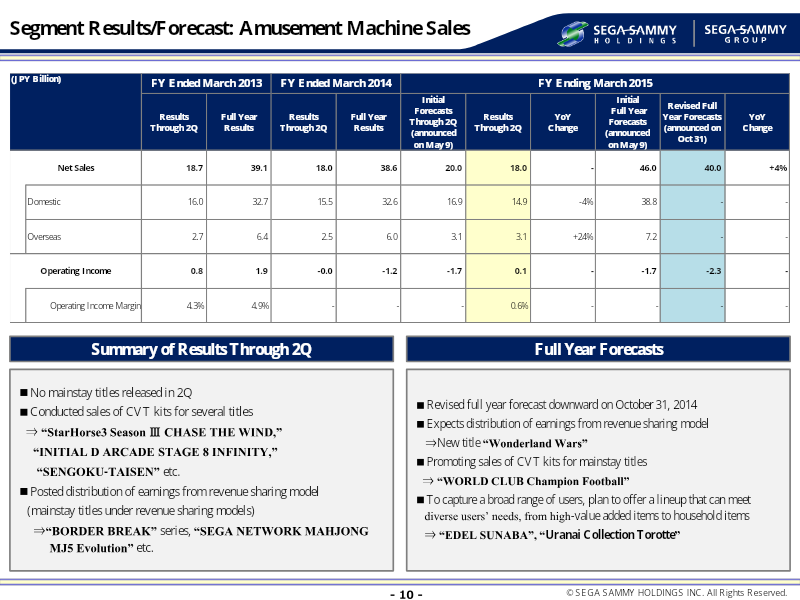
Sega Sammy Holdings experienced a period of significant financial contraction during the first half of the fiscal year ending March 2015, characterized by a 5% decline in net sales and a 72% collapse in operating income.
- Sega Sammy Holdings reported a 5% decline in net sales and a 72% collapse in operating income for the first half of the fiscal year ending March 2015.
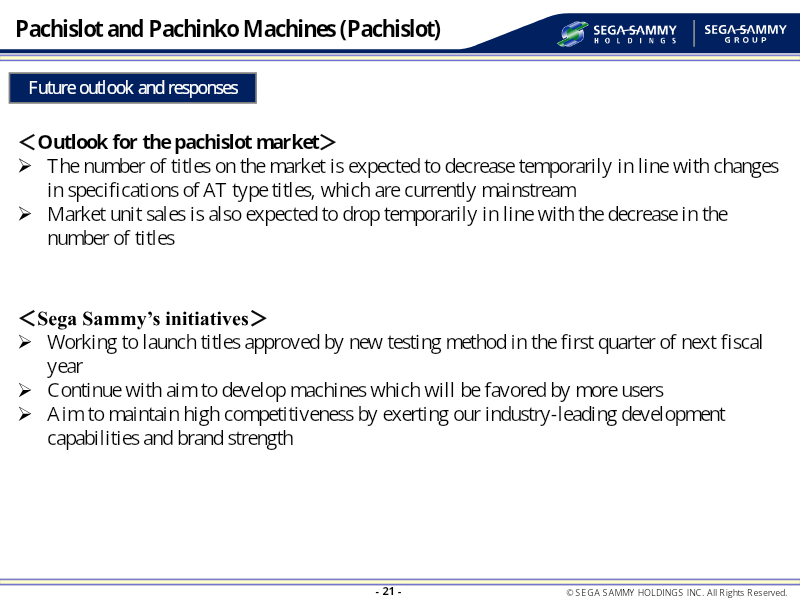
- Regulatory changes in prototype testing forced a reduction in the annual Pachislot and Pachinko launch schedule from 10 to 6 titles, with projected unit sales falling from 374,800 to 222,998.
- The company initiated a structural reform to reorganize operations into three pillars: Pachislot and Pachinko, Entertainment Content, and Resort business.


Consolidated Financial Results for the Six Months Ended September 30, 2014
Mixi, Inc. reported a significant financial turnaround and exponential growth for the six-month period ending September 30, 2014.
- Mixi, Inc. achieved a major financial turnaround for the six months ending September 30, 2014, reporting net sales of ¥34.95 billion, a 778.3% increase year-over-year.
- The company shifted from a ¥1.35 billion net loss in the same period of 2013 to a net income of ¥9.08 billion and an operating income of ¥14.35 billion.
- The Media & Content Business segment served as the primary growth driver, generating ¥31.91 billion in sales and ¥15.15 billion in segment income.



FY 2015 First Quarter Financial Results
GREE’s financial results for the first quarter of fiscal year 2015 reveal a strategic pivot toward native mobile applications amid declining revenues from its legacy web game business.
- GREE reported Q1 FY2015 net sales of ¥25.4 billion, reflecting a decline due to softening performance in legacy web games both domestically and internationally.
- Operating income remained stable at ¥6.4 billion, supported by a 7% reduction in total costs achieved through optimized labor, server expenses, and decreased mass-media advertising.
- The company is aggressively pivoting to native mobile applications, increasing production lines to 12 and expanding its dedicated headcount to approximately 500 employees.
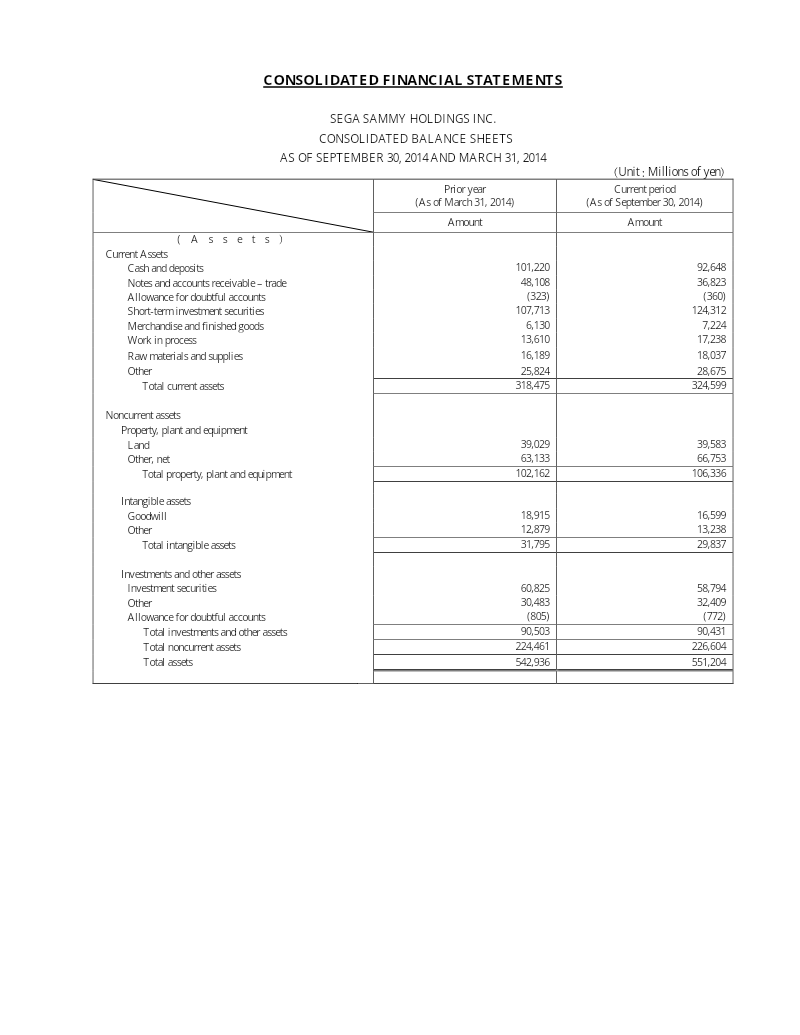
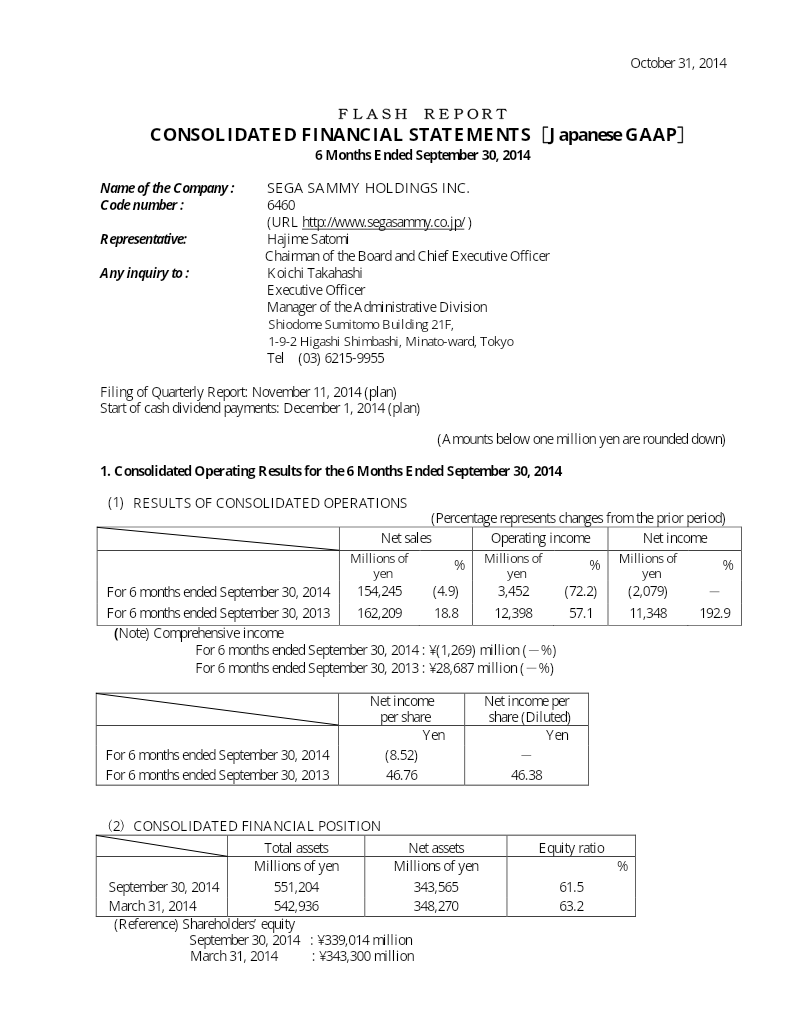
Sega Sammy Holdings Consolidated Financial Statements: 6 Months Ended September 30, 2014
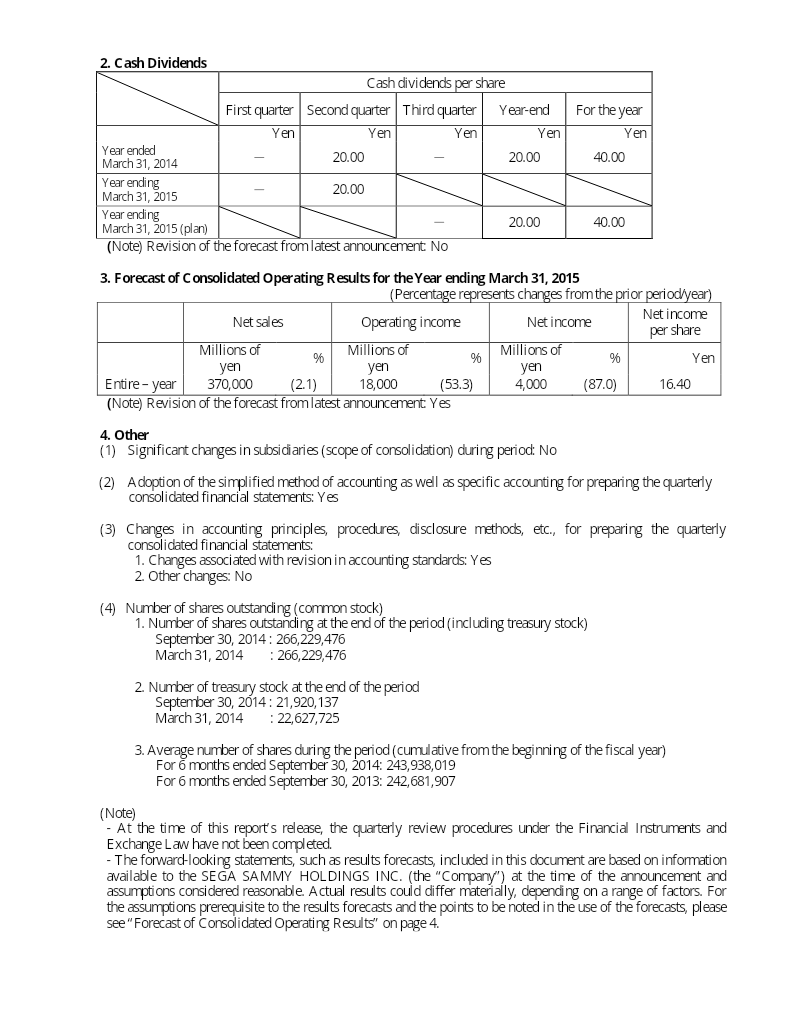
Sega Sammy Holdings experienced a challenging financial period for the six months ended September 30, 2014, characterized by declining revenues and a shift to a net loss.
- Sega Sammy Holdings reported a net loss of 2,079 million yen for the six months ended September 30, 2014, a significant reversal from the 11,348 million yen net income recorded in the same period the previous year.
- Operating income plummeted 72.2% to 3,452 million yen, largely due to a 2,778 million yen provision for dismantling fixed assets at the Phoenix Seagaia Resort.
- The Pachislot and Pachinko segment, a core revenue driver, saw net sales decline by 14.9% to 60,727 million yen, with operating income dropping 51.3% as pachislot sales underperformed.
Take-Two Interactive Form 10-Q: Q2 Fiscal Year 2015
Take-Two Interactive’s financial position for the second quarter of fiscal year 2015 reflects a strategic transition toward digital distribution and recurrent consumer spending, even as the company navigates the cyclical nature of major title releases.
- The Grand Theft Auto franchise is a critical revenue driver, accounting for approximately 40% of Take-Two's total net revenue for the six months ended September 30, 2014.
- Digital online channels accounted for 63.9% of total net revenue for the six months ended September 30, 2014, up from 55.7% in the same period the previous year.
- Recurrent consumer spending, including microtransactions, add-on content, and online play, represented 47.9% of net revenue from digital online channels during the first half of fiscal year 2015.
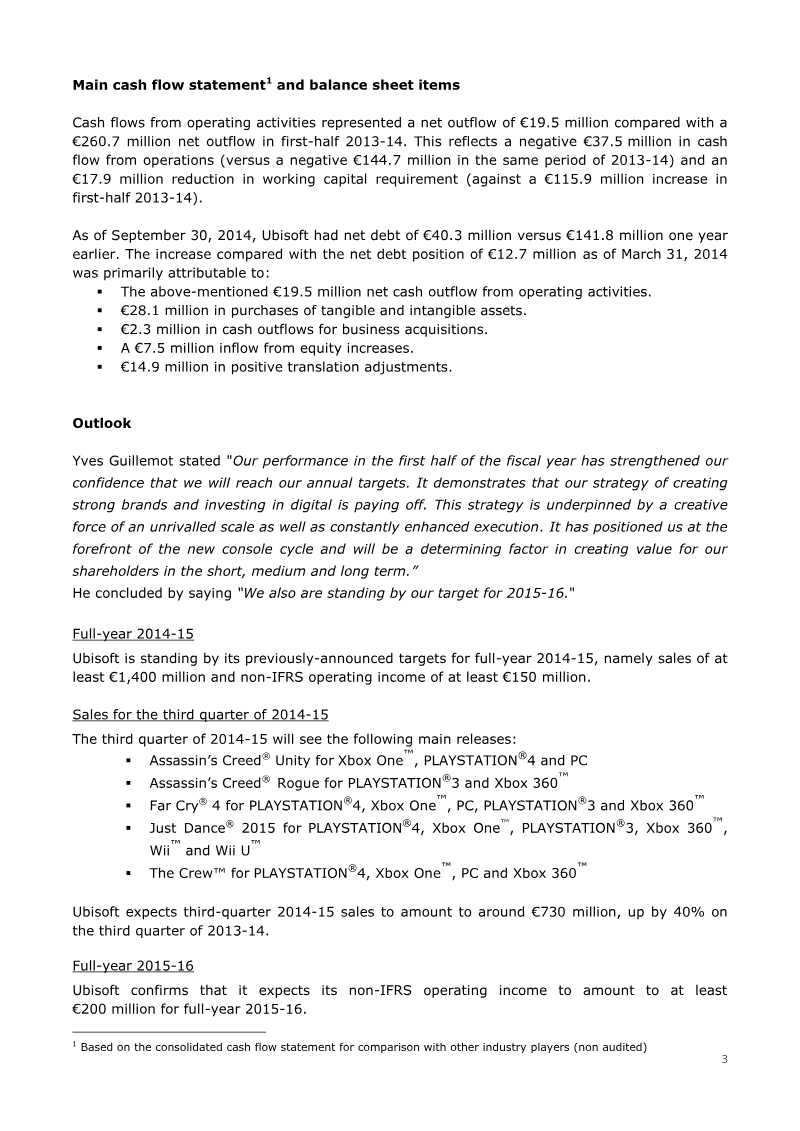
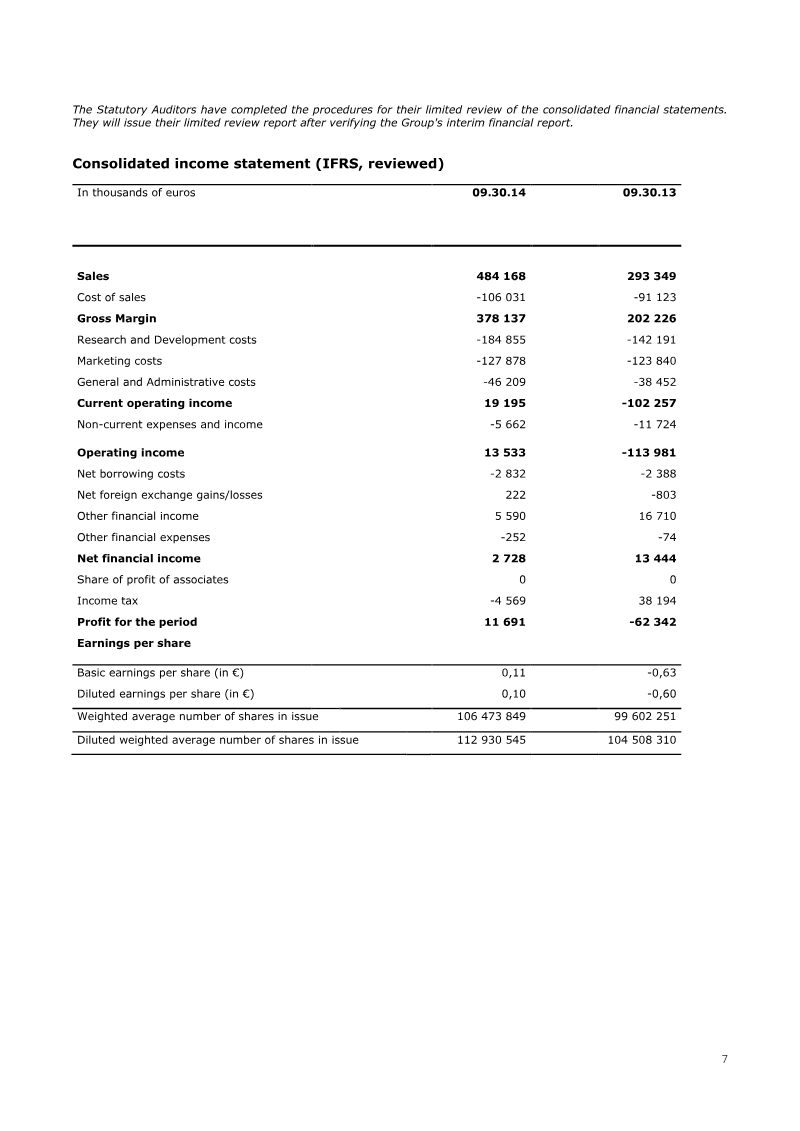
Ubisoft Reports First-Half 2014-15 Sales and Earnings Figures
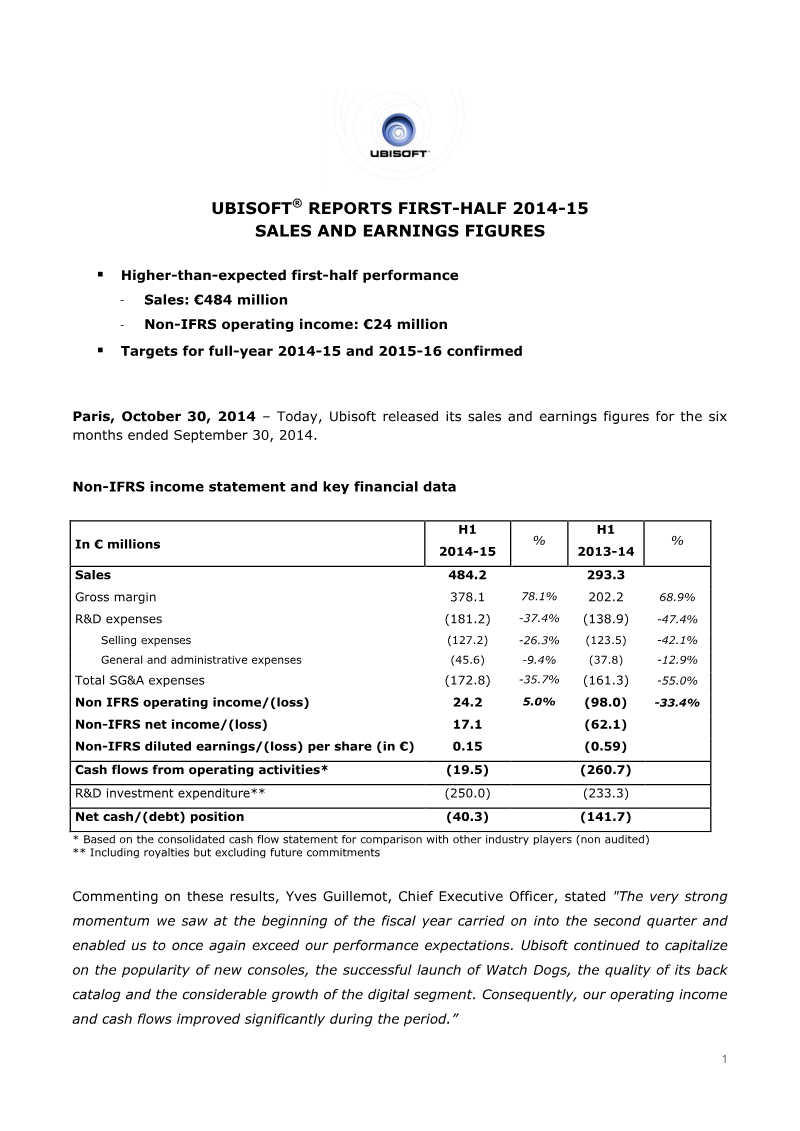
Ubisoft’s financial results for the first half of the 2014-15 fiscal year demonstrate a significant recovery and strong operational momentum compared to the same period in the previous year.
- Ubisoft reported H1 2014-15 sales of €484.2 million, a 65.1% increase over the €293.3 million recorded in the same period of the previous fiscal year.
- The company achieved a non-IFRS operating income of €24.2 million, a significant turnaround from the €98.0 million operating loss reported in H1 2013-14.
- Digital segment revenue surged by 90.4%, accounting for 27.8% of total sales, largely driven by the launch of Watch Dogs, which sold over 9 million units.


Capcom Financial Highlights: First Half of Fiscal Year Ending March 31, 2015
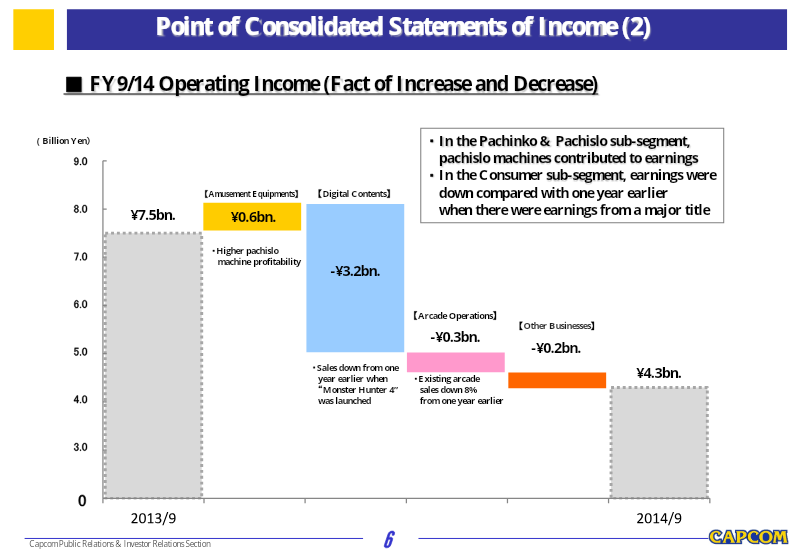
Capcom’s financial performance for the first half of the fiscal year ending March 31, 2015, reflects a period of contraction compared to the same period in the previous year.
- Capcom experienced a significant financial contraction in the first half of fiscal year 2015, with net sales dropping to 25.9 billion yen from 53.2 billion yen and operating income falling to 4.3 billion yen from 7.5 billion yen.
- The revenue decline was primarily driven by the absence of a major hit title comparable to the previous year’s launch of Monster Hunter 4, resulting in a 24 billion yen decrease in digital content sales.
- Despite lower overall revenue, Capcom improved its operating margin by 2.8 percentage points to 16.9% through disciplined cost-cutting measures.

Results of Operations and Strategies: First Half of Fiscal Year Ending March 31, 2015
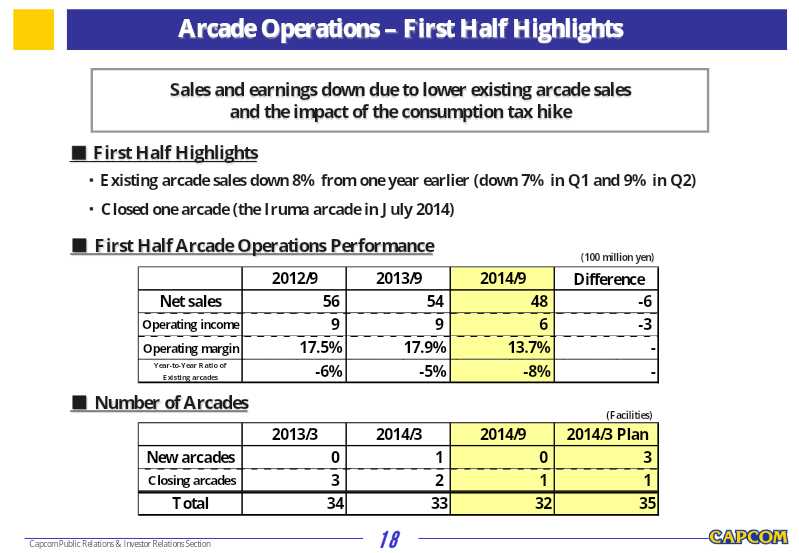
Capcom’s financial results for the first half of the fiscal year ending March 31, 2015, reflect a period of transition characterized by a year-over-year decline in sales and earnings, primarily due to the absence of a major hit title comparable to the previous year’s launch of Monster Hunter 4.
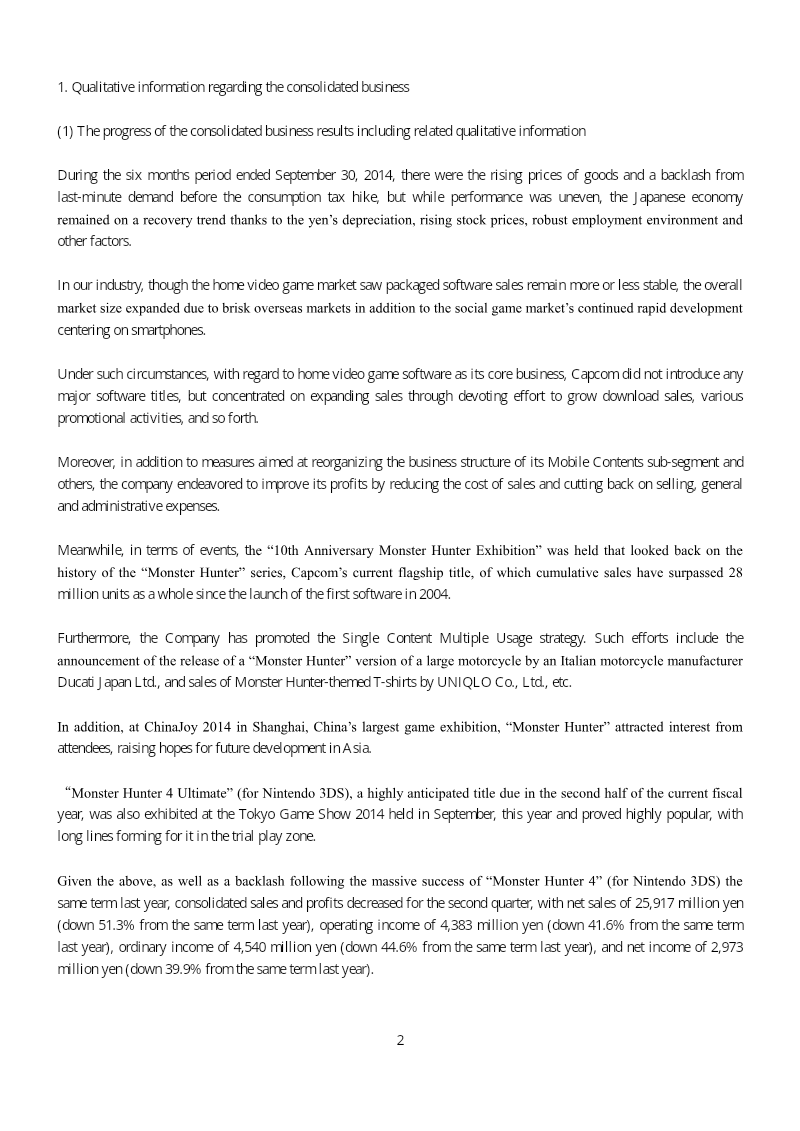
- Capcom reported a significant year-over-year decline in net sales for the first half of fiscal year 2015, dropping to 25,917 million yen from 53,234 million yen due to the absence of a major hit title.
- Operating margins improved to 16.9% despite lower revenue, driven by rigorous cost-cutting measures and a strategic focus on high-margin digital content.
- Digital downloads became a critical revenue stream, accounting for approximately 43% of total consumer segment revenue during the six-month period.
Capcom Consolidated Financial Results: 6 Months of FY2015
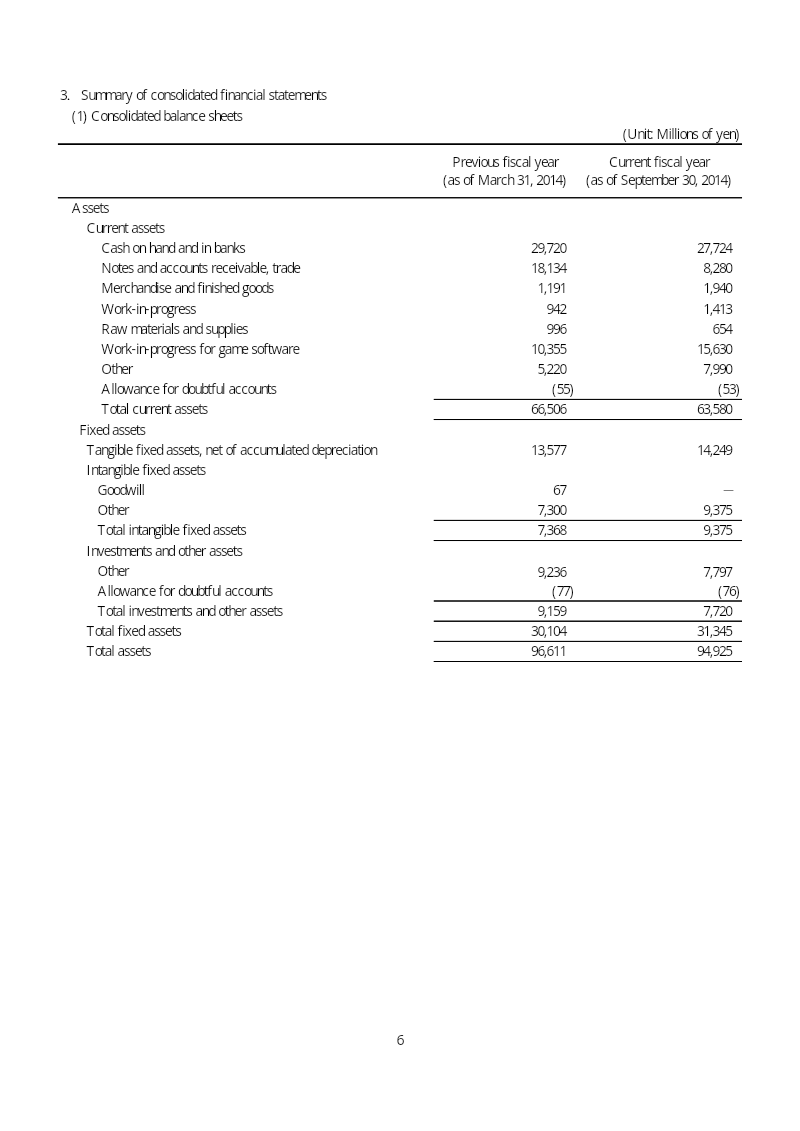
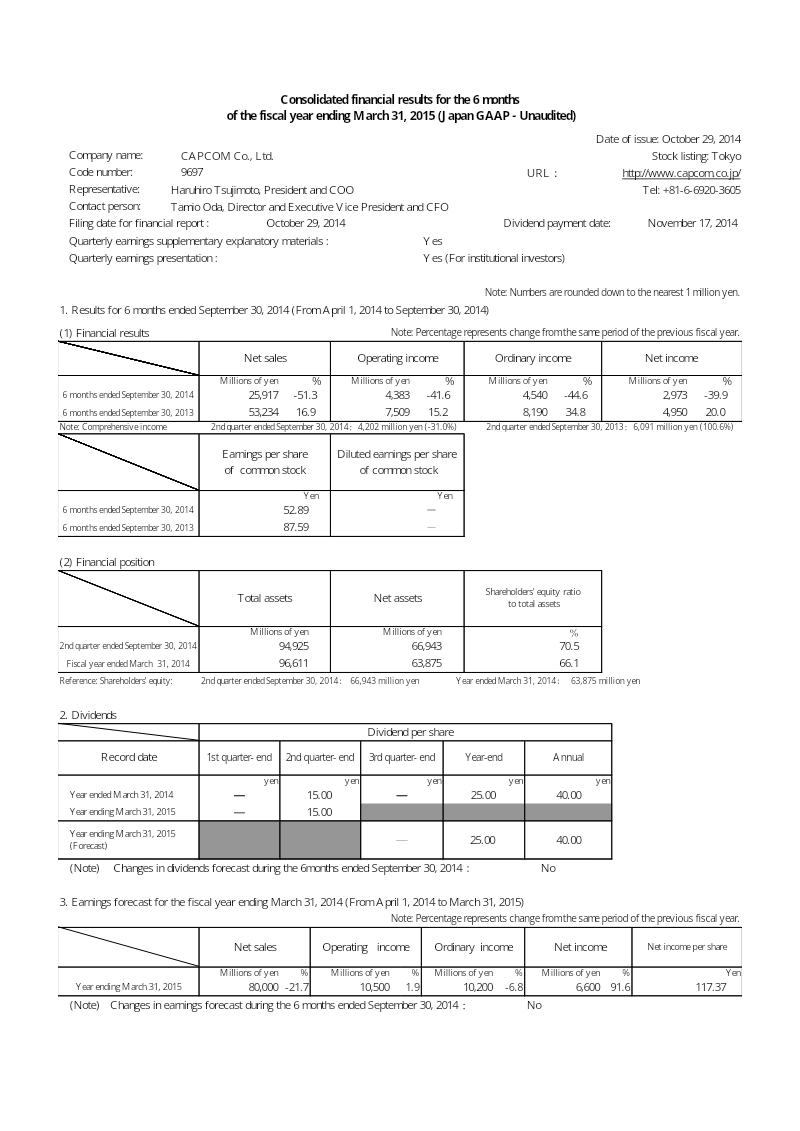
Capcom’s consolidated financial results for the six-month period ending September 30, 2014, reflect a significant year-over-year decline in performance.
- Capcom reported a 51.3% year-over-year decline in net sales to 25,917 million yen for the six-month period ending September 30, 2014.
- Operating income fell by 41.6% to 4,383 million yen and net income dropped by 39.9% to 2,973 million yen, largely due to the absence of major new software releases compared to the prior year's 'Monster Hunter 4' launch.
- The core Digital Contents business segment experienced a 64.1% decrease in net sales, totaling 13,463 million yen.
Microsoft Form 10-Q: Q1 FY2015
Microsoft’s financial performance for the first quarter of fiscal year 2015 reflects a period of aggressive strategic transformation and significant capital investment.
- Commercial revenue grew 10% ($1.1 billion) for the quarter ended September 30, 2014, driven by strong performance in Commercial Cloud, on-premises licensing, and a 13% increase in server products and Microsoft Azure revenue.
- Office Commercial revenue declined 7% ($322 million) as customers transitioned to Office 365 Commercial, while Windows Commercial revenue grew 10% due to increased renewals and customer base expansion.
- Microsoft recorded a $253 million restructuring charge during the quarter related to asset write-downs and facility consolidations, with additional pre-tax charges of $100 million to $600 million expected for the remainder of fiscal year 2015.