2015
Company
Documents about 2015
Take-Two Interactive Form 10-Q: Q1 FY2015
Take-Two Interactive’s financial performance for the first quarter of fiscal year 2015, ending June 30, 2014, reflects a strategic transition toward digital distribution and a continued reliance on core intellectual property.
- Digital online channels accounted for 63.9% of Take-Two's total net revenue for the three months ended June 30, 2014.
- Recurrent consumer spending, driven by add-on content, microtransactions, and online play, represented 45.0% of net revenue from digital online channels for the quarter ended June 30, 2014.
- Gross profit margin increased significantly to 56.8% for the quarter ended June 30, 2014, compared to 34.2% in the prior year, due to lower product costs and the absence of prior-year software impairment charges.

Square Enix Holdings Three-Month Period Ended June 30, 2014: Reference Materials
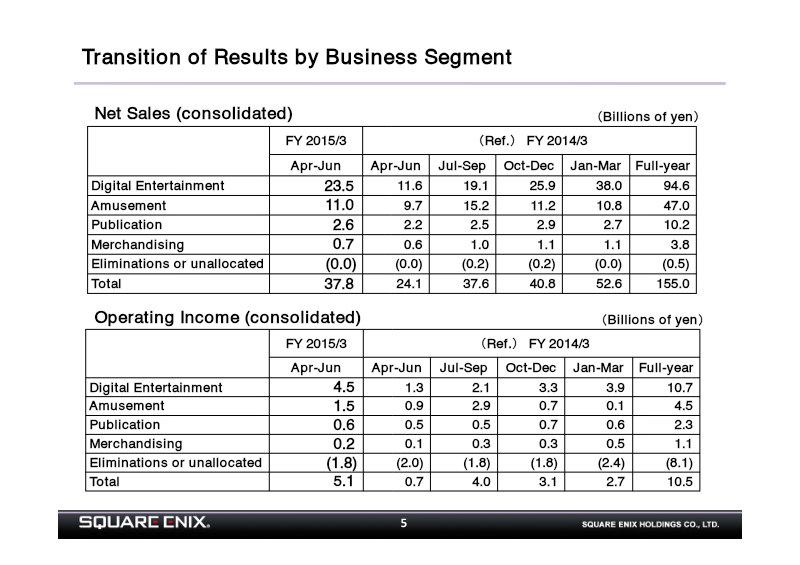
The Square Enix Holdings financial report for the three-month period ending June 30, 2014, details a significant improvement in fiscal performance compared to the same quarter in the previous year.
- Square Enix reported a strong start to the fiscal year ending June 30, 2014, with net sales increasing to 37.8 billion yen from 24.1 billion yen in the same period the previous year.
- Operating income saw a significant surge to 5.1 billion yen for the quarter, compared to 0.7 billion yen in the prior-year period, driven largely by a 19.2% operating margin in the Digital Entertainment segment.
- The Digital Entertainment segment was the primary growth driver, with net sales more than doubling to 23.5 billion yen and operating income rising to 4.5 billion yen from 1.3 billion yen year-over-year.
FY Ending March 2015 1st Quarter Results Presentation: Sega Sammy Holdings
Sega Sammy Holdings experienced a difficult start to the fiscal year ending March 2015, characterized by a 3% decline in net sales and a 42% contraction in operating income compared to the previous year.
- Sega Sammy Holdings reported a 3% decline in net sales and a 42% contraction in operating income for the first quarter of the fiscal year ending March 2015.
- The consumer business segment grew revenue by 12% due to the expansion of digital titles, providing a buffer against declines in other sectors.
- Financial performance was negatively impacted by a significant reduction in Pachislot unit sales and persistent losses in the amusement machine and center segments.
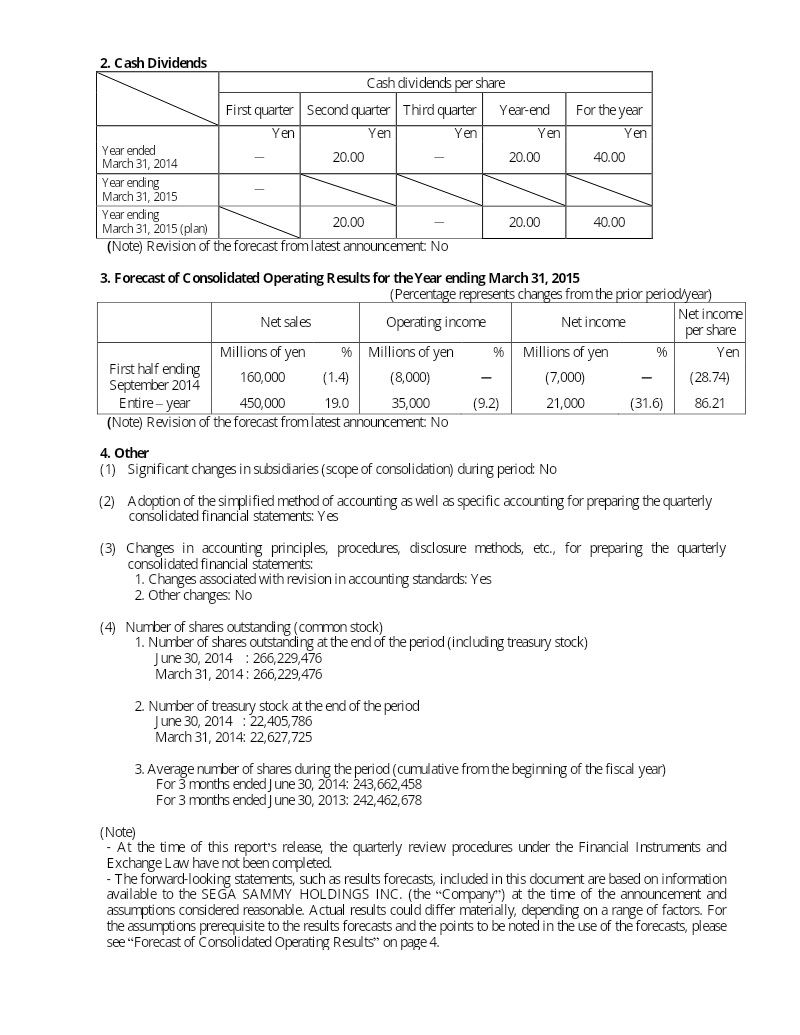
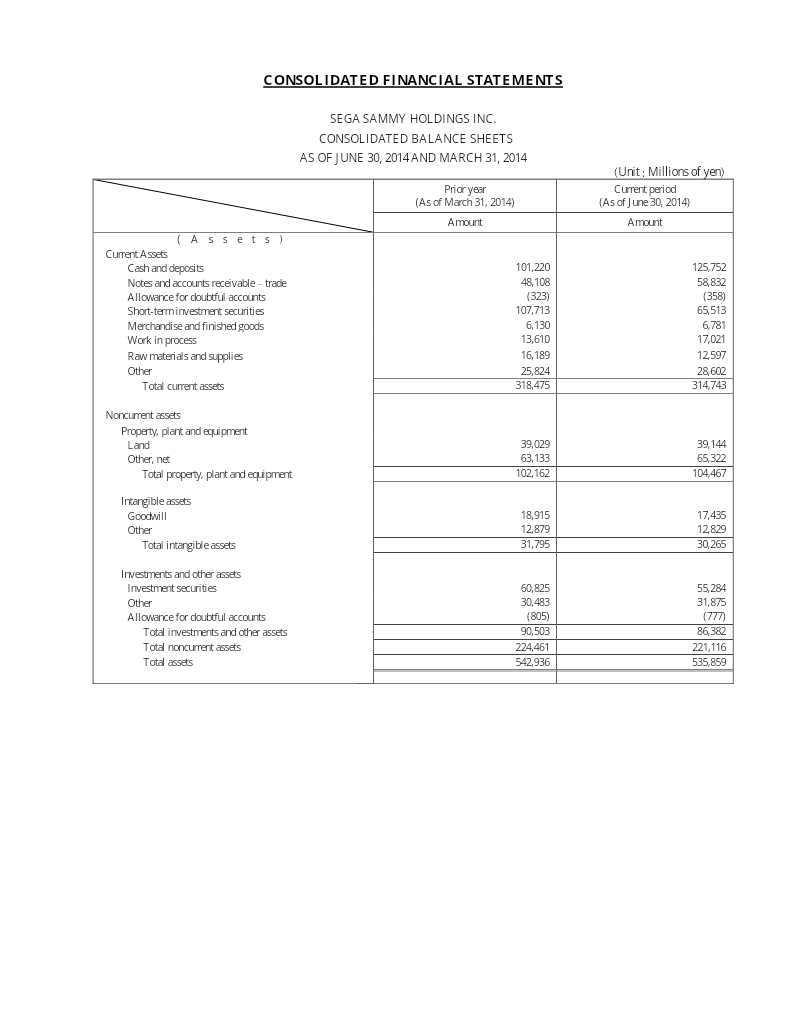
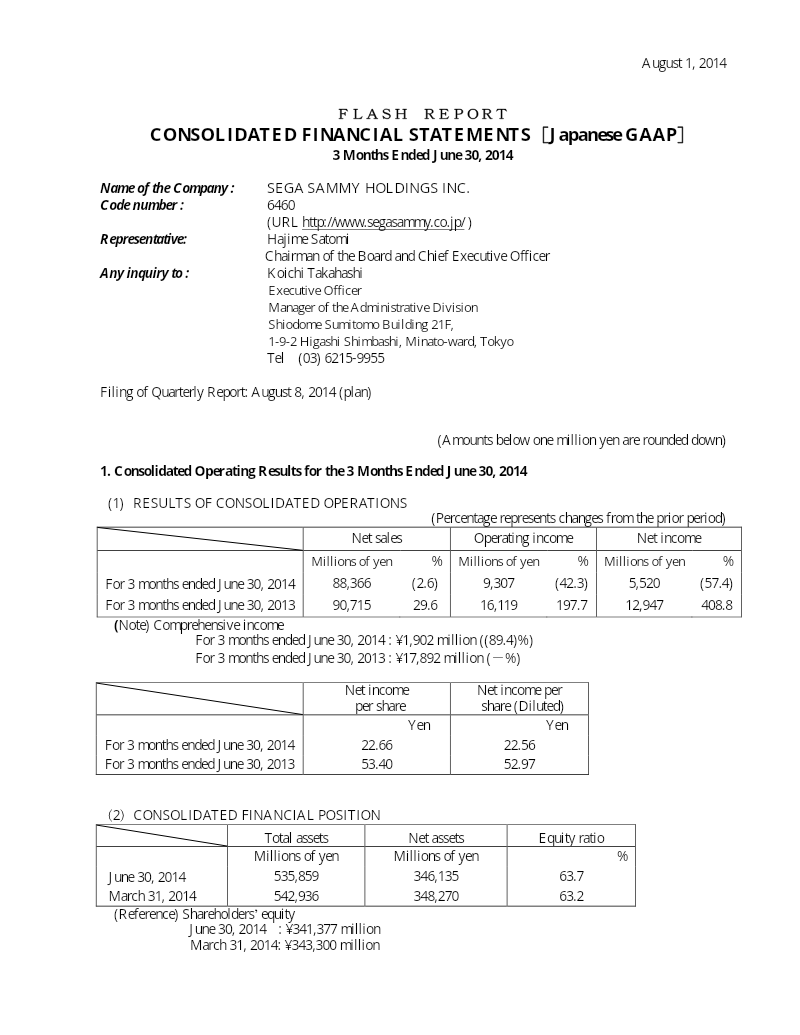
Sega Sammy Holdings Consolidated Financial Statements: 3 Months Ended June 30, 2014
Sega Sammy Holdings reported a challenging start to the fiscal year ending March 31, 2015, as consolidated financial results for the three-month period ending June 30, 2014, showed declines across key performance metrics.
- Sega Sammy Holdings reported a significant decline in profitability for the quarter ending June 30, 2014, with operating income falling 42.3% to 9,307 million yen and net income dropping 57.4% to 5,520 million yen.
- Net sales for the group decreased 2.6% year-over-year to 88,366 million yen, driven by a sluggish amusement market and demand fluctuations following a consumption tax increase.
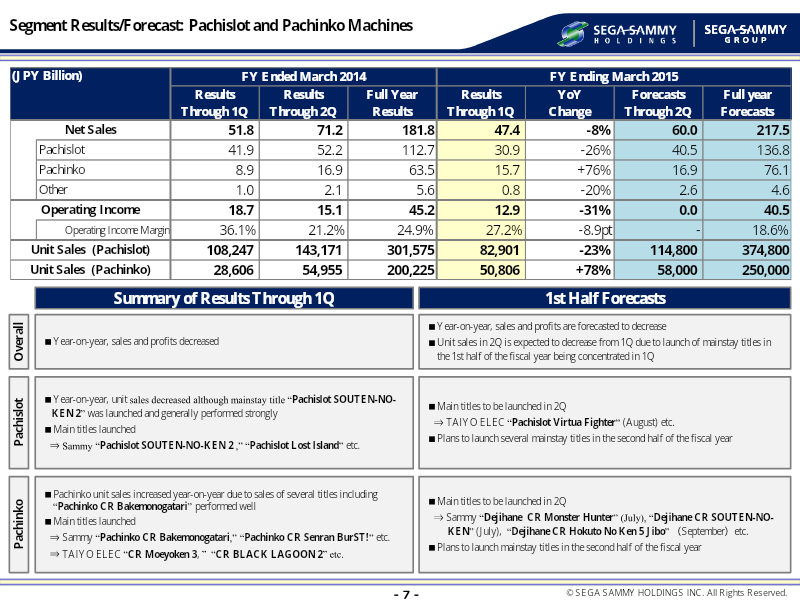
- The Pachislot and Pachinko segment, the company's primary revenue driver, saw net sales fall 8.5% to 47,476 million yen, with operating income declining 31.0% due to weak pachislot machine sales.


Consolidated Financial Results for the Three Months Ended June 30, 2014
mixi, Inc., the Tokyo-listed operator of the Monster Strike mobile game and the mixi social network, reported a sharp earnings surge for the first quarter of fiscal 2015 (April 1 to June 30, 2014), prepared under Japanese GAAP.
- Mixi, Inc. achieved a major financial turnaround in Q1 2014, reporting net sales of ¥12,718 million, a 493.1% increase compared to the same period in 2013.
- The company transitioned from a net loss of ¥253 million in Q1 2013 to a net income of ¥2,919 million for the quarter ending June 30, 2014.
- The Media & Content Business was the primary growth driver, with segment net sales surging from ¥1,877 million to ¥11,258 million year-over-year.


FY2014 Fourth Quarter Financial Results
Fiscal year 2014 marked a period of structural transition for GREE, characterized by a decline in net sales to ¥125.6 billion and operating income to ¥35.0 billion.
- GREE reported a decline in FY2014 financial performance, with net sales falling to ¥125.6 billion and operating income to ¥35.0 billion due to the decline of the feature phone market.
- The company implemented a 31% reduction in fixed costs during FY2014, resulting in a strengthened cash position of ¥65.5 billion to fund a strategic pivot toward native mobile application development.
- GREE plans to triple its native game operations in FY2015 and expand its Japanese studio headcount to 1,000 employees to support high-performance titles like Shometsu Toshi and the Wright Flyer Studios label.
Capcom 1st Quarter Report: Fiscal Year Ending March 31, 2015
The first quarter report for the fiscal year ending March 31, 2015, outlines Capcom’s financial performance for the three-month period ending June 30, 2014.
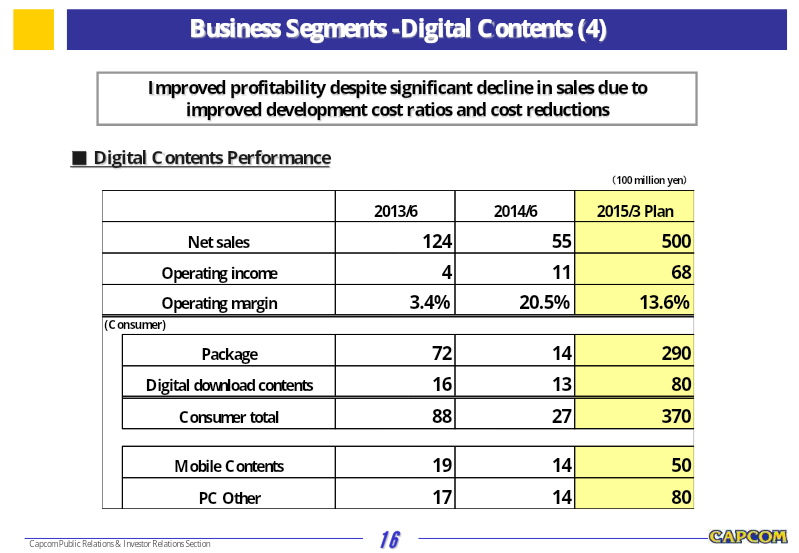
- Capcom reported net sales of 9.575 billion yen for the quarter ending June 30, 2014, a significant decline from the 17.457 billion yen recorded in the same period the previous year.
- Operating income increased to 1.268 billion yen from 723 million yen in the prior year, driven by disciplined cost reductions and profitable repeat sales.
- The company remains on track to meet its full-year fiscal forecast of 80 billion yen in net sales and 10.5 billion yen in operating income.
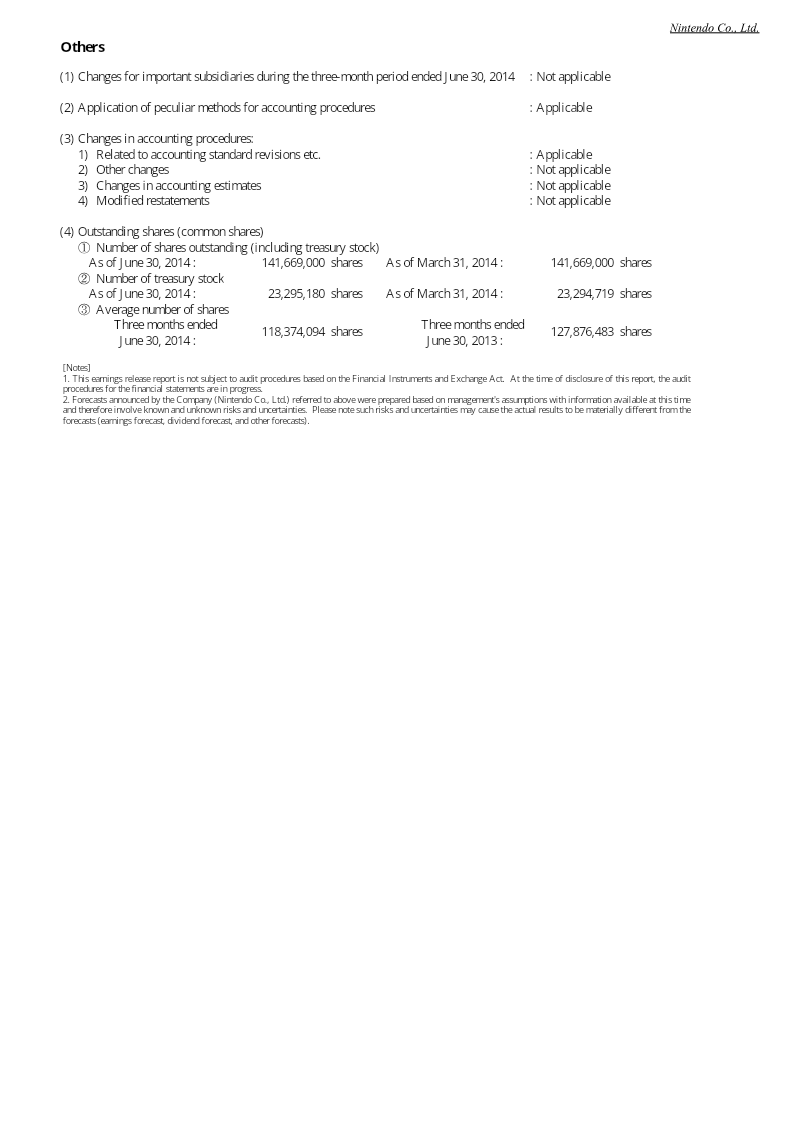
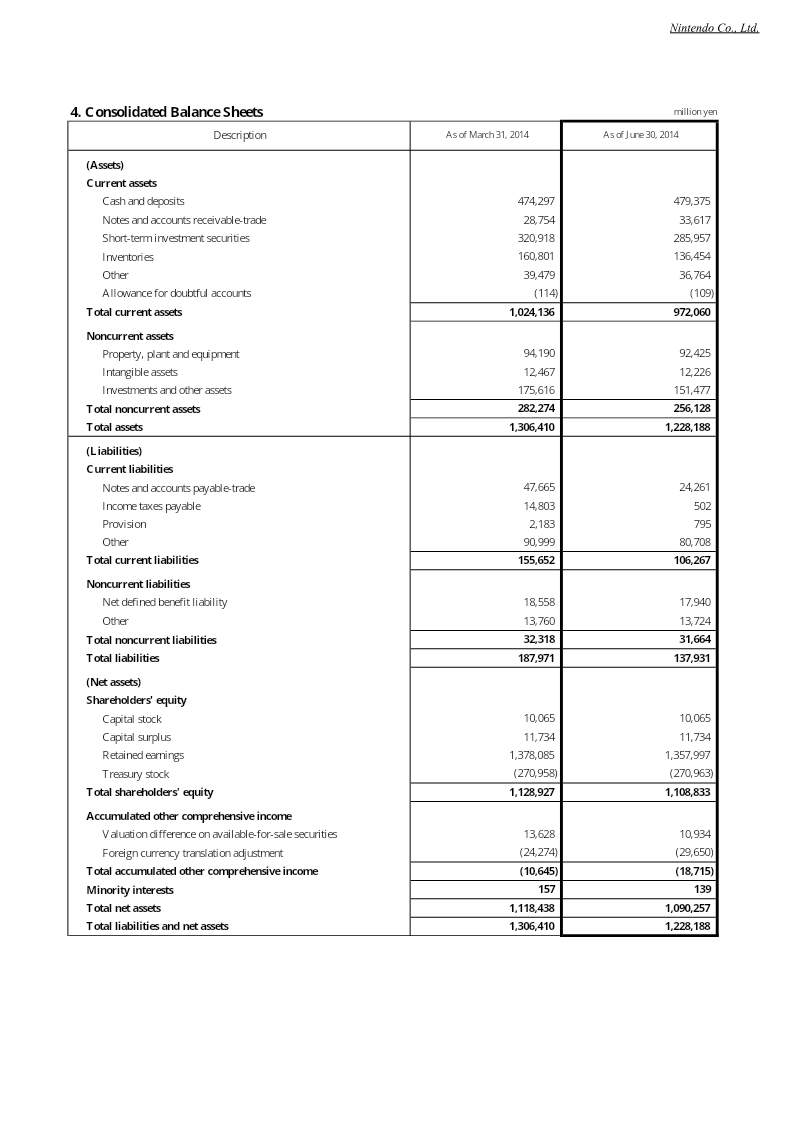
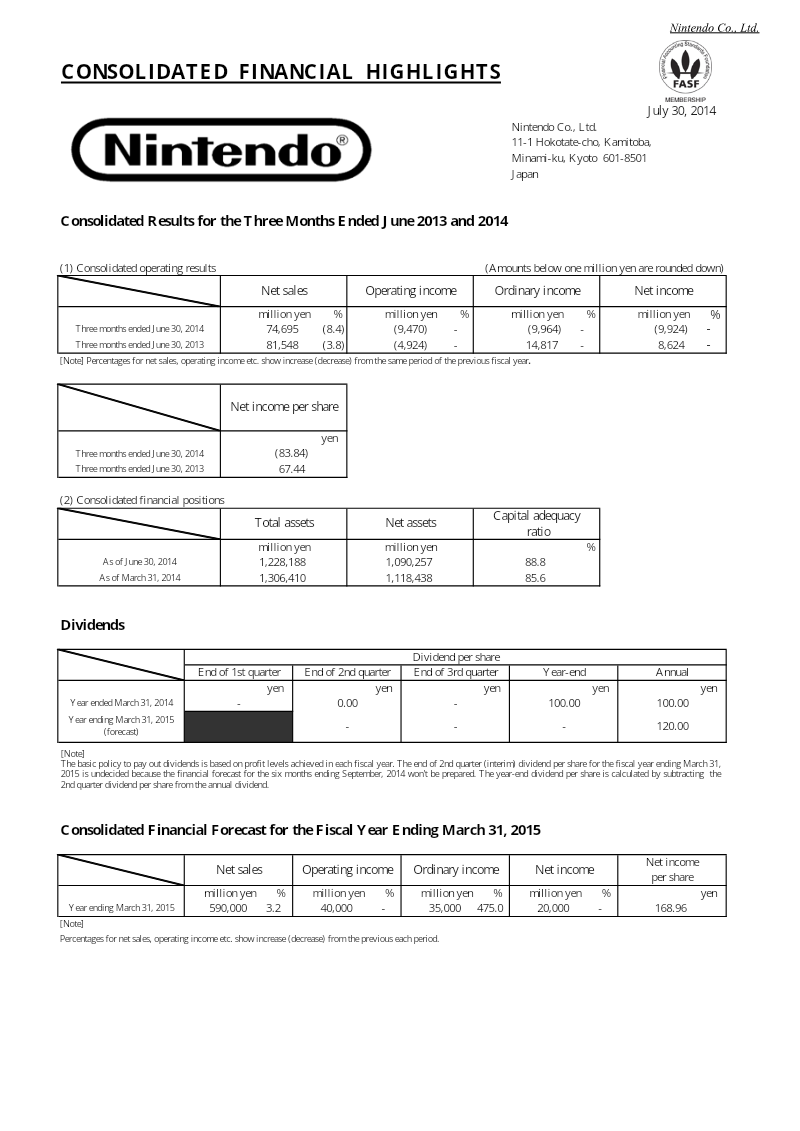
Consolidated Results for the Three Months Ended June 2013 and 2014
Nintendo Co., Ltd. reported a challenging financial performance for the three-month period ending June 30, 2014, characterized by a decline in net sales and a shift into an operating loss.
- Nintendo reported a net loss of 9.9 billion yen for the quarter ending June 30, 2014, a sharp reversal from the 8.6 billion yen profit recorded in the same period of 2013.
- Net sales for the quarter fell 8.4% year-over-year to 74.6 billion yen, with the company recording an operating loss of 9.4 billion yen due to high administrative and selling expenses.
- Overseas markets remain the primary revenue driver for the company, accounting for 77.7% of total net sales during the quarter.
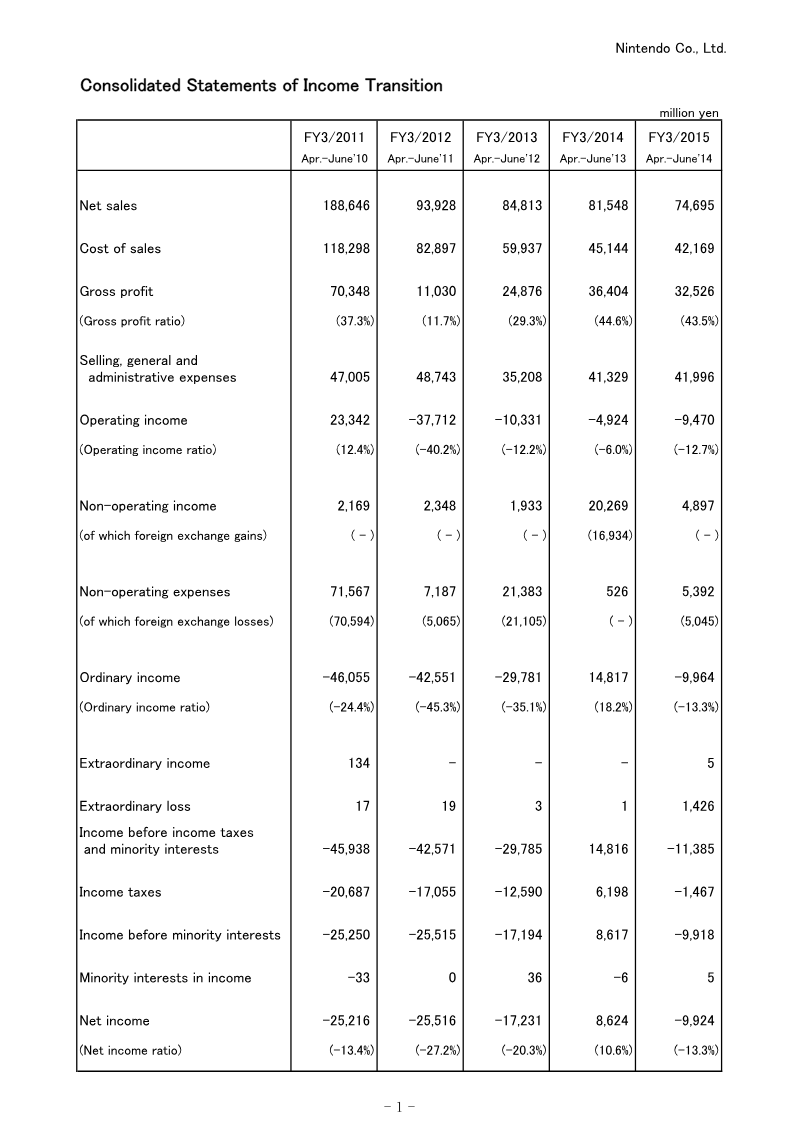
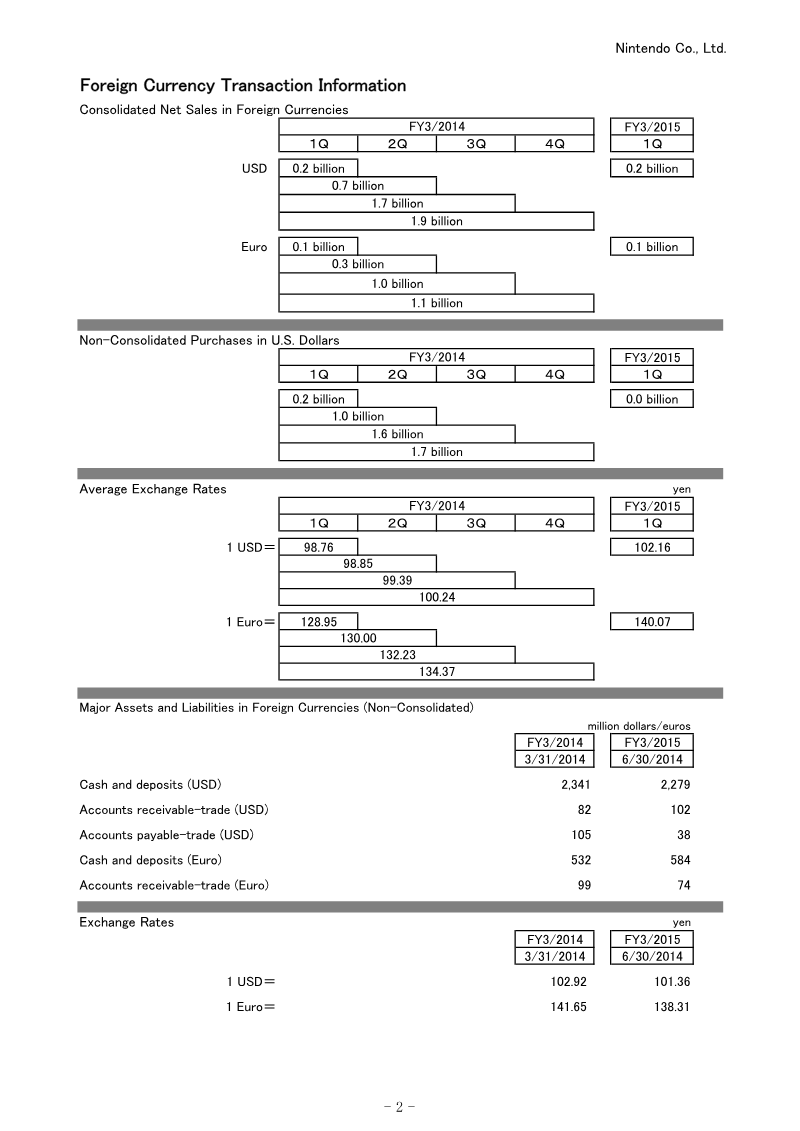
Earnings Release for the Three-Month Period Ended June 2014: Supplementary Information
This supplementary earnings information details Nintendo’s financial performance for the first quarter of the fiscal year ending March 2015, covering the period from April to June 2014.
- Nintendo reported a net loss of 9.9 billion yen and an operating loss of 9.5 billion yen for the first quarter ending June 30, 2014.
- Net sales for the quarter fell to 74.7 billion yen, down from 81.5 billion yen during the same period in the previous fiscal year.
- The Wii U title Mario Kart 8 was a primary performance driver, achieving 2.82 million units in global sales during the quarter.
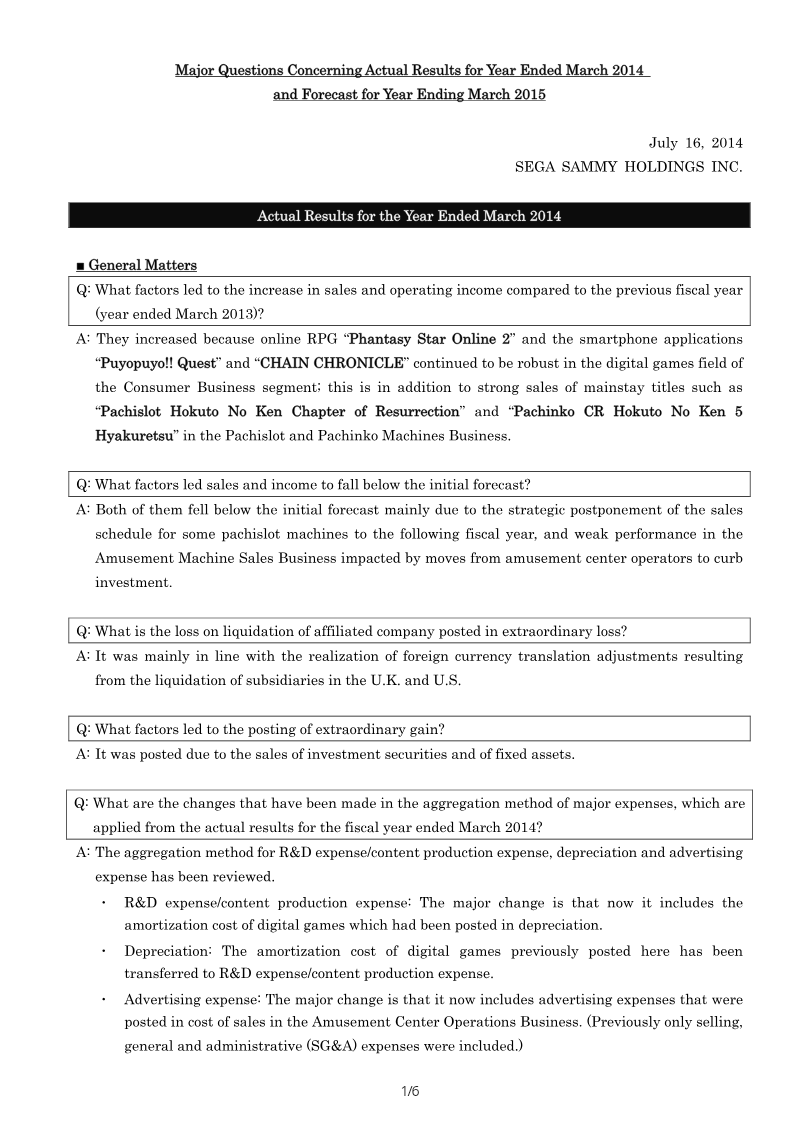
Sega Sammy Holdings: Major Questions Concerning Actual Results for FY Ended March 2014
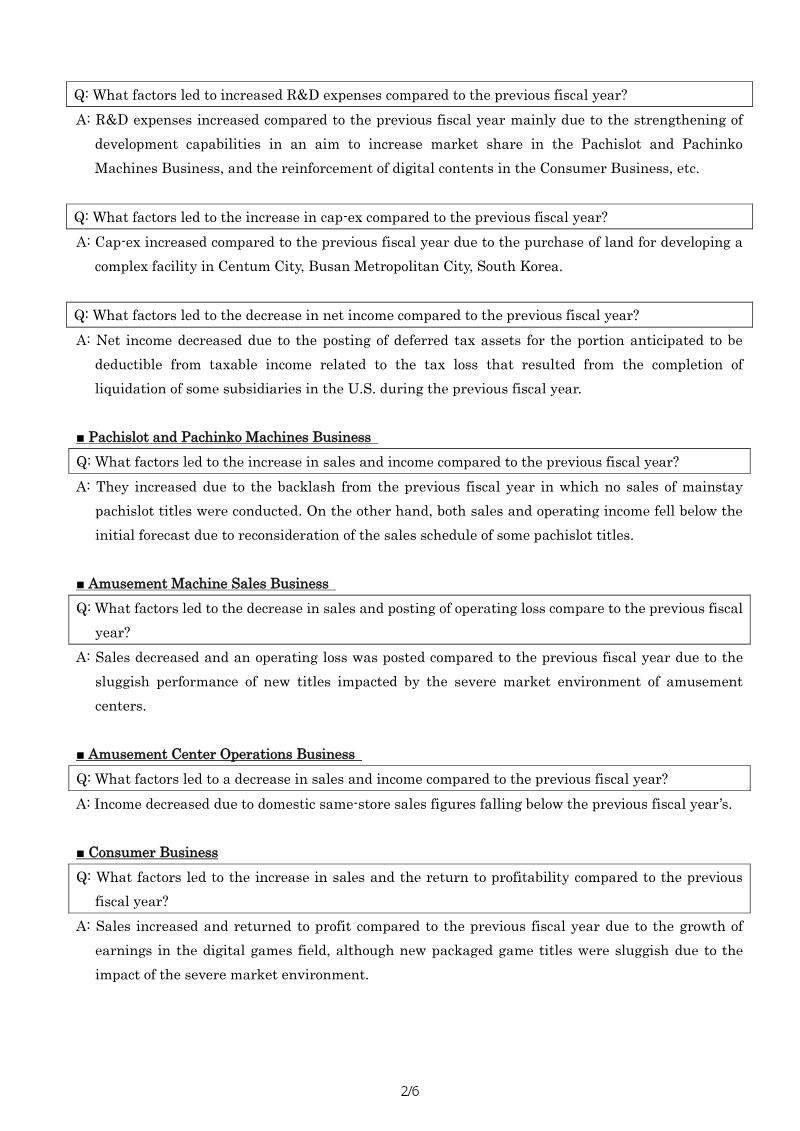
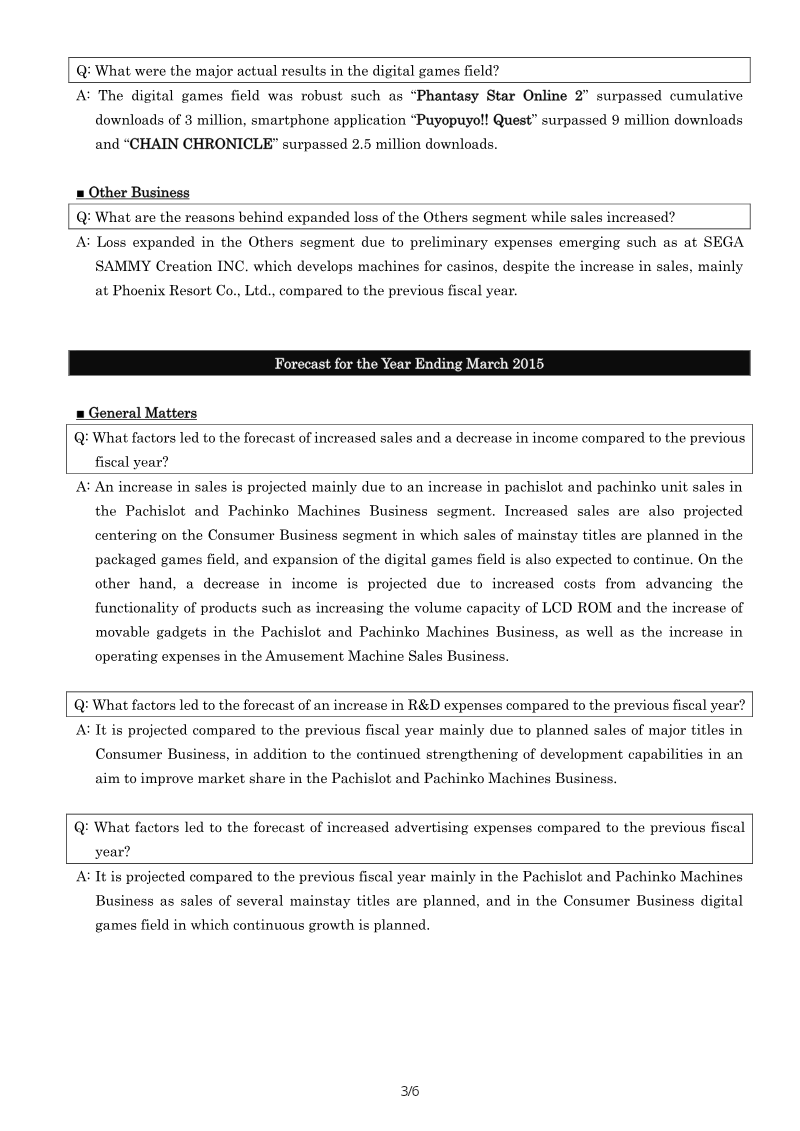
This analysis outlines the financial performance of Sega Sammy Holdings for the fiscal year ended March 2014 and provides a strategic outlook for the fiscal year ending March 2015.
- Sega Sammy Holdings missed its initial FY2014 forecasts due to the strategic postponement of machine sales, a contraction in the amusement center market, and extraordinary losses from liquidating overseas subsidiaries.
- FY2014 year-over-year growth was driven by strong performance in digital titles, specifically Phantasy Star Online 2, Puyopuyo!! Quest, and Chain Chronicle, alongside successful Pachislot and Pachinko machine releases.
- The FY2015 outlook projects increased sales but lower profitability, largely due to rising development costs for sophisticated Pachislot and Pachinko hardware and the impact of Japan’s consumption tax hike on amusement operations.


Square Enix Annual Report FY2014
Square Enix's fiscal 2014 results (year ended March 31, 2014) show a recovery from the prior year's losses, under President Yosuke Matsuda in his first year in the role.
- Square Enix returned to profitability in FY2014 with a net income of ¥6.5 billion and net sales of ¥155 billion, recovering from substantial losses in the previous fiscal year.
- The Digital Entertainment segment served as the primary growth engine, generating over ¥94 billion in revenue through the success of Final Fantasy XIV: A Realm Reborn and mobile titles like Dragon Quest Monsters Super Light.
- The company shifted to a digital-first strategy, prioritizing cloud gaming, variable pricing, and shorter development cycles to reduce reliance on traditional console disc distribution.
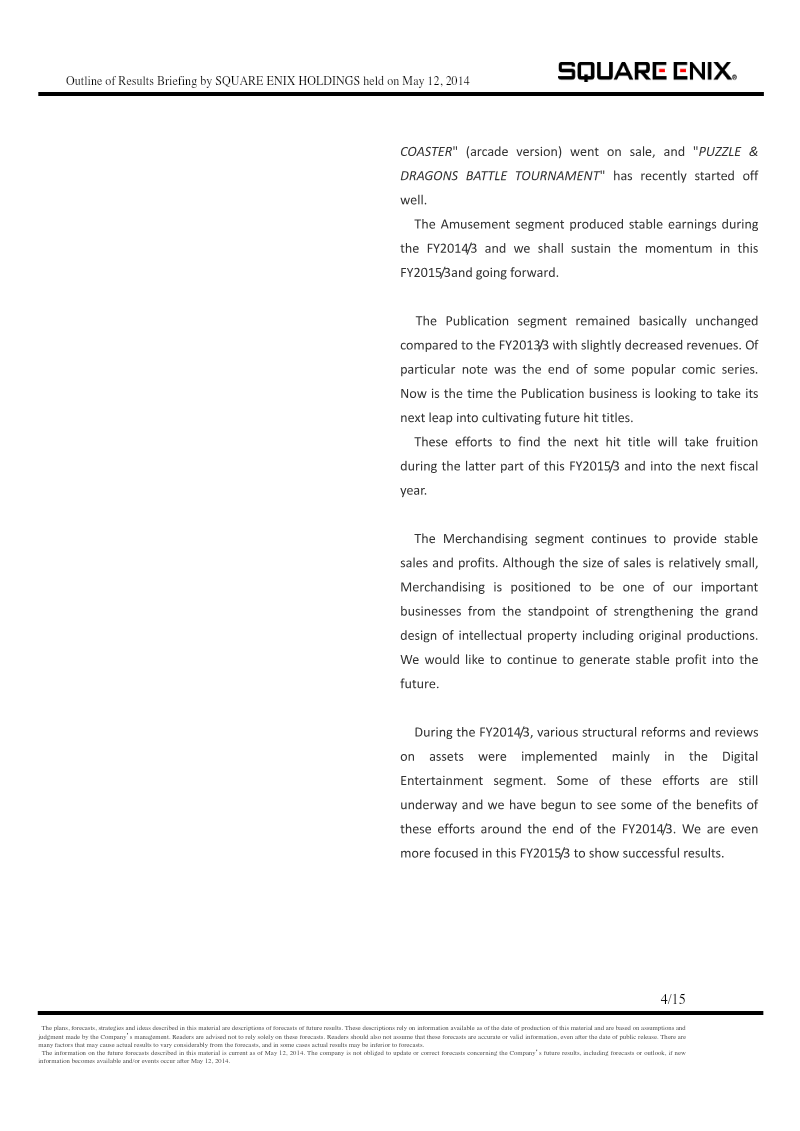
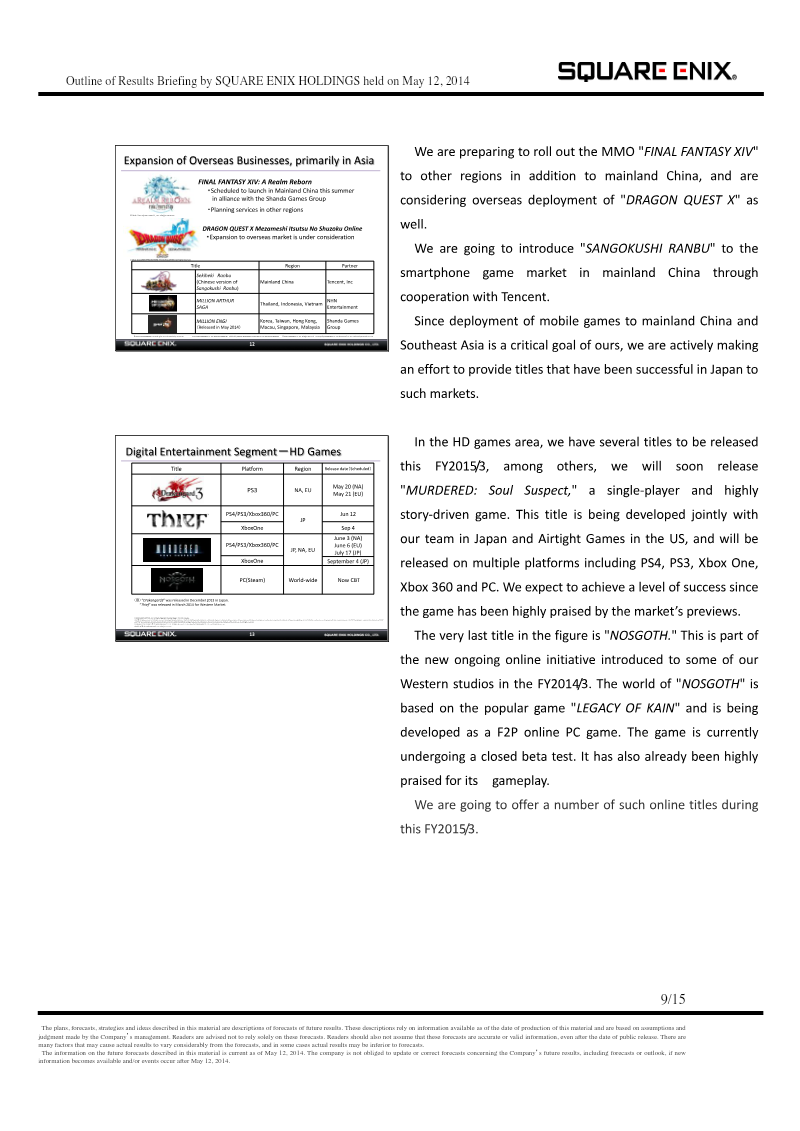
Square Enix Holdings Financial Results Briefing: FY2014/3
Square Enix achieved a financial turnaround for the fiscal year ended March 31, 2014, reporting net sales of ¥155 billion and an operating income of ¥10.5 billion.
- Square Enix achieved a financial turnaround for FY2014/3, reporting ¥155 billion in net sales and ¥10.5 billion in operating income.
- The company's recovery was driven by the strong performance of Final Fantasy XIV, a shift to PC-first development in Western studios, and an accelerated transition to mobile gaming.
- Management projects a conservative outlook for FY2015/3, with net sales estimated between ¥140 billion and ¥150 billion and operating income between ¥5 billion and ¥10 billion.