2015
Company
Documents about 2015

Was the Clash of Clans Super Bowl Commercial About User Acquisition?
The Super Bowl commercial for Clash of Clans, which aired in early 2015, serves as a case study for the strategic shift of mobile game developers toward traditional, high-cost media.
- Supercell paid approximately $9 million for a 30-second Super Bowl XLIX ad spot, excluding production costs, based on NBC's rates of $4.4 to $4.5 million per spot.
- Assuming 28 million viewers saw the ad, the cost per viewer was $0.32, and a 1% conversion rate would result in a cost-per-install (CPI) of $32.08 for 281,000 new users.
- While the ad drove an increase in App Store rankings from 38th to 28th, the primary goal of such high-profile television advertising for mature games is likely brand legitimacy and re-engagement rather than pure user acquisition.
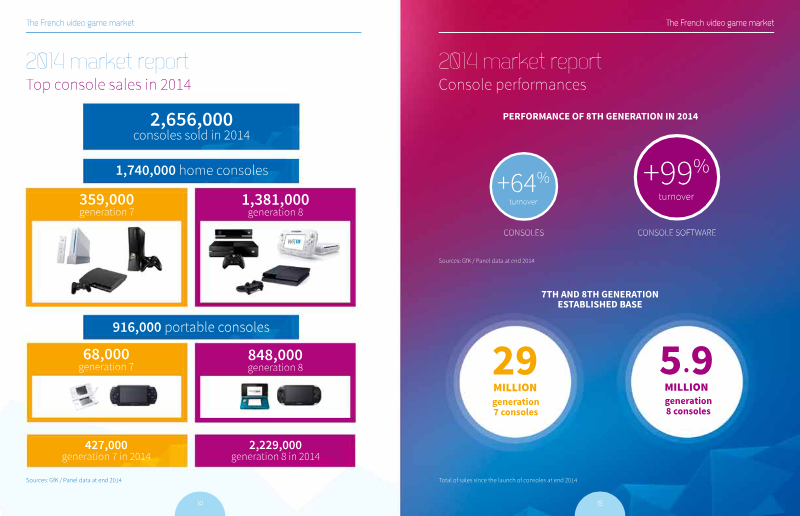
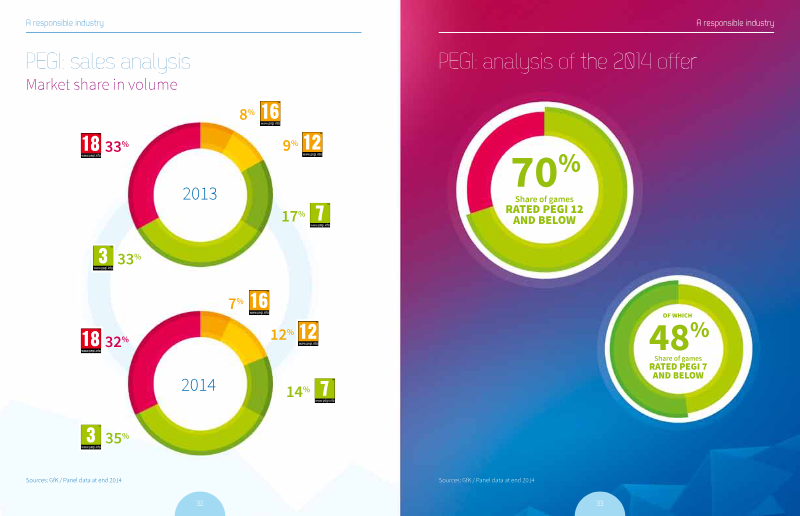

Essential Video Game News: Market, Consumption and Use (February 2015)
The French video game industry experienced a significant resurgence in 2014, marking its first period of growth since 2008 with a 3% increase in total market value.
- The French video game market grew by 3% in 2014, marking its first period of growth since 2008.
- Eighth-generation consoles are the primary market driver, currently accounting for 89% of the total console market value.
- Video games have achieved high social penetration in France, with 75% of the population playing regularly and 78% viewing gaming as a family-oriented activity.


Summary of Financial Results for Fiscal Year Ended December 31, 2014 (Japanese GAAP) (Consolidated)
KLab Inc. achieved a significant financial turnaround during the fiscal year ended December 31, 2014, transitioning from a substantial net loss of 2.56 billion yen in 2013 to a net income of 1.79 billion yen.
- KLab Inc. achieved a financial turnaround in 2014, moving from a 2.56 billion yen net loss in 2013 to a net income of 1.79 billion yen.
- Record-high revenue of 21.37 billion yen was driven by the success of 'Love Live! School Idol Festival' and a strategic pivot to mobile platforms.
- Apple and Google served as the primary revenue drivers, generating over 16.4 billion yen in combined sales.


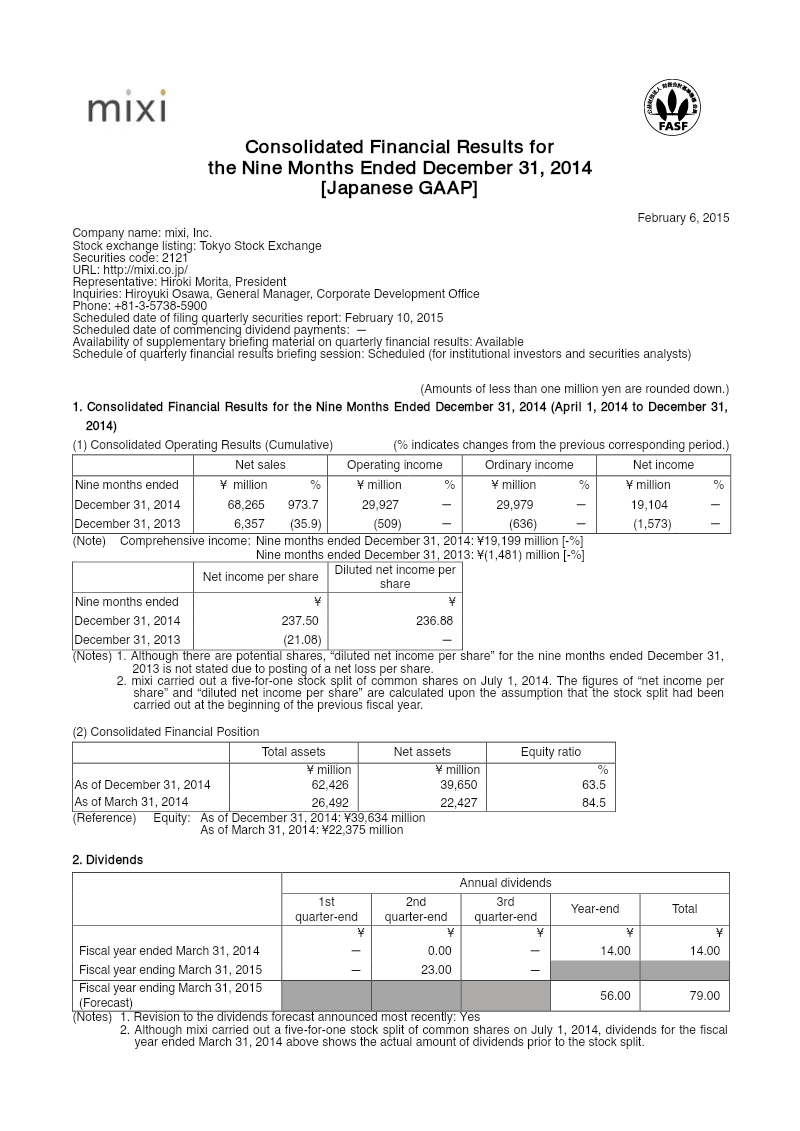
Consolidated Financial Results for the Nine Months Ended December 31, 2014
mixi, Inc. reported a dramatic surge in consolidated results for the nine months ended December 31, 2014 (April 1 to December 31, 2014) under Japanese GAAP.
- Mixi, Inc. experienced explosive growth in the first nine months of fiscal year 2015, with net sales surging 973.7% year-over-year to 68,265 million yen.
- The company achieved a significant profitability turnaround, moving from an operating loss of 509 million yen in 2013 to an operating income of 29,927 million yen by December 31, 2014.
- The Media & Content segment served as the primary growth engine, generating 63,658 million yen in sales and 31,198 million yen in segment income.

Why Kabam is toning down its F2P monetisation
The mobile gaming industry is currently navigating a shift toward long-term player retention and sustainable monetization strategies, as evidenced by the financial performance and strategic pivots of major players like Electronic Arts and Kabam.
- Kabam shifted its strategy from aggressive, short-term monetization to a 'less is more' approach after missing its 2014 revenue target of $550–600 million, reporting only $400 million.
- To improve long-term lifetime value, Kabam is reducing its game release frequency and easing monetization mechanics, such as gifting players small amounts of hard currency to foster better sentiment.
- Mobile game developers are increasingly utilizing 'extreme user acquisition,' evidenced by companies like Supercell and uCool investing millions in high-profile traditional media, including Super Bowl advertising.
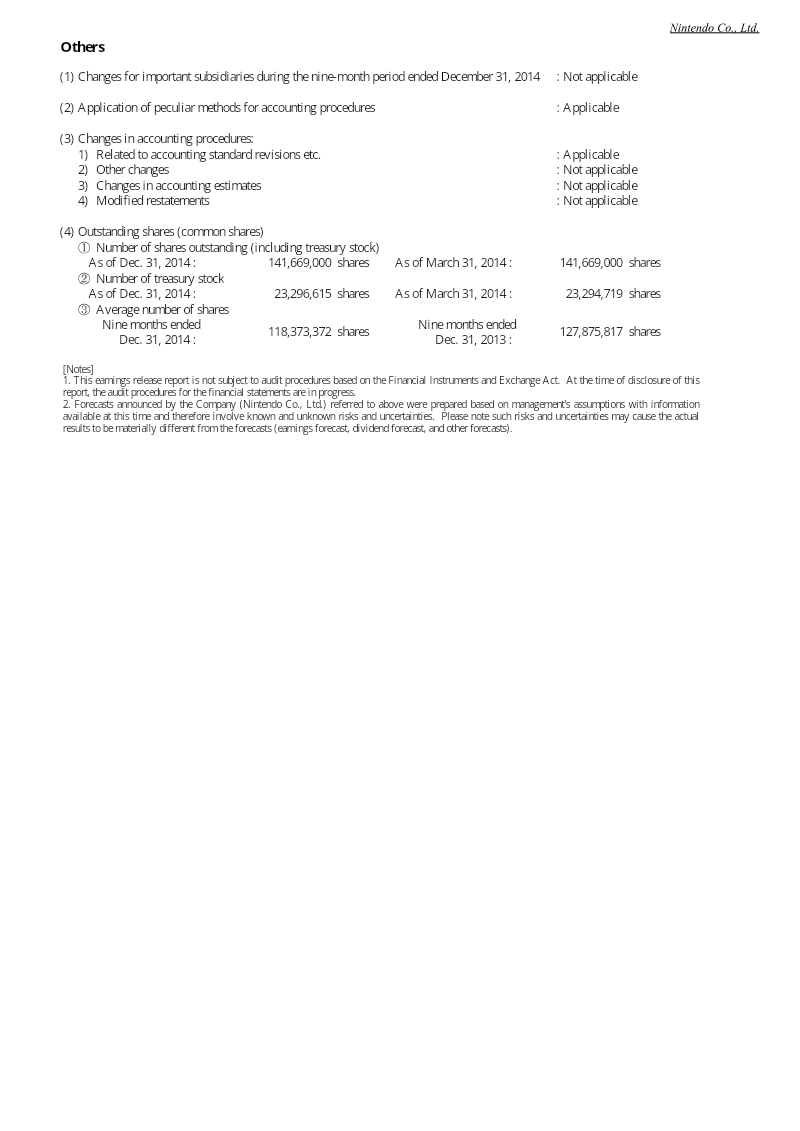
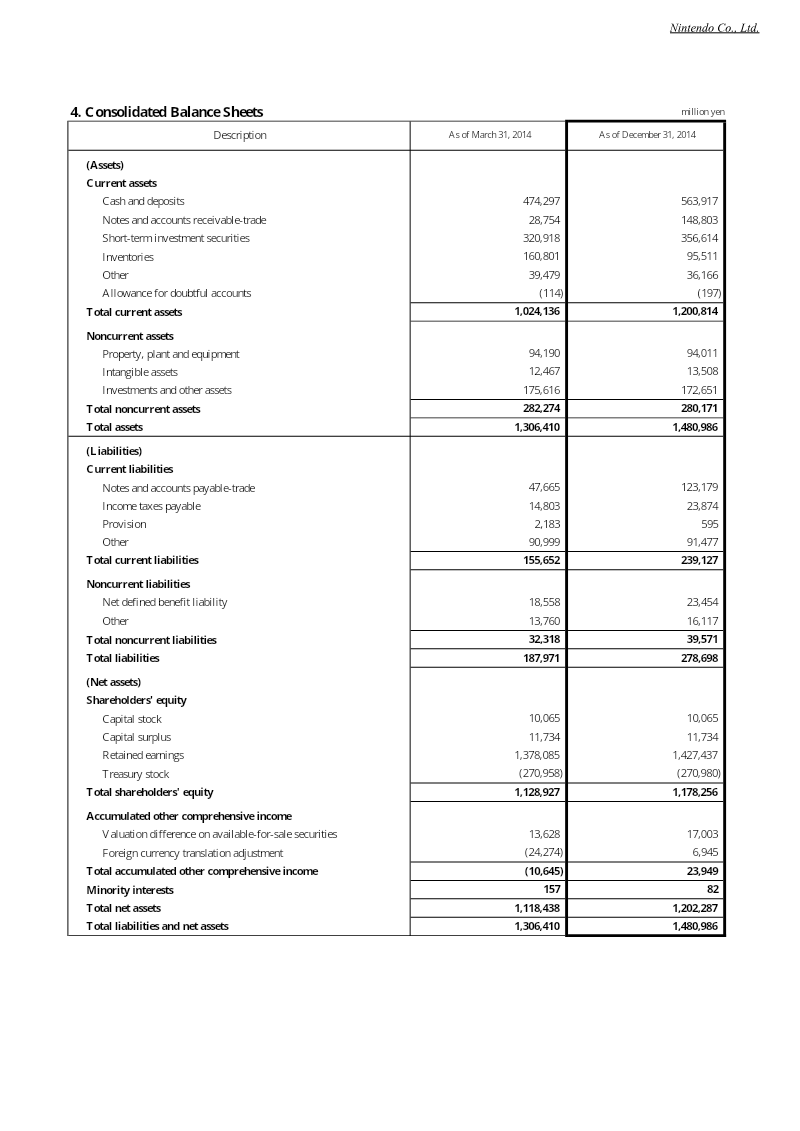
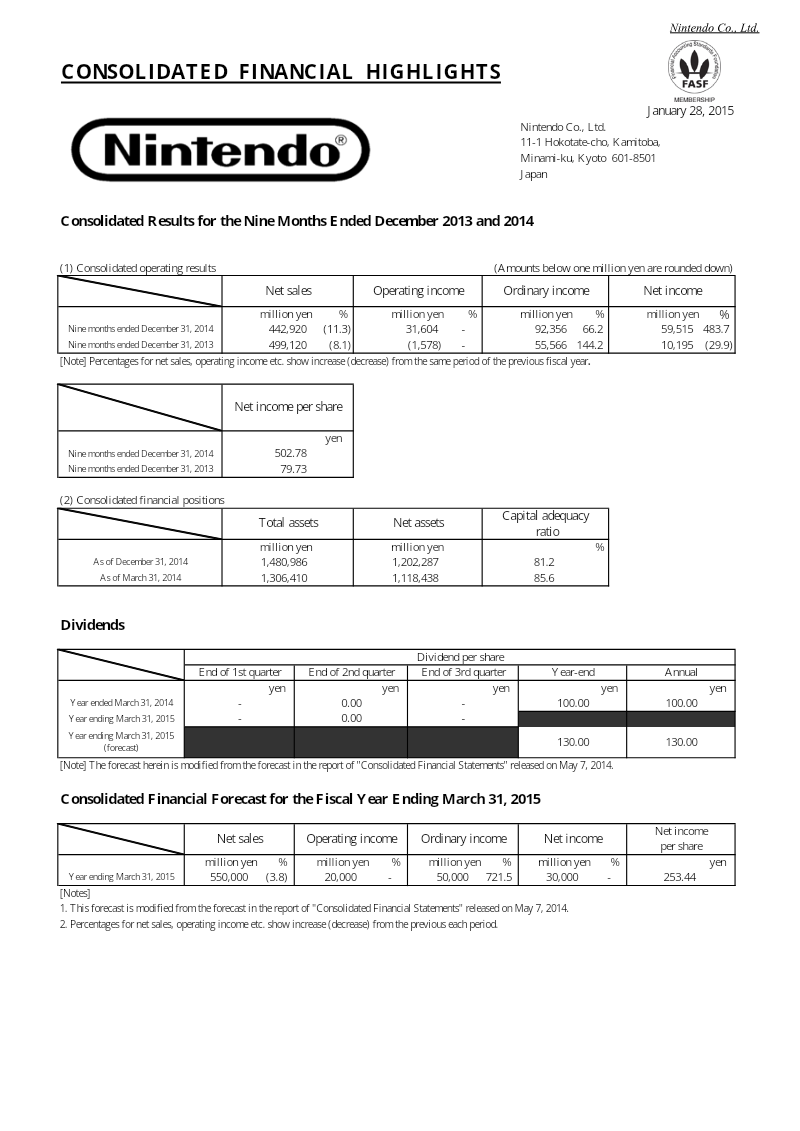
Consolidated Results for the Nine Months Ended December 2013 and 2014
Nintendo’s consolidated financial results for the nine-month period ending December 31, 2014, reflect a transition in hardware performance and a significant boost in profitability driven by favorable currency fluctuations.
- Nintendo achieved a net income of 59.5 billion yen for the nine months ending December 2014, significantly bolstered by 51.0 billion yen in foreign exchange gains.
- Operating income recovered to 31.6 billion yen, a turnaround from the 1.6 billion yen operating loss recorded during the same period in 2013.
- Net sales declined by 11.3% year-over-year to 442.9 billion yen, with 73.0% of total revenue generated from overseas markets.
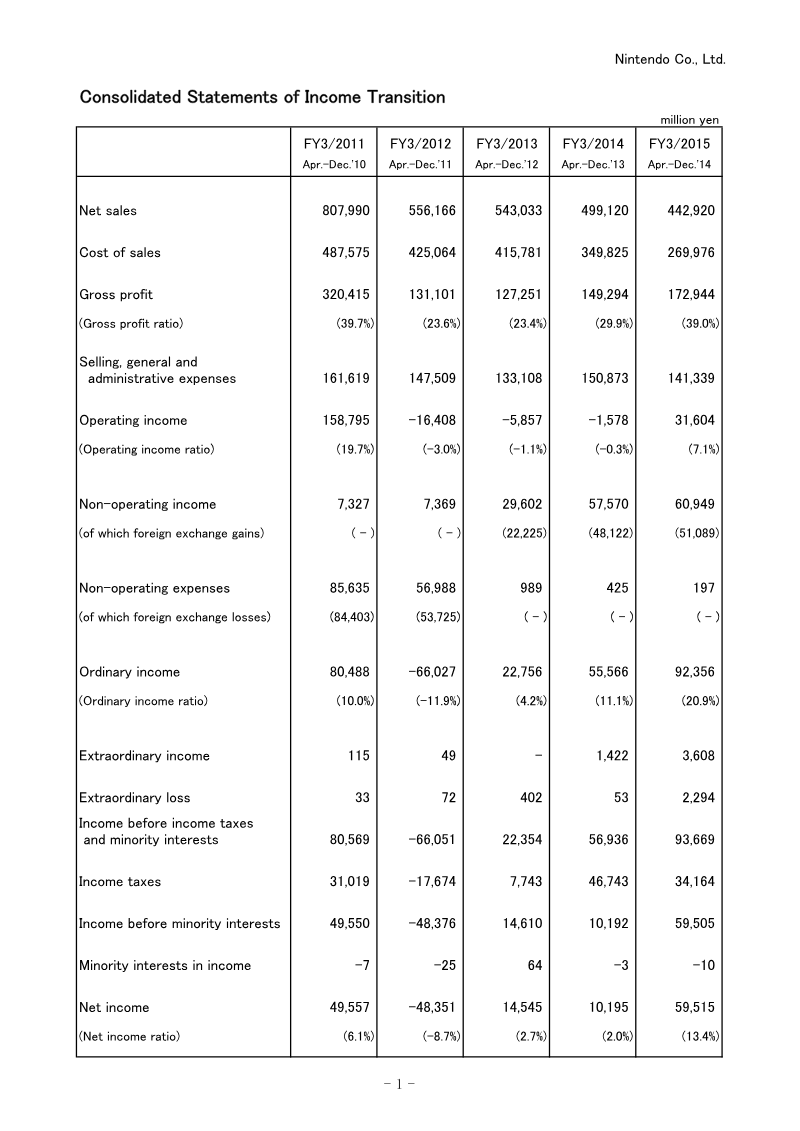
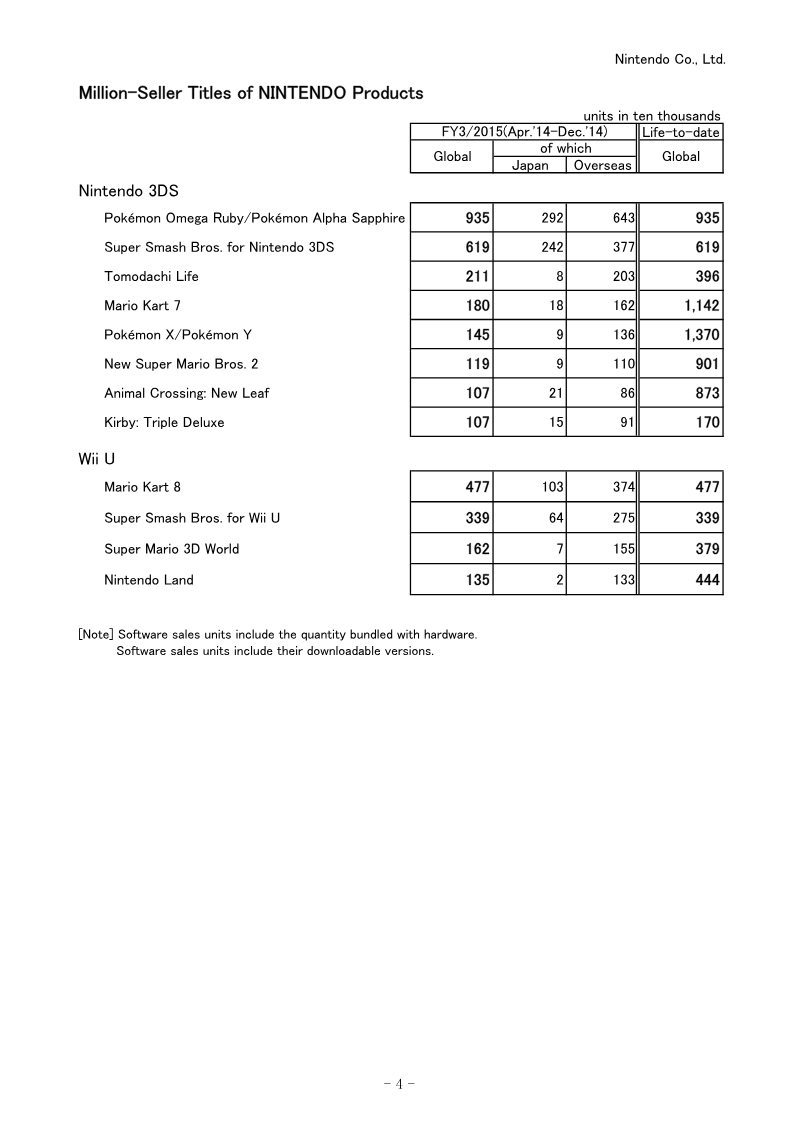
Earnings Release for the Nine-Month Period Ended December 2014: Supplementary Information
This supplementary information provides a detailed financial and operational overview of Nintendo Co., Ltd. for the nine-month period ending December 31, 2014.
- Nintendo's net sales for the nine months ended December 31, 2014 were 442.9 billion yen, with operating income of 31.6 billion yen, a return to operating profit from the prior year's operating loss.
- Net income rose to 59.5 billion yen, a 13.4% net income ratio, but substantial non-operating income, including 51.1 billion yen in foreign exchange gains, contributed heavily to this result.
- The gross profit margin was 39.0%, supporting the operating recovery alongside the reported income growth.
Microsoft Form 10-Q: Q2 FY2015
Microsoft’s financial performance for the second quarter of fiscal year 2015 reflects a pivotal transition toward a mobile-first, cloud-first strategy.
- Microsoft acquired Nokia’s Devices and Services business on April 25, 2014, for a total purchase price of $9.4 billion, consisting of $7.1 billion in cash and $2.1 billion in non-cash convertible note repurchases.
- As of December 31, 2014, Microsoft held $90.2 billion in cash, cash equivalents, and short-term investments, an increase from $85.7 billion at the end of the previous fiscal year on June 30, 2014.
- Commercial Cloud and server products drove a 7% revenue increase in the Commercial segment for the six months ended December 31, 2014, with server products revenue growing 11% during that period.

10 key trends shaking up the mobile games market in 2015
The mobile gaming industry in 2015 is defined by a complex interplay between established market dominance and emerging creative shifts.
- High user acquisition costs have created a significant barrier to entry, allowing well-funded companies like Supercell and King to dominate top-grossing charts through massive advertising and television campaigns.
- Smaller developers are increasingly pivoting toward paid game models to avoid the resource-heavy update requirements of the games-as-a-service model.
- Free-to-play developers face mounting pressure from international regulators regarding aggressive monetization practices and the protection of minors.

Big numbers from Monument Valley, Crossy Road and Minecraft
The mobile gaming industry began 2015 with a focus on monetization strategies, highlighted by performance data from three prominent titles: Minecraft, Crossy Road, and Monument Valley.
- Monument Valley generated $5.8 million in net earnings against $1.4 million in development costs, resulting in a $4.5 million profit from 2.4 million sales.
- Crossy Road’s two-person development team earned $1 million in revenue by utilizing Unity Ads, demonstrating the financial viability of non-intrusive, incentivized video advertising.
- Minecraft maintains its status as a premium mobile outlier, having reached a total of 30 million downloads.

3 User Acquisition Megatrends for 2015
The mobile gaming industry faced a pivotal shift in 2015, characterized by increasing competition and the professionalization of marketing strategies.
- The provided source content contains no substantive data, analysis, or text regarding the '3 User Acquisition Megatrends for 2015' beyond the title and publication date.
- The document serves as a placeholder for a presentation delivered at PocketGamer Connects in London on January 13, 2015, but does not include the actual content of the slides.
- No specific metrics, growth rates, or strategic insights are available in the provided text to summarize.

Methods for Analyzing Let's Plays: Context Analysis for Gaming Videos on
This methods guide presents a six-question context-analysis matrix (who, what, when, where, why, how) for studying Let's Play videos on YouTube, adapted from the historical-critical method.
- The report argues that context analysis must precede content analysis of Let's Play videos, using a six-question matrix (who, what, when, where, why, how) adapted from the historical-critical method.
- Context for gaming videos operates on three levels: the game itself, the Let's Play video and its channel, and the accompanying comment section.
- Archiving is treated as a prerequisite for this research, because games, software, hardware, video files, channel pages, and comments can change or disappear, and standard mirroring tools alter original web content in ways that undermine scholarly reliability.