2015
Company
Documents about 2015
Bandai Namco Holdings Consolidated Financial Report: Third Quarter of the Fiscal Year Ending March 31, 2015
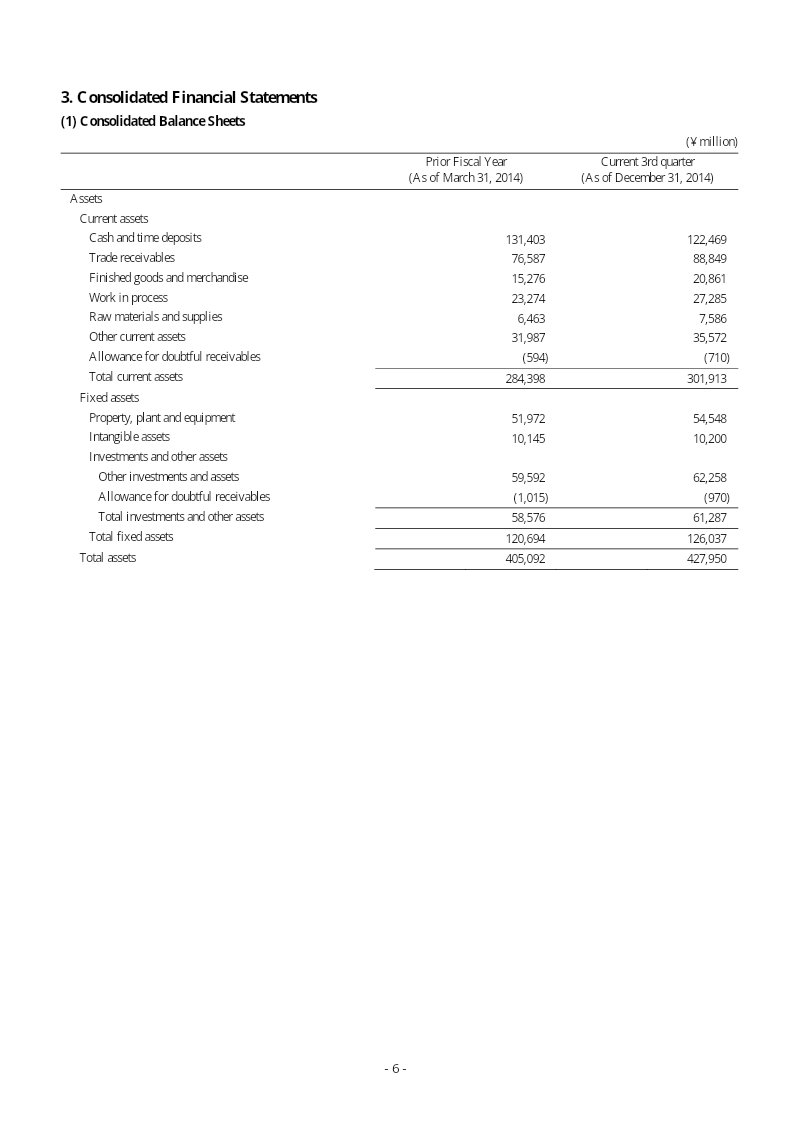
Bandai Namco Holdings achieved robust financial growth during the first nine months of the fiscal year ending March 31, 2015, characterized by an 11.2% increase in net sales to ¥409.18 billion and an 11.4% rise in operating income to ¥47.64 billion.
- Bandai Namco reported strong growth for the first nine months of the fiscal year ending March 31, 2015, with net sales rising 11.2% to ¥409.18 billion and operating income increasing 11.4% to ¥47.64 billion.
- The Toys and Hobby segment was the primary driver of financial performance, recording a 31.2% surge in sales fueled by the success of Mobile Suit Gundam and Yokai Watch.
- The company has set a new mid-term financial goal to reach ¥60 billion in operating income by the 2018 fiscal year.
Financial Highlights for the 1st Quarter of the Fiscal Year Ending March 2015 (FY2014)
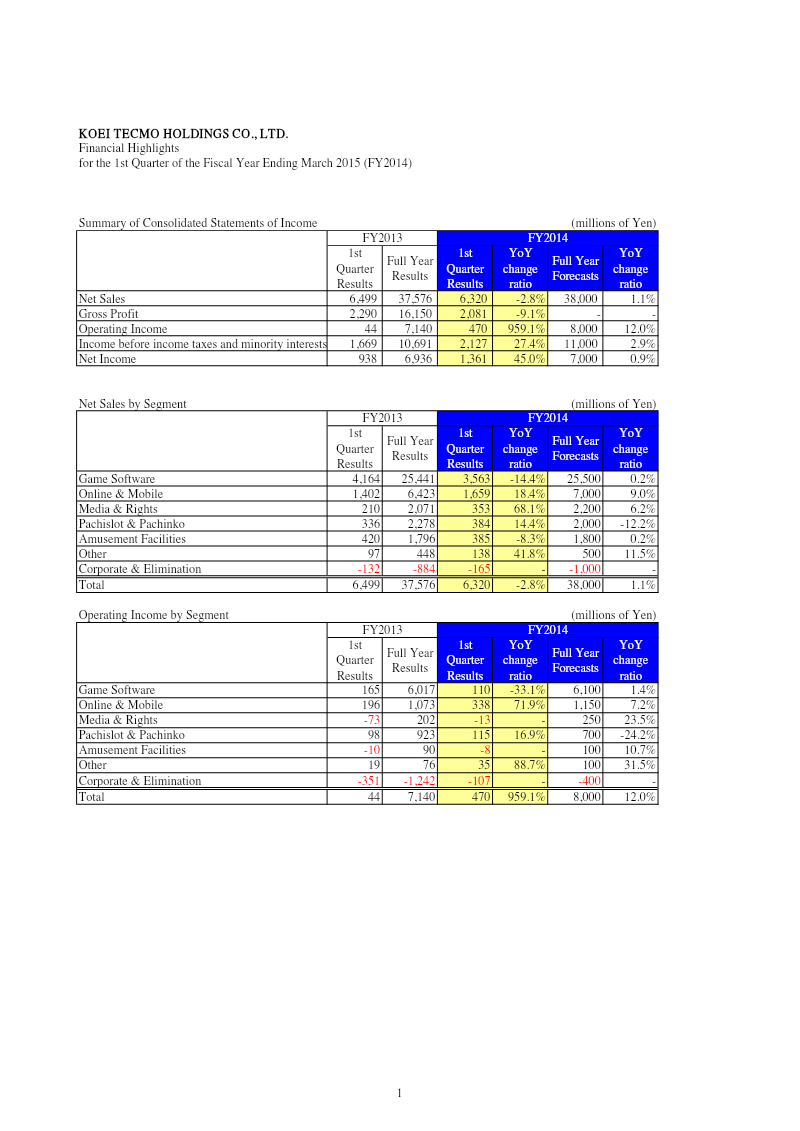
Koei Tecmo Holdings reported a significant increase in profitability for the first quarter of the fiscal year ending March 2015, despite a slight decline in overall revenue.
- Koei Tecmo Holdings achieved a 959.1% surge in operating income to 470 million yen and a 45% increase in net income to 1.36 billion yen for the quarter ending June 30, 2014, despite a 2.8% decline in net sales to 6.32 billion yen.
- The Online & Mobile segment acted as the primary growth engine, delivering an 18.4% increase in sales and a 71.9% rise in operating income.
- The core Game Software division underperformed during the quarter, with sales falling 14.4% and operating income dropping 33.1% due to the cyclical nature of title releases.
Frontier Developments plc Half Yearly Results 2015
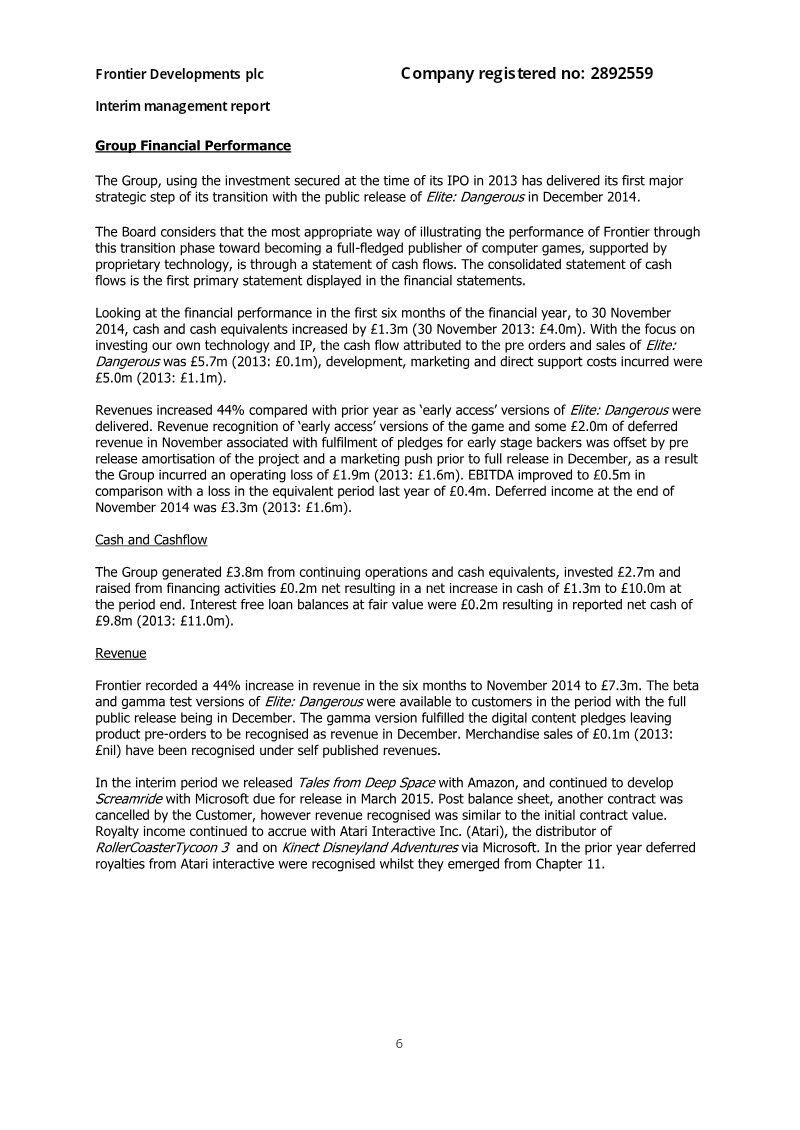
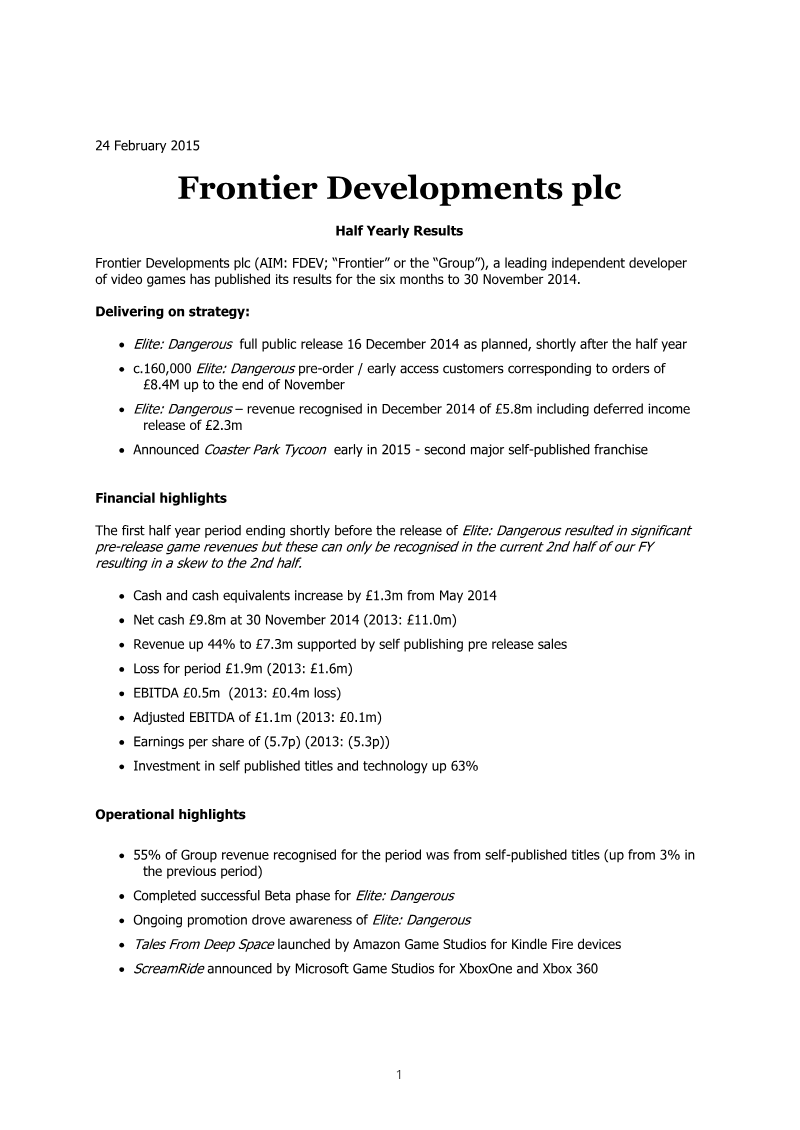
Frontier Developments is successfully executing a strategic pivot from a work-for-hire model toward a self-publishing business structure.
- Frontier Developments successfully transitioned its revenue model, with self-published titles accounting for 55 percent of total revenue in the six months ending November 30, 2014, compared to only 3 percent in the prior year.
- Total revenue grew by 44 percent to £7.3 million, driven primarily by the commercial performance of the self-published title Elite: Dangerous.
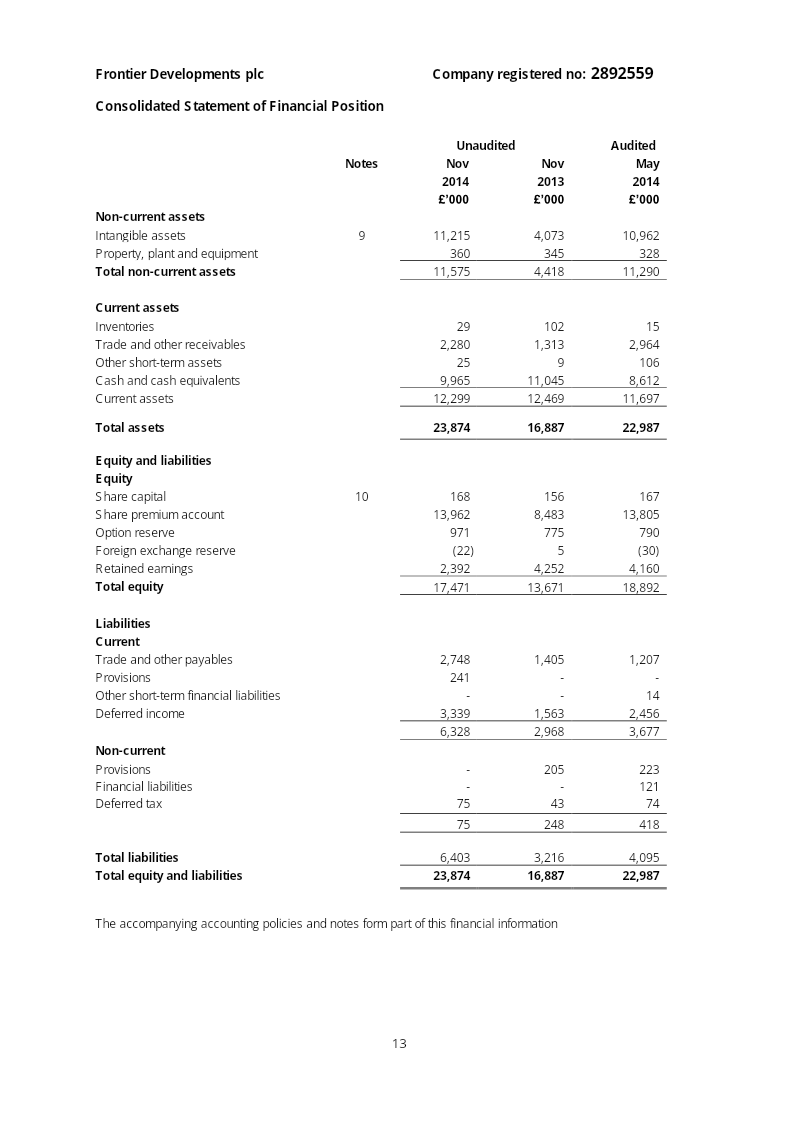
- The company reported an operating loss of £1.9 million and a net loss of £1.89 million, primarily due to heavy investment in self-published software assets, which reached a net book value of £8.68 million.
Marvelous Inc. Third Quarter Financial Results: Fiscal Year Ending March 31, 2015
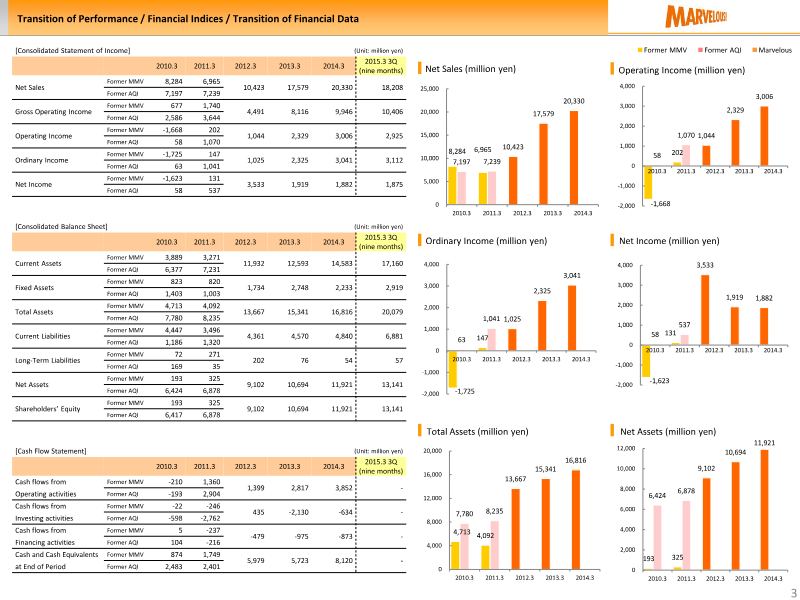
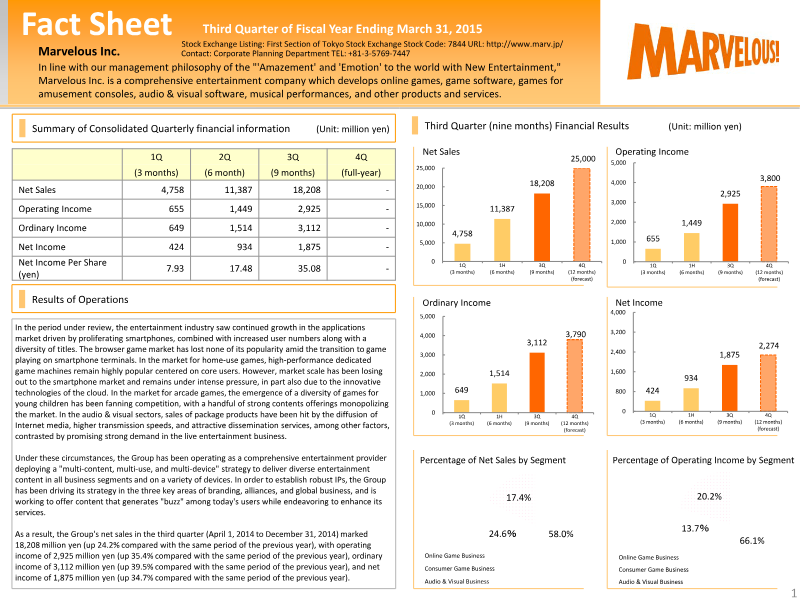
Marvelous Inc. reports strong financial growth for the third quarter of the fiscal year ending March 31, 2015, driven by a multi-content, multi-use, and multi-device strategy.
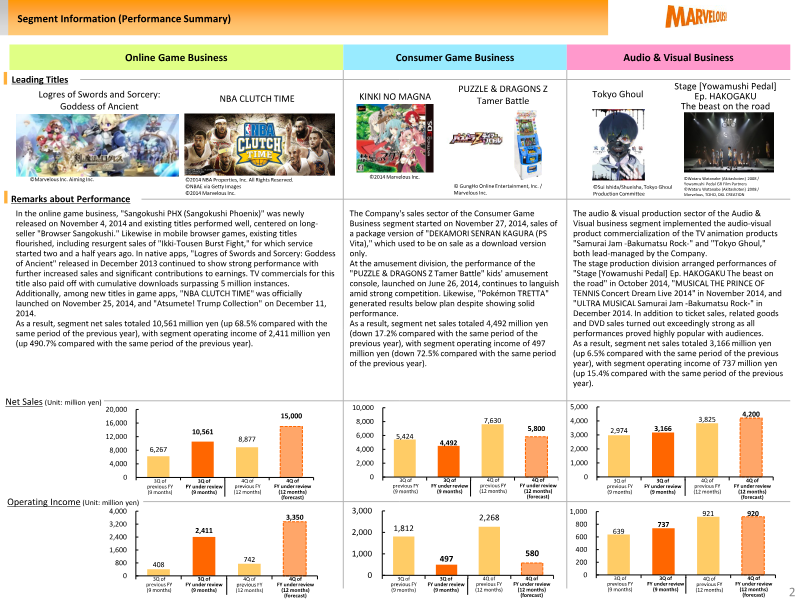
- Marvelous Inc. achieved 18,208 million yen in net sales for the nine months ending December 31, 2014, a 24.2% increase year-over-year.
- The online game segment was the primary growth driver, generating 10,561 million yen in sales, a 68.5% increase compared to the same period in the previous year.
- Operating income rose 35.4% to 2,925 million yen, while ordinary income grew 39.5% to 3,112 million yen for the nine-month period.

Marvelous Inc. Third Quarter Results Briefing Materials: Fiscal Year Ending March 31, 2015
Marvelous Inc.’s third-quarter results for the fiscal year ending March 31, 2015, demonstrate strong financial growth driven primarily by the company’s online game segment.
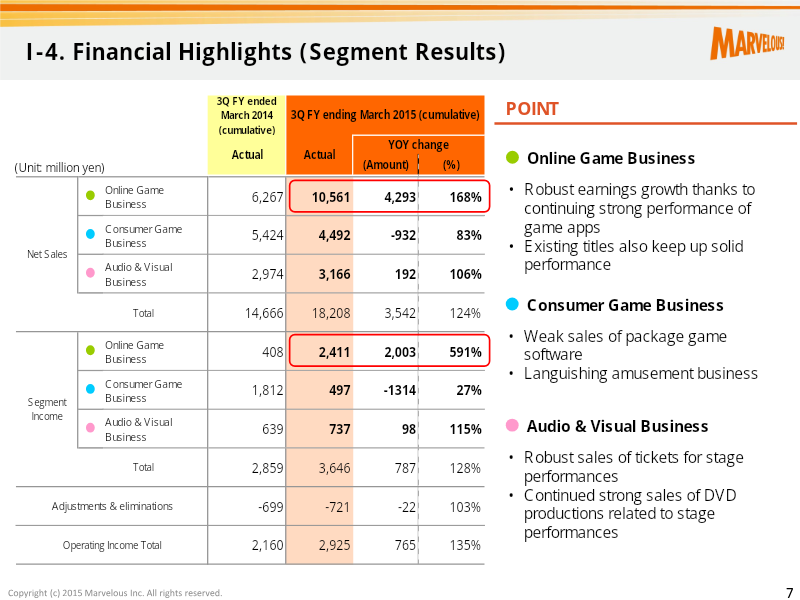
- Marvelous Inc. reported strong nine-month growth with net sales rising 24.2% to 18,208 million yen and operating income increasing 35.4% to 2,925 million yen.
- The online game segment drove overall performance, achieving a 168% increase in sales and a 591% surge in segment income year-over-year.
- The mobile title 'Logres of Swords and Sorcery: Goddess of Ancient' was the primary growth catalyst, surpassing 5 million cumulative downloads by December 2014.
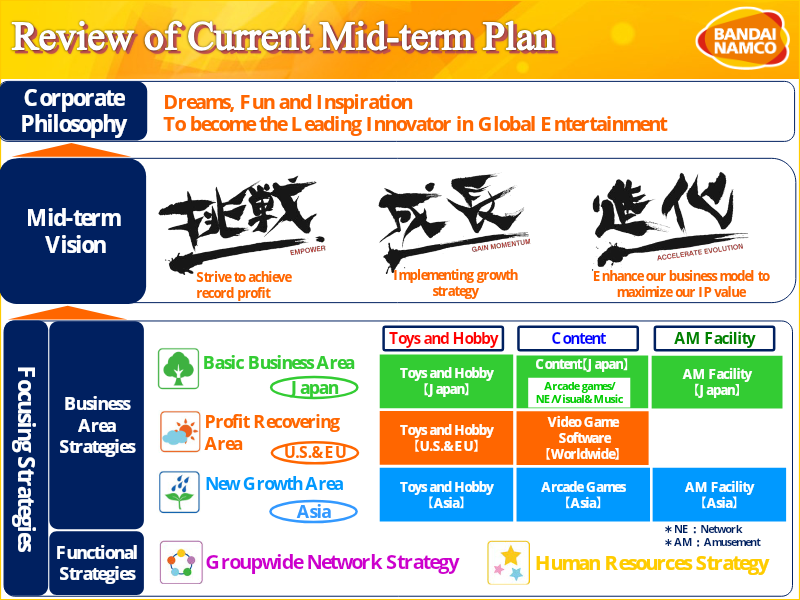
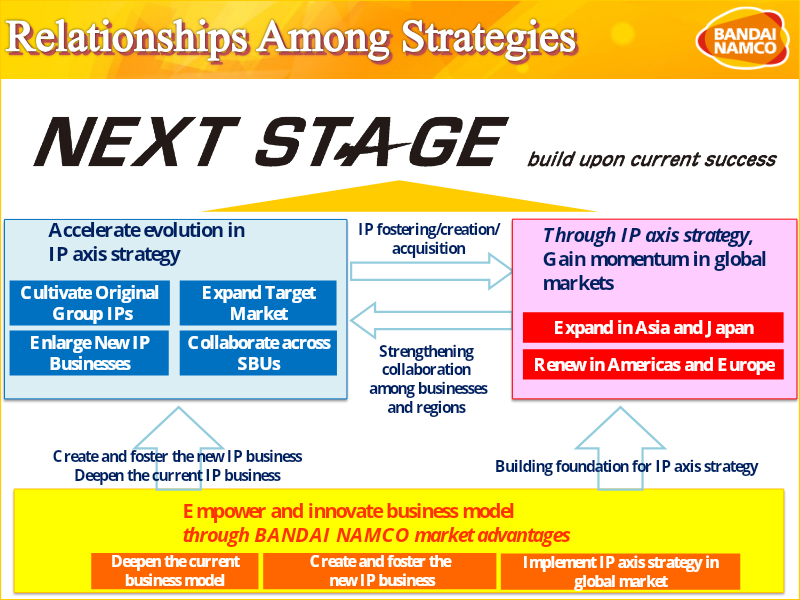

Bandai Namco Group Mid-term Plan: April 2015 to March 2018
The Bandai Namco Group’s mid-term plan for April 2015 through March 2018 outlines a strategic roadmap to transition the company into a leading global entertainment innovator.
- Bandai Namco targets 600 billion yen in net sales and 60 billion yen in operating income by the end of the 2018 fiscal year.
- The strategy prioritizes a return on equity (ROE) exceeding 10% and a 30% consolidated dividend payout ratio for shareholders.
- The company is shifting its focus toward global expansion, specifically targeting growth in Asia and a structural recovery in the Americas and Europe.
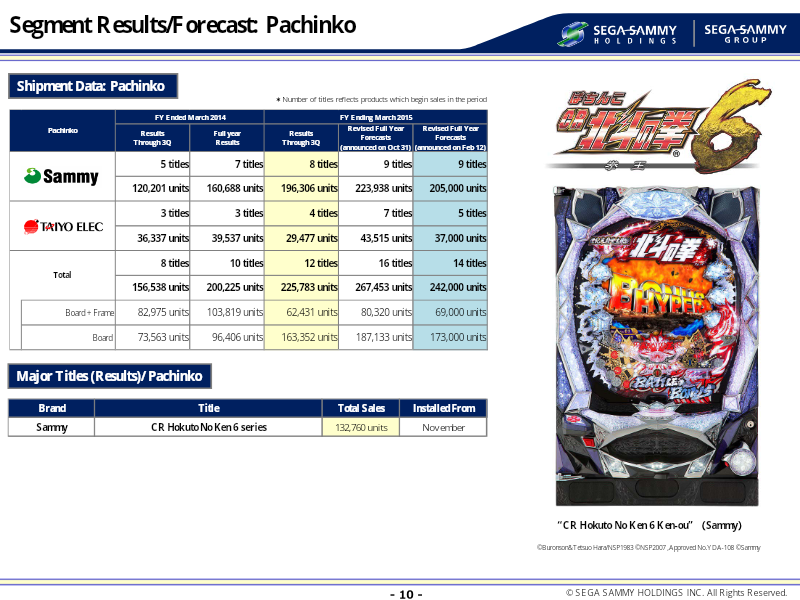
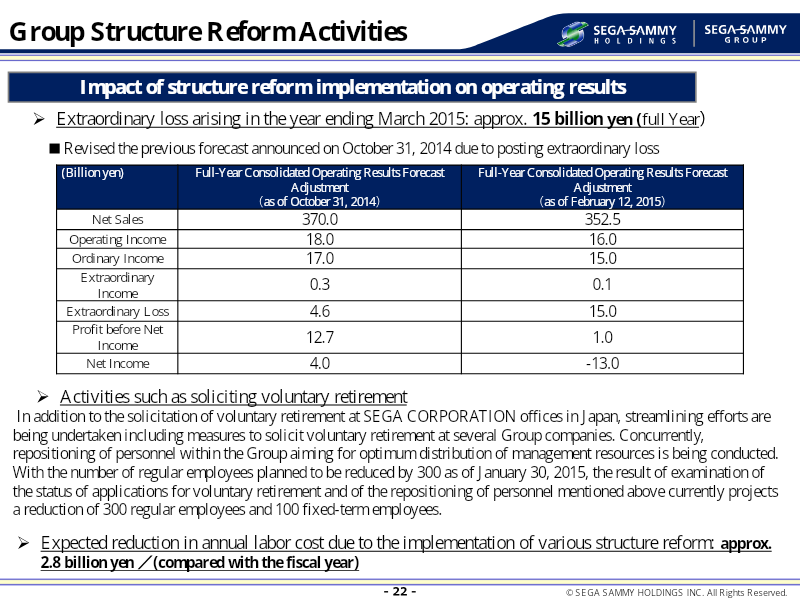
Sega Sammy Holdings FY Ending March 2015 3rd Quarter Results Presentation
Sega Sammy Holdings faced a period of significant financial contraction during the first three quarters of the fiscal year ending March 2015, characterized by a 12 percent decline in net sales and a 65 percent drop in operating income.
- Sega Sammy Holdings experienced a 12% decline in net sales and a 65% drop in operating income during the first three quarters of the fiscal year ending March 2015.
- The financial downturn was primarily caused by a sharp reduction in pachislot unit sales and the underperformance of domestic packaged games.
- To address losses, the company initiated a structural reform program involving a 400-employee workforce reduction and business group consolidation.
KLab FY2014 Financial Results
KLab Inc.’s fiscal year 2014 financial results demonstrate a successful transition to a native mobile gaming business model, characterized by a return to profitability and significant revenue growth.
- KLab achieved a full-year revenue of 21.37 billion yen in FY2014, a 35.8% year-over-year increase, and returned to profitability with an operating profit of 2.16 billion yen.
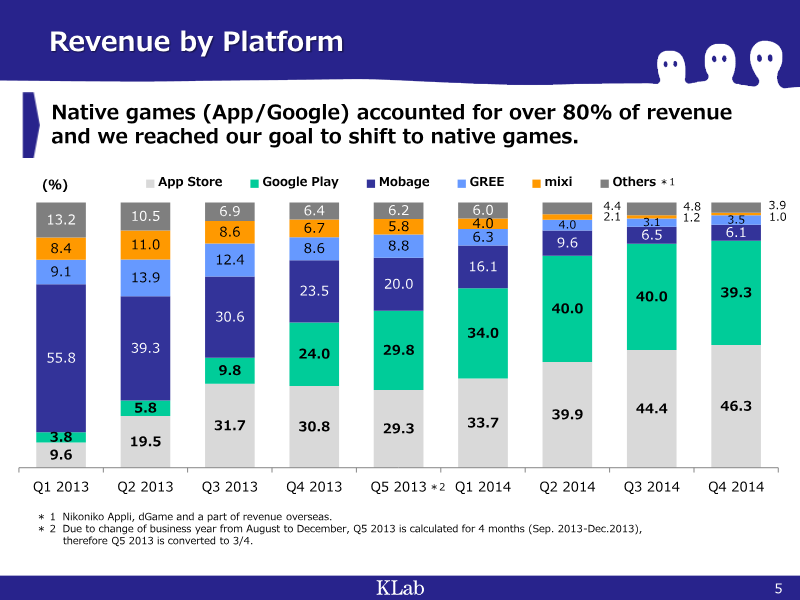
- The company's pivot to a native mobile gaming model was successful, with these applications now generating over 80% of total revenue.
- Profitability was supported by aggressive cost-cutting, specifically a 15.8% reduction in headcount and a 73.4% decrease in outsourcing costs compared to 2013 peaks.



Nippon Ichi Software: Q3 2015 Quarterly Report
Nippon Ichi Software’s third-quarter report for the fiscal year ending March 2015 provides a comprehensive overview of the company’s financial performance and operational status for the period spanning April 1, 2014, to December 31, 2014.
- Nippon Ichi Software experienced a significant decline in profitability for the first three quarters of the fiscal year ending March 2015, with operating profit falling 59.3% to 194,911 thousand yen and net profit dropping 73.8% to 104,529 thousand yen.
- Consolidated net sales for the period of April 1, 2014, to December 31, 2014, totaled 2,740,929 thousand yen, a 1.3% decrease compared to the same period in the previous fiscal year.
- The online business segment, driven by downloadable content, was the company's most profitable division, generating 588,335 thousand yen in sales and 337,246 thousand yen in operating profit.
Bandai Namco Holdings: Financial Highlights for the Third Quarter of the Fiscal Year Ending March 2015
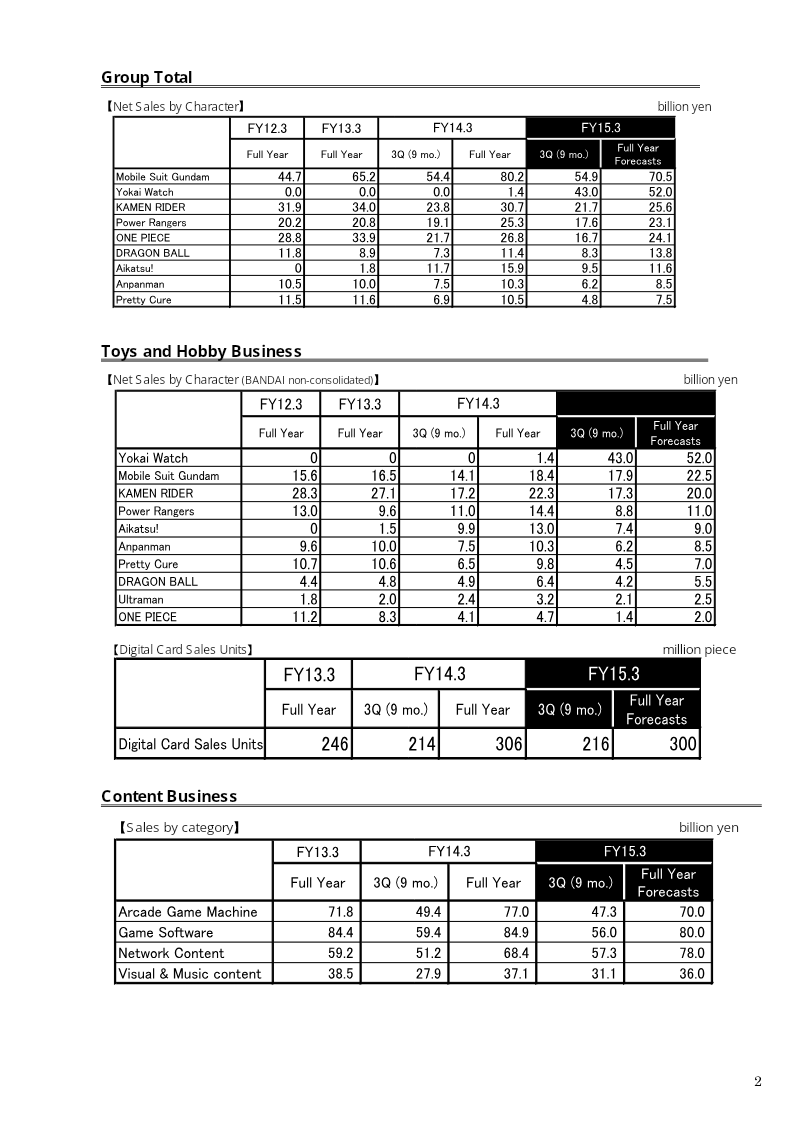
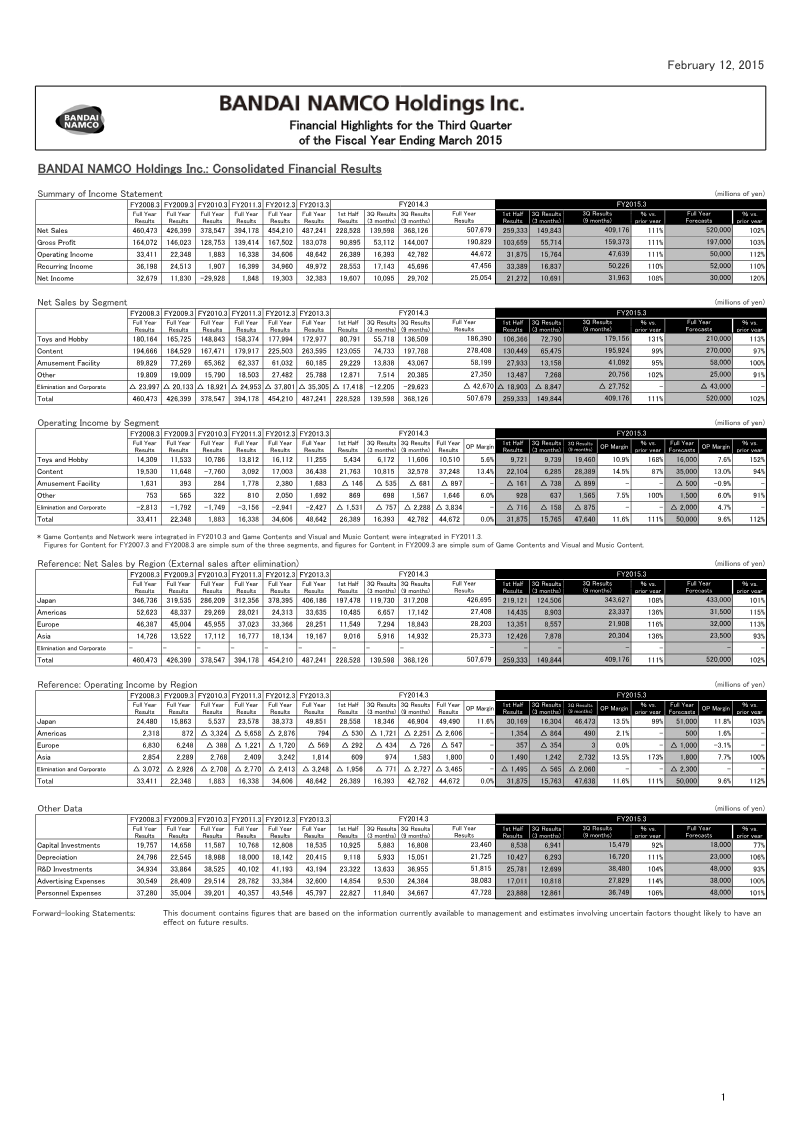
Bandai Namco Holdings’ financial results for the third quarter of the fiscal year ending March 2015 demonstrate sustained growth, with consolidated net sales reaching 409.176 billion yen, representing an 11% increase compared to the same period in the previous year.
- Bandai Namco Holdings achieved consolidated net sales of 409.176 billion yen and an operating income of 47.639 billion yen for the first nine months of the fiscal year ending March 2015, both marking an 11% year-over-year increase.
- The Toys and Hobby segment was the primary growth driver, with sales rising 31% to 179.156 billion yen, largely fueled by 43 billion yen in revenue from the Yokai Watch franchise.
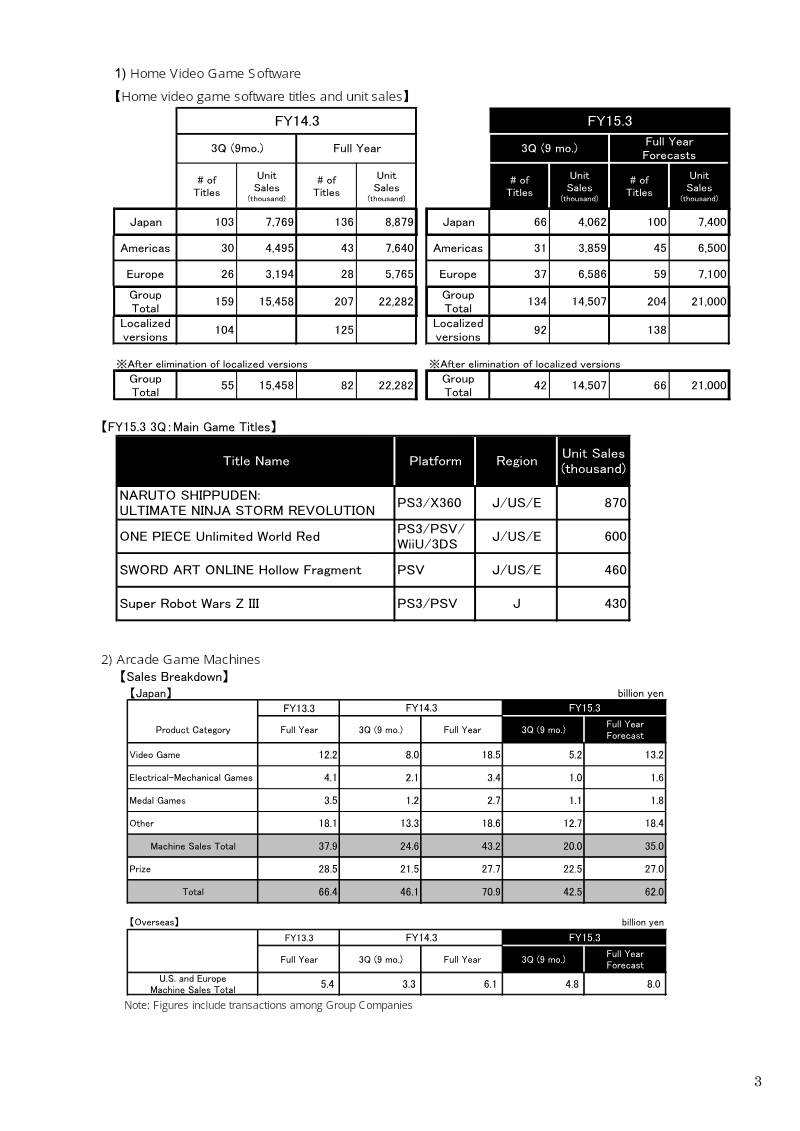
- The Content segment, encompassing home video games and network content, remained stable but saw a slight 1% decline in sales to 195.924 billion yen.
NEXON Q4 2014 Earnings Call
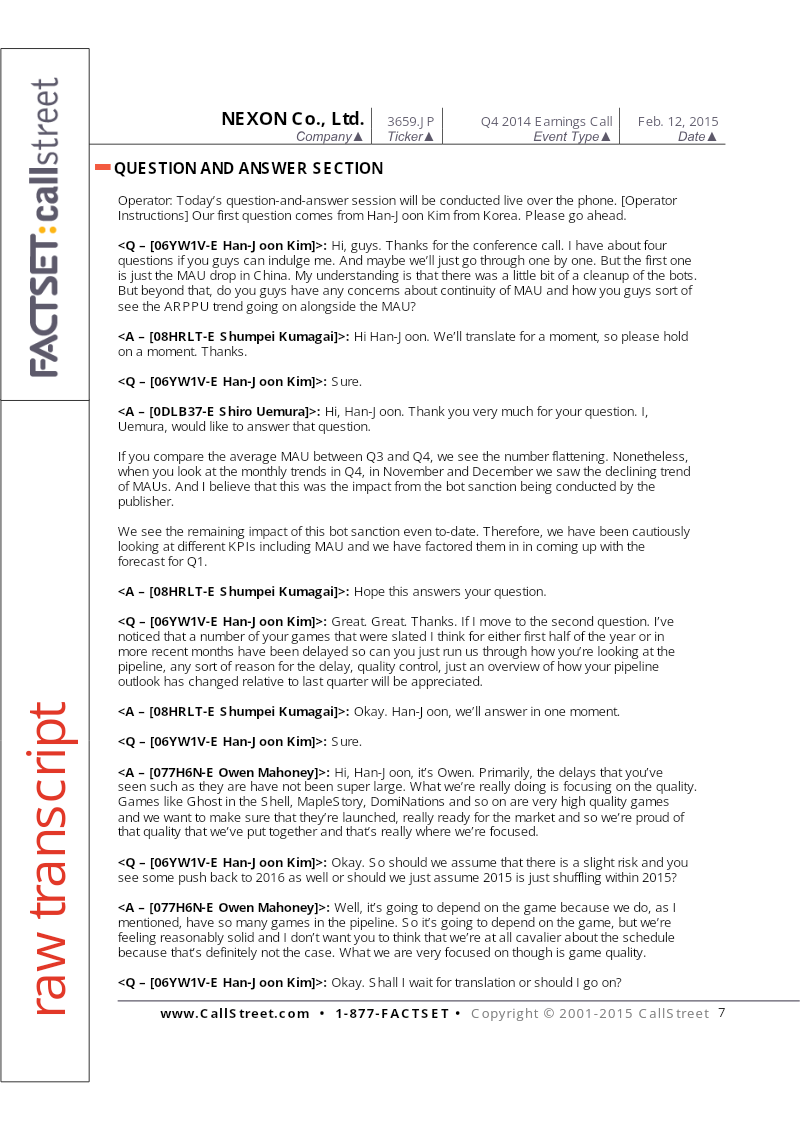
Nexon achieved full-year 2014 revenues of ¥172.9 billion, representing an 11% year-over-year increase fueled by robust performance in the Chinese and Korean markets.
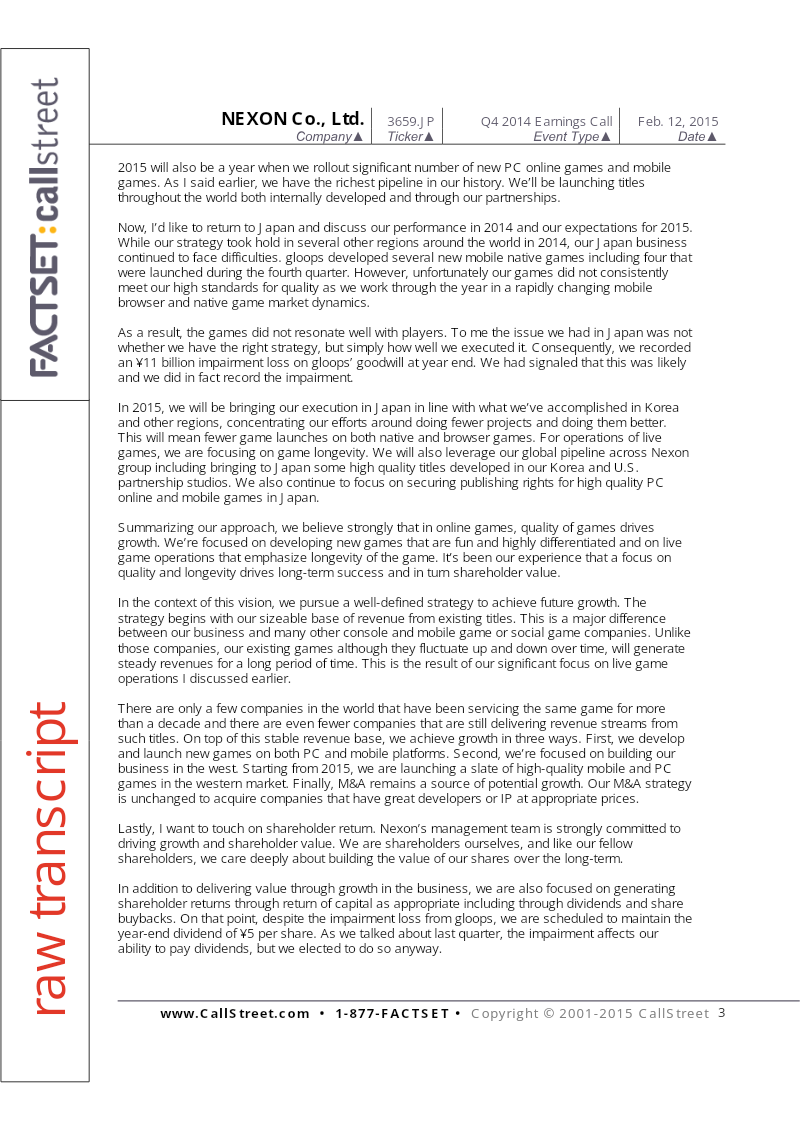
- Nexon reported 2014 full-year revenue of ¥172.9 billion, an 11% year-over-year increase, though operating income fell 10% to ¥45.5 billion due to an ¥11 billion impairment loss from its subsidiary gloops.
- Management is shifting strategy from aggressive release schedules to a focus on game quality and long-term title longevity to stabilize its PC and mobile portfolio.
- Operating margins face downward pressure in 2015 due to rising royalty costs, increased human resource spending, and a strategic pivot toward lower-margin mobile and Korean business segments.
Nexon Fourth Quarter and Full Year 2014 Results
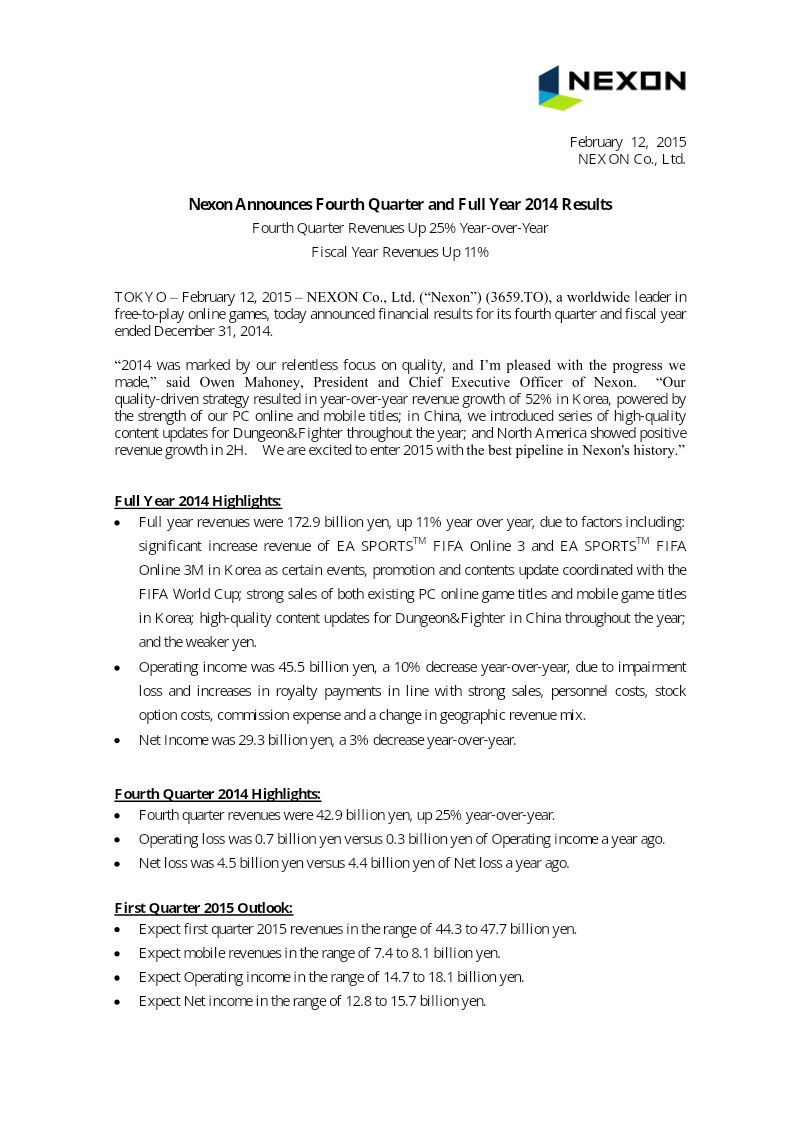
Nexon’s financial performance for the 2014 fiscal year demonstrates a strategic pivot toward high-quality content, resulting in an 11% year-over-year revenue increase to 172.9 billion yen.
- Nexon achieved a 11% year-over-year revenue increase to 172.9 billion yen for the 2014 fiscal year, driven by strong performance in Korea and China.
- Despite annual revenue growth, operating income fell 10% to 45.5 billion yen and net income dropped 3% to 29.3 billion yen due to higher royalty, personnel, and commission costs.
- The fourth quarter of 2014 saw a 25% year-over-year revenue surge to 42.9 billion yen, yet the company recorded an operating loss of 0.7 billion yen and a net loss of 4.5 billion yen.