2015
Company
Documents about 2015
Reference Materials: Three-Month Period Ended June 30, 2015
Square Enix Holdings Co., Ltd. reported strong financial growth for the three-month period ending June 30, 2015, characterized by significant increases in both net sales and operating income compared to the same period in the previous year.
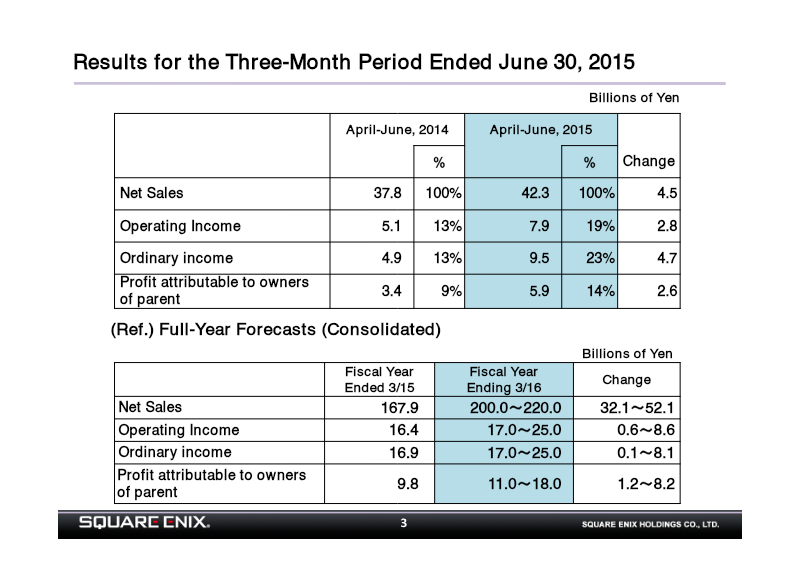
- Square Enix reported a strong start to the fiscal year ending March 31, 2016, with net sales increasing to 42.3 billion yen and operating income rising to 7.9 billion yen for the quarter ended June 30, 2015.
- The Digital Entertainment segment was the primary growth driver, with net sales increasing by 6.8 billion yen and operating income nearly doubling to 8.2 billion yen compared to the same period in 2014.
- Operating margins for the Digital Entertainment segment improved significantly, rising from 19.2% in the April-June 2014 quarter to 27.0% in the April-June 2015 quarter.
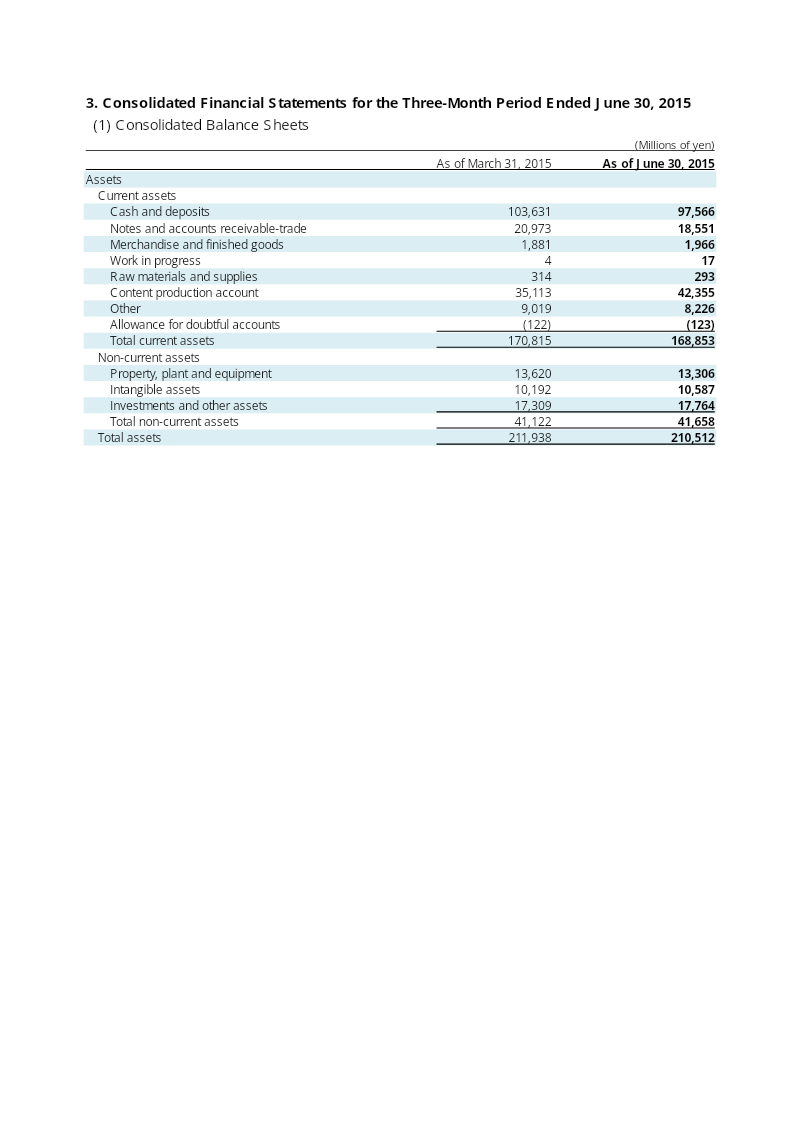
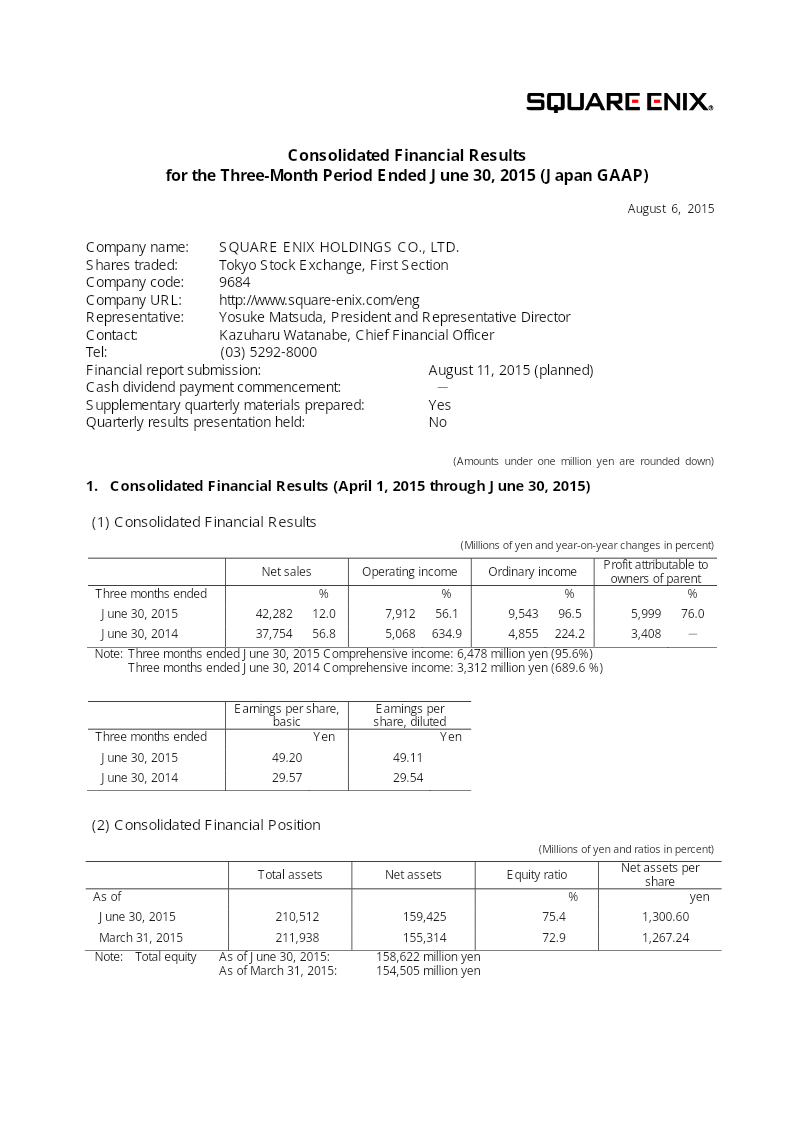
Consolidated Financial Results for the Three-Month Period Ended June 30, 2015: Square Enix Holdings
Square Enix Holdings reported strong financial growth for the three-month period ending June 30, 2015, driven primarily by the robust performance of its Digital Entertainment segment.
- Square Enix reported strong Q1 growth for the period ending June 30, 2015, with net sales reaching ¥42,282 million (up 12.0% YoY) and operating income rising 56.1% to ¥7,912 million.
- The Digital Entertainment segment, the company's primary revenue driver, saw net sales increase 29.2% to ¥30,297 million and operating income jump 81.6% to ¥8,191 million.
- Digital Entertainment growth was fueled by strong performance in smartphone and PC browser titles like 'DRAGON QUEST MONSTERS SUPER LIGHT' and 'FINAL FANTASY RECORD KEEPER,' alongside steady results from 'FINAL FANTASY XIV' and 'DRAGON QUEST X'.


FY2015 Fourth Quarter Financial Results
GREE concluded fiscal year 2015 with net sales of ¥92.5 billion and an operating income of ¥20.2 billion, though the bottom line was impacted by a net loss of ¥10.3 billion.
- GREE reported a net loss of ¥10.3 billion for FY2015, primarily driven by a ¥14.2 billion goodwill impairment charge related to its North American subsidiary, Funzio.
- Net sales for FY2015 reached ¥92.5 billion with an operating income of ¥20.2 billion, supported by a 16% reduction in fixed costs.
- Quarter-over-quarter coin consumption fell 11% to 27.9 billion, reflecting weakening performance in legacy web games and international markets.


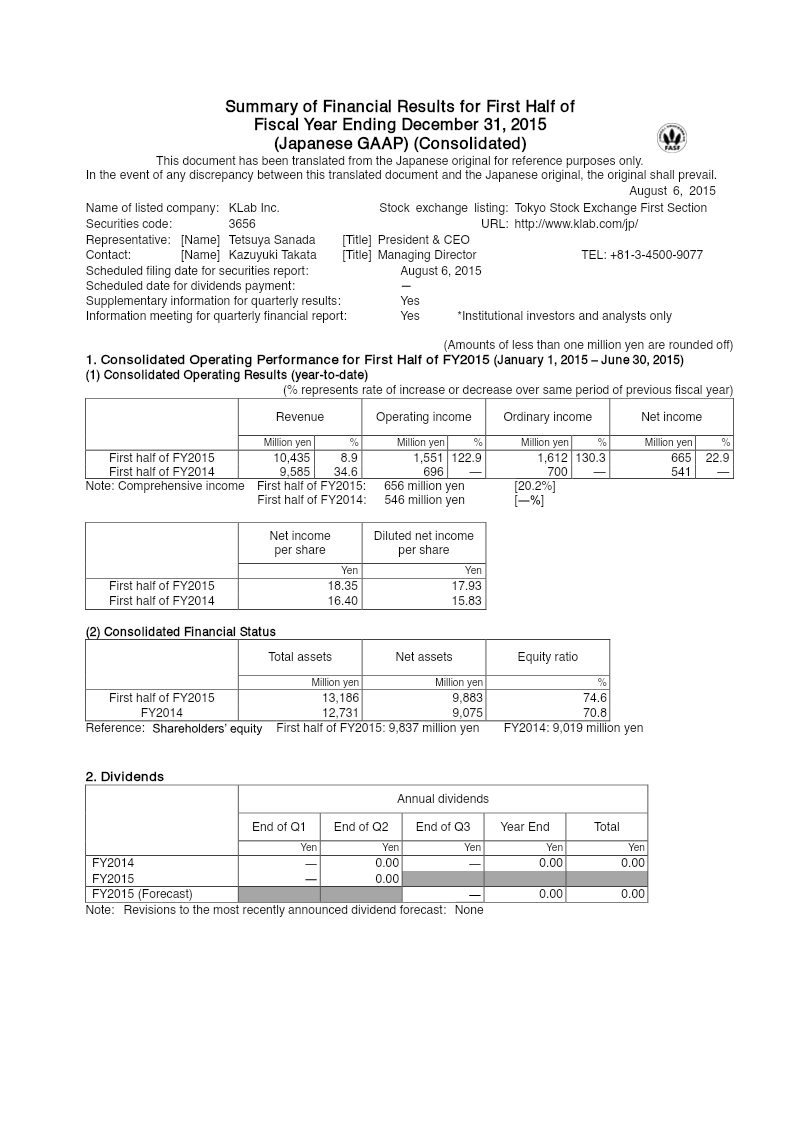
Summary of Financial Results for First Half of Fiscal Year Ending December 31, 2015
This financial report details the consolidated operating performance of KLab Inc. for the first half of the fiscal year ending December 31, 2015.
- KLab Inc. reported a 122.9% surge in operating income to 1.55 billion yen and an 8.9% increase in total revenue to 10.4 billion yen for the first half of 2015.
- The company's primary revenue driver, the game business segment, experienced a 14.9% sequential revenue decline in the second quarter of 2015 due to lower sales of the flagship title Love Live! School Idol Festival.
- Net income for the first half of 2015 reached 665 million yen, marking a 22.9% year-over-year improvement.


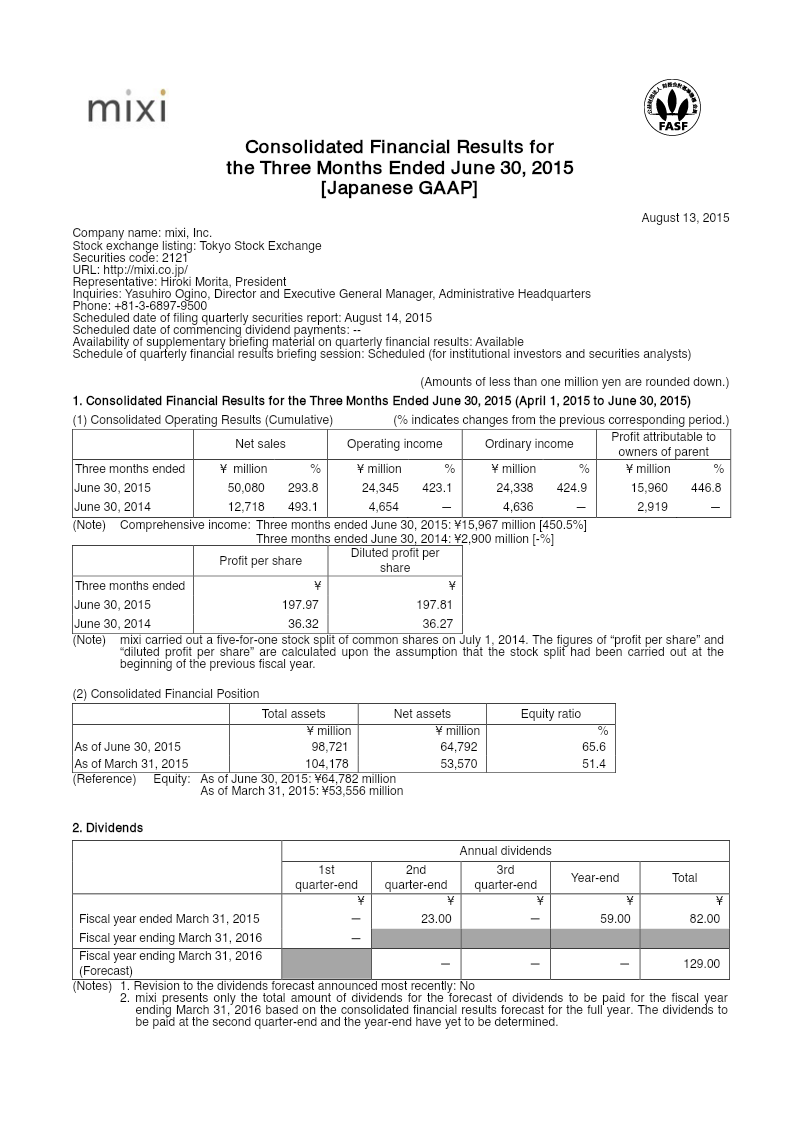
Consolidated Financial Results for the Three Months Ended June 30, 2015
This financial report details the consolidated results for mixi, Inc. during the first quarter of the fiscal year ending March 31, 2016, covering the period from April 1, 2015, to June 30, 2015.
- Mixi, Inc. experienced massive growth in Q1 of the fiscal year ending March 31, 2016, with net sales reaching ¥50,080 million, a 293.8% increase year-over-year.
- Operating income surged 423.1% to ¥24,345 million, while profit attributable to owners of the parent rose 446.8% to ¥15,960 million.
- The Entertainment Business, anchored by the flagship title Monster Strike, was the primary driver of success, generating ¥47,002 million in sales and ¥25,024 million in segment income.



Games Workshop Group PLC Annual Report 2015
Games Workshop's fiscal 2015 (year to 31 May 2015) was a year of consolidation after the prior year's continental European restructuring.
- Games Workshop reported a profit before taxation of £16.6 million on £119.1 million in revenue for fiscal year 2015, with net profit rising to £12.3 million from £8.0 million the previous year.
- The company maintained a debt-free balance sheet with £12.6 million in cash, supporting a dividend payout of 52 pence per share totaling £16.6 million.
- Total revenue declined by 3.5% due to currency headwinds and internal restructuring, with growth in North America failing to offset declines in the UK and Continental Europe.
Microsoft Form 10-K: FY2015
During fiscal year 2015, Microsoft executed a fundamental strategic pivot toward a mobile-first, cloud-first business model.
- Microsoft recorded a $7.5 billion impairment charge in Q4 2015 related to its Phone Hardware business, which was primarily formed following the acquisition of Nokia's Devices and Services (NDS) business on April 25, 2014.
- Research and development expenses increased by $665 million (6%) in fiscal year 2015, driven largely by $739 million in expenses associated with the NDS business.
- As of June 30, 2015, Microsoft had $21.9 billion remaining of the $40.0 billion share repurchase program authorized by the Board of Directors in September 2013.
Aiming FY2015 Q2 Financial Results
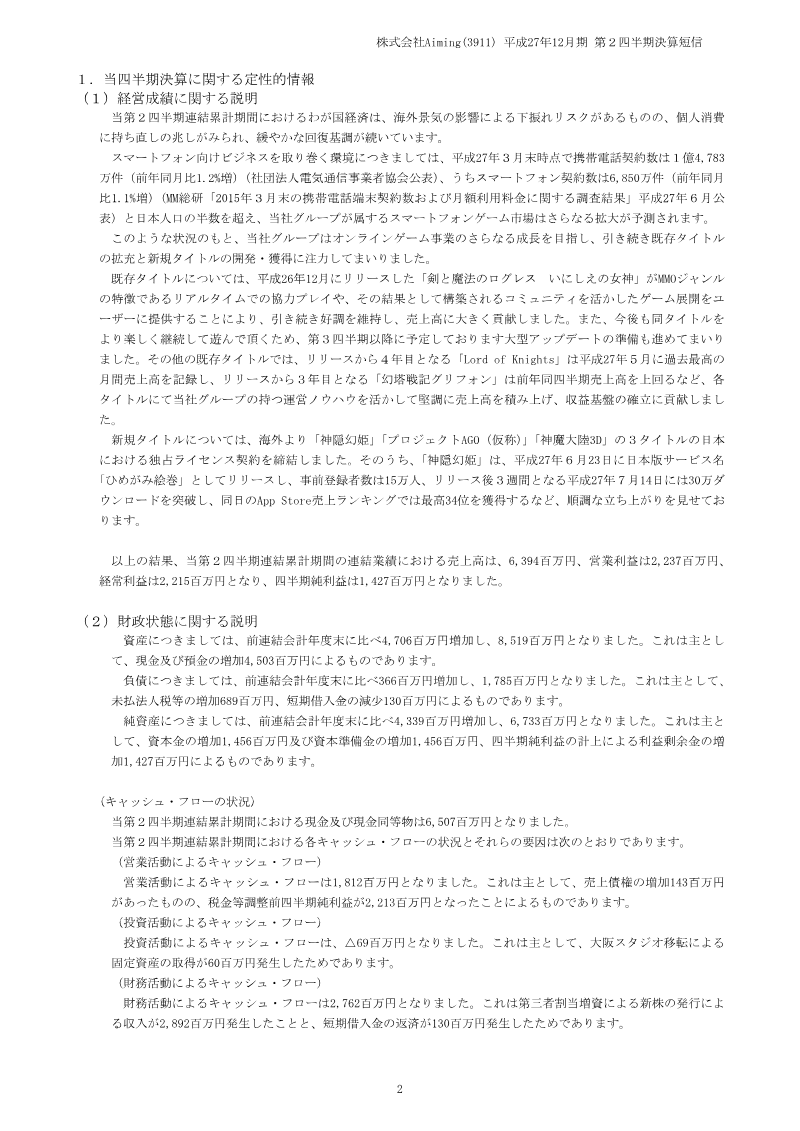
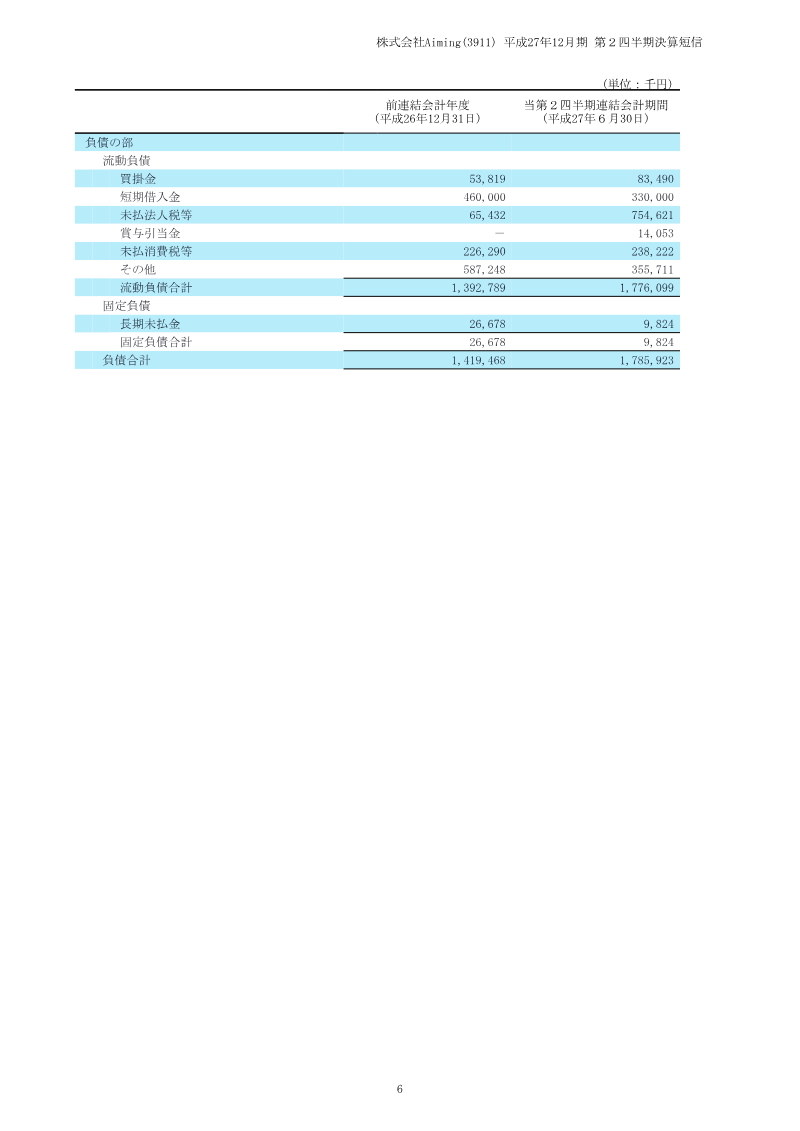
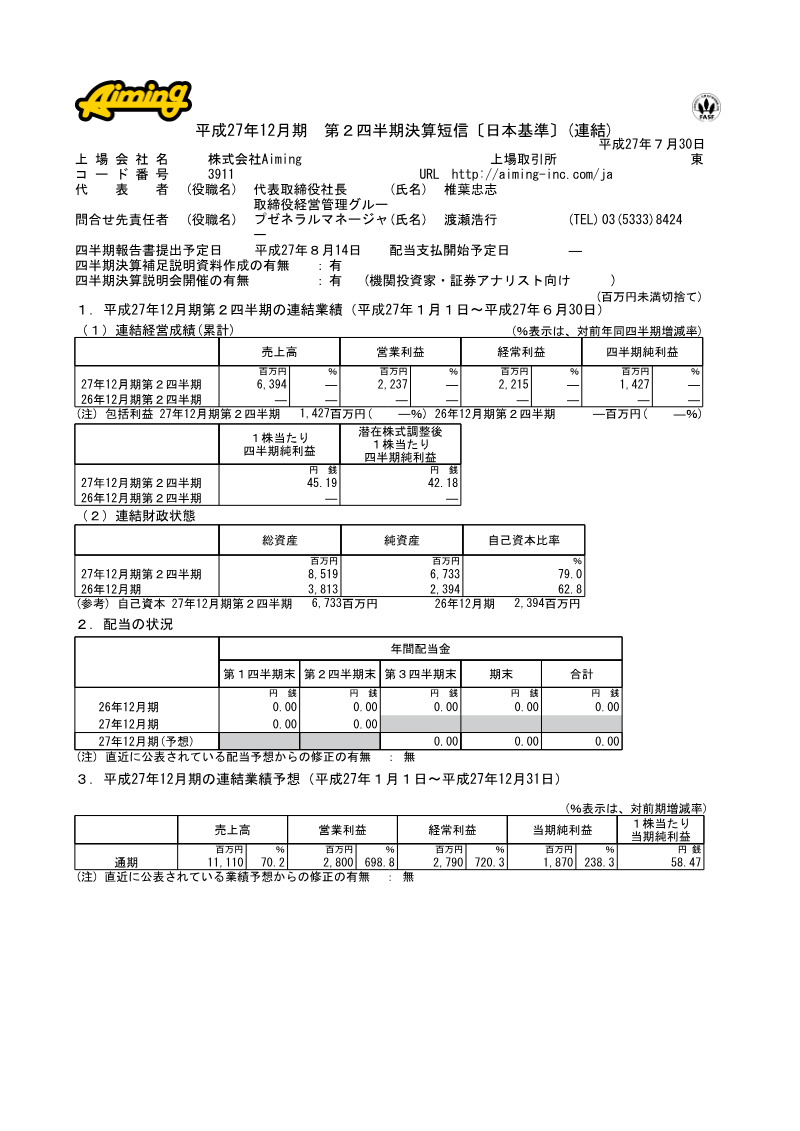
Aiming’s financial results for the second quarter of the fiscal year ending December 2015 demonstrate robust growth driven by the company’s core online game business.
- Aiming reported strong Q2 FY2015 financial results (January 1 to June 30, 2015), with 6.39 billion yen in revenue, 2.24 billion yen in operating profit, and 1.43 billion yen in net profit.
- The success was primarily driven by existing titles, particularly the MMO "Logres of Swords and Sorcery: Ancient Goddess," and older titles like "Lord of Knights," which achieved record monthly sales in May 2015.
- Aiming successfully launched "Himegami Emaki" in June 2015, reaching over 300,000 downloads within three weeks.
Capcom 1st Quarter Report: Fiscal Year Ending March 31, 2016
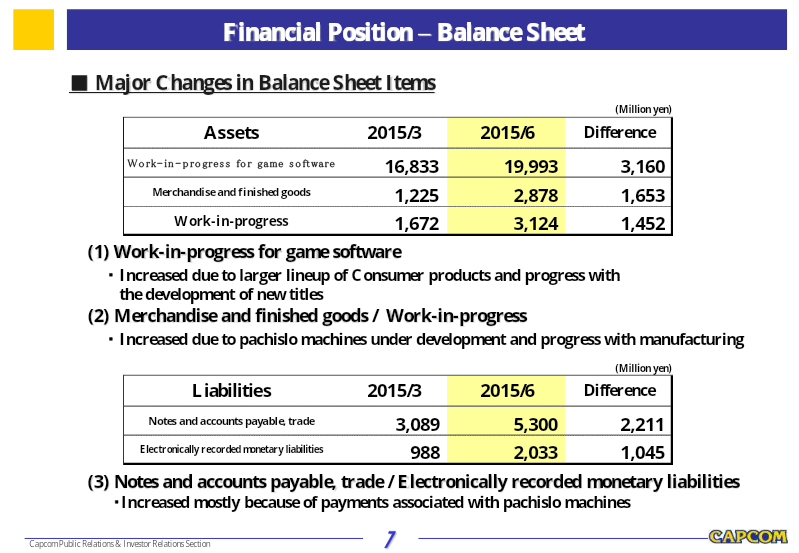
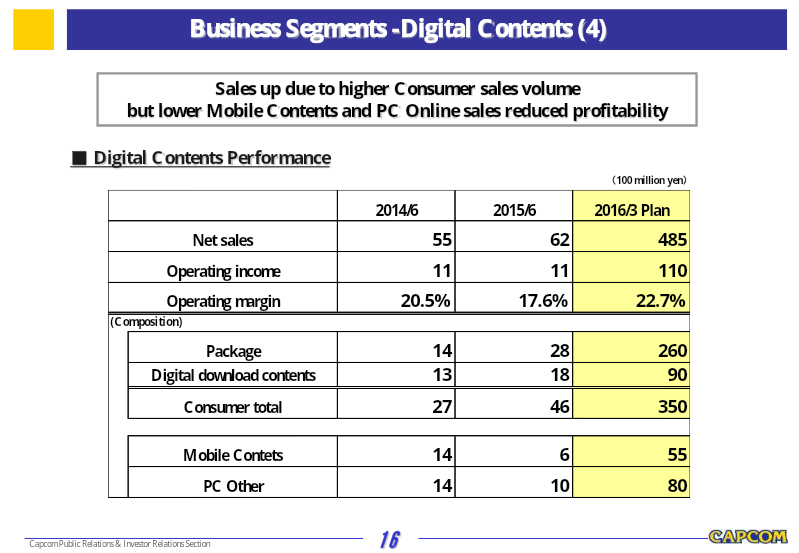
The first quarter report for the fiscal year ending March 31, 2016, outlines Capcom’s financial performance and strategic outlook, highlighting a period of growth driven by strong repeat sales in the consumer segment and successful performance in the amusement equipment business.
- Capcom reported net sales of 14.5 billion yen for the quarter ending June 30, 2015, a significant increase from 9.6 billion yen during the same period in 2014.
- Operating income grew to 2.0 billion yen from 1.3 billion yen, driven by strong repeat sales of consumer titles like Monster Hunter 4 Ultimate and the launch of the Resident Evil 6 pachislo machine.
- Digital distribution has become a primary revenue driver, with full-game digital download units surpassing physical package sales for the first time during this quarter.
Consolidated Results for the Three Months Ended June 2014 and 2015: Nintendo
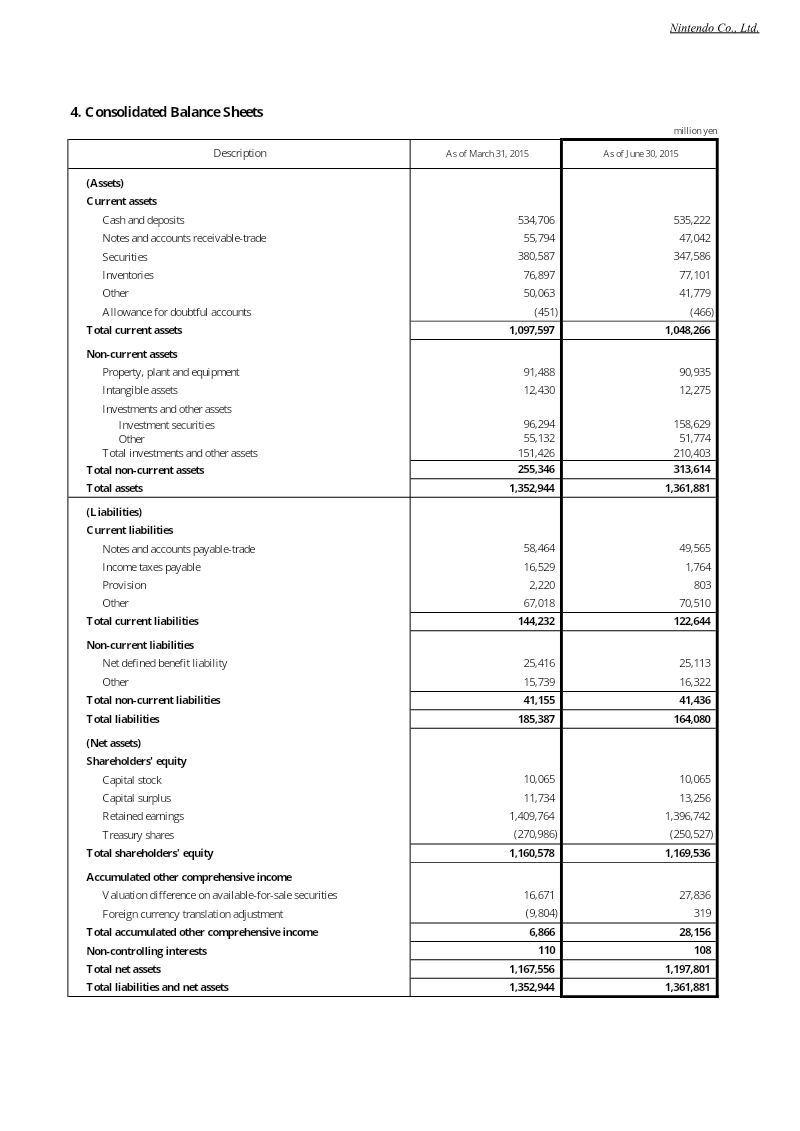
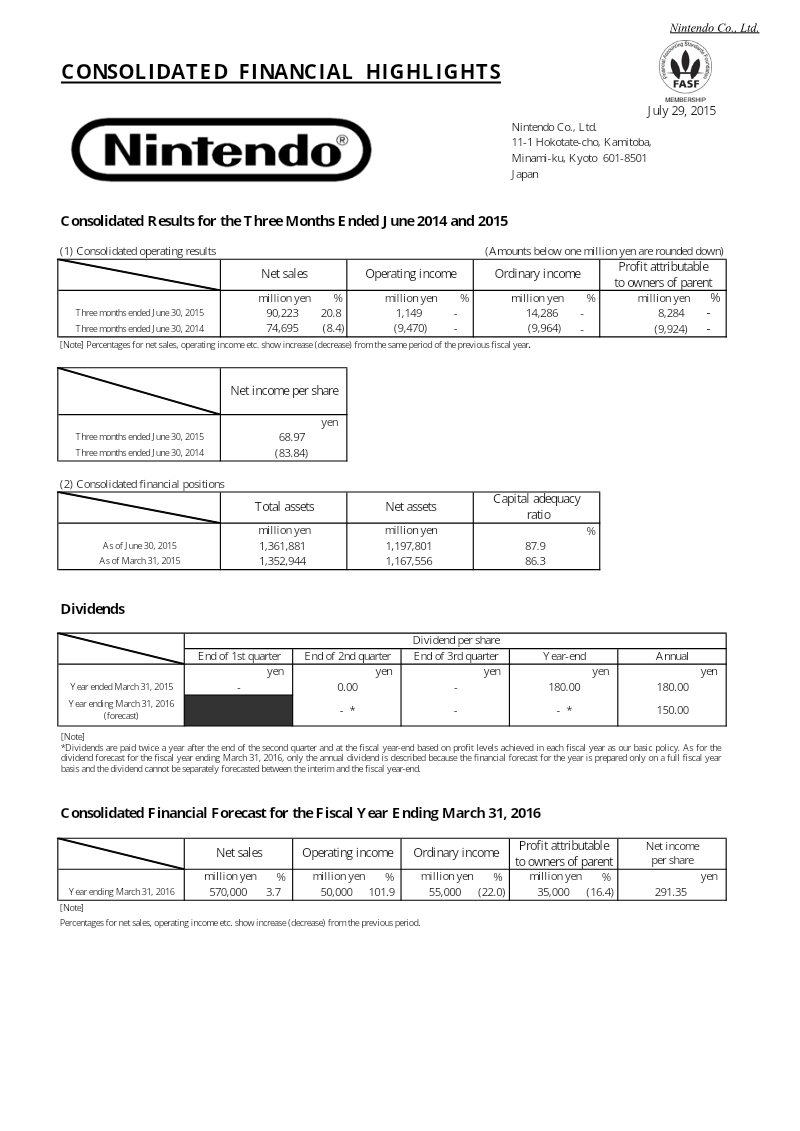
Nintendo’s consolidated financial results for the three months ended June 30, 2015, reflect a return to profitability compared to the same period in the previous year.
- Nintendo returned to profitability in Q1 2015, reporting an operating income of 1.1 billion yen compared to a 9.5 billion yen operating loss in the same period of 2014.
- Net sales for the quarter reached 90.2 billion yen, a 20.8% increase year-over-year, with 72.1% of total revenue generated in overseas markets.
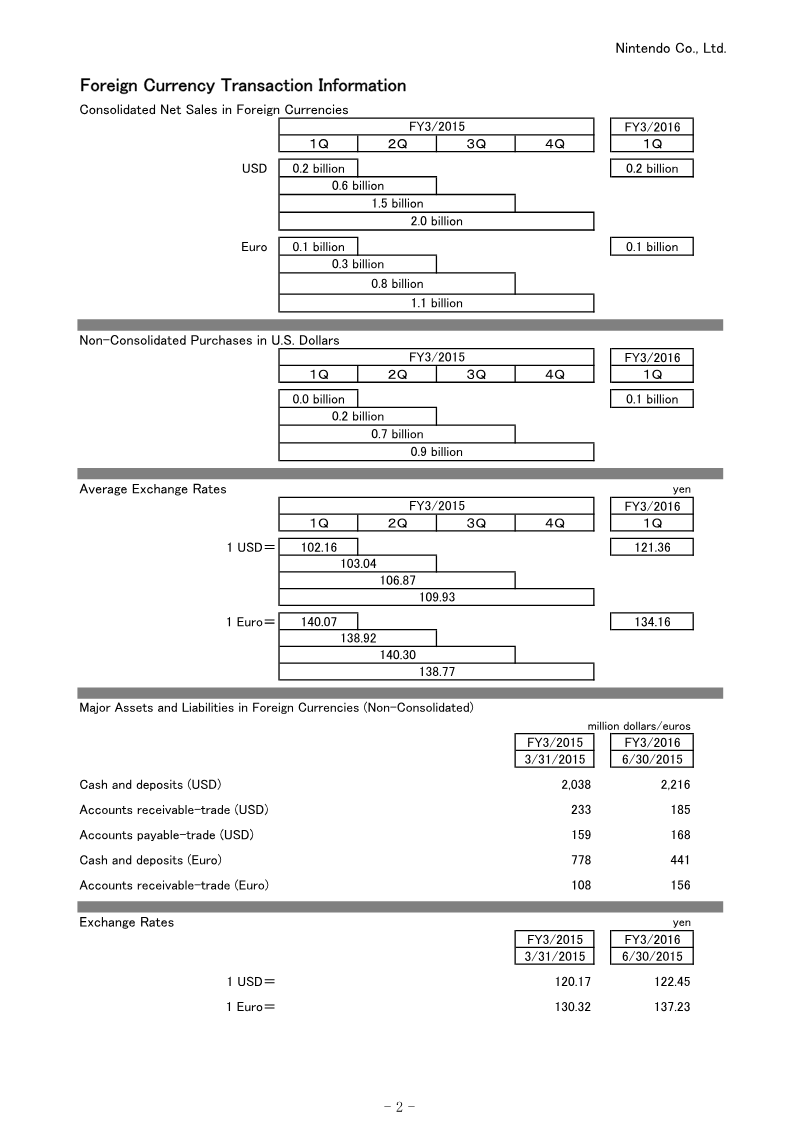
- Profit attributable to owners of the parent was 8.2 billion yen, supported by 10.8 billion yen in foreign exchange gains due to the depreciation of the yen.
Nintendo Earnings Release: Supplementary Information (June 2015)
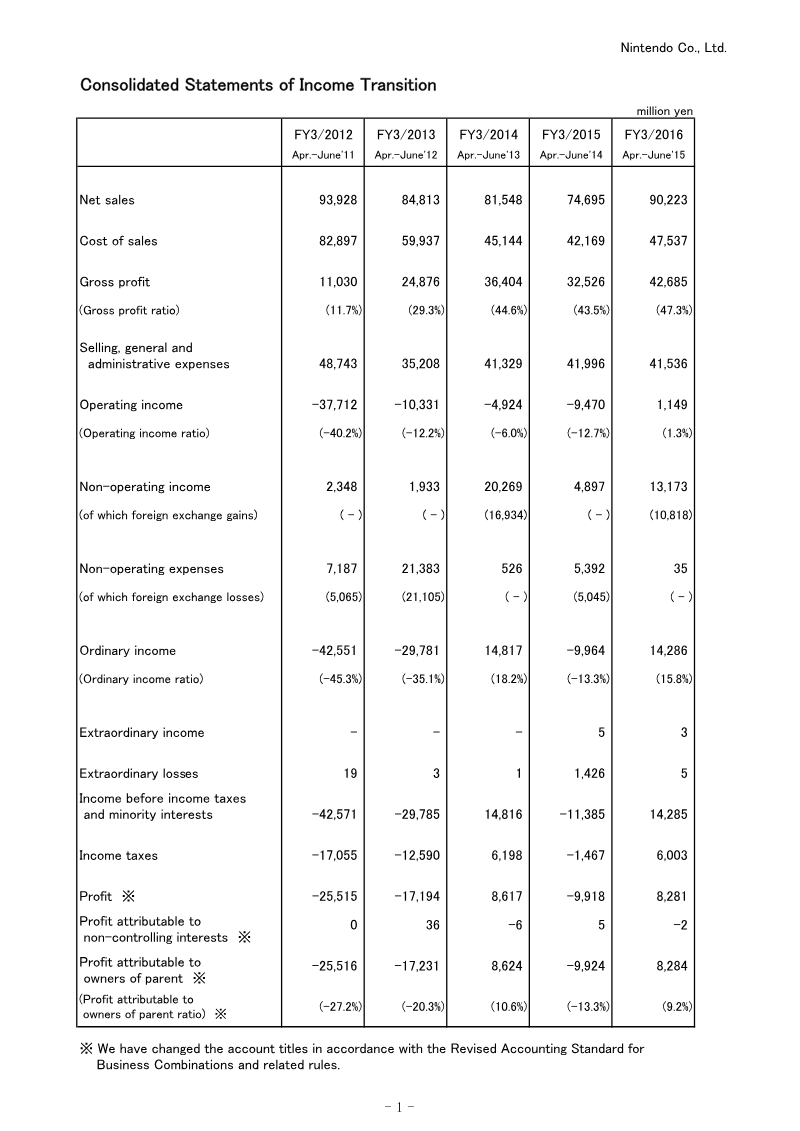
This financial summary details Nintendo’s consolidated earnings for the first quarter of the fiscal year ending March 2016, covering the period from April to June 2015.
- Nintendo returned to profitability in the April–June 2015 quarter, posting net sales of 90.2 billion yen and operating income of 1.1 billion yen, versus an operating loss of 9.5 billion yen a year earlier.
- Gross profit reached 42.7 billion yen, a gross profit ratio of 47.3%.
- Ordinary income of 14.3 billion yen was boosted by 13.2 billion yen in non-operating income, largely attributed to favorable foreign exchange gains, and profit attributable to owners of the parent was 8.3 billion yen.
GungHo Online Entertainment FY2015 Q2 Financial Results
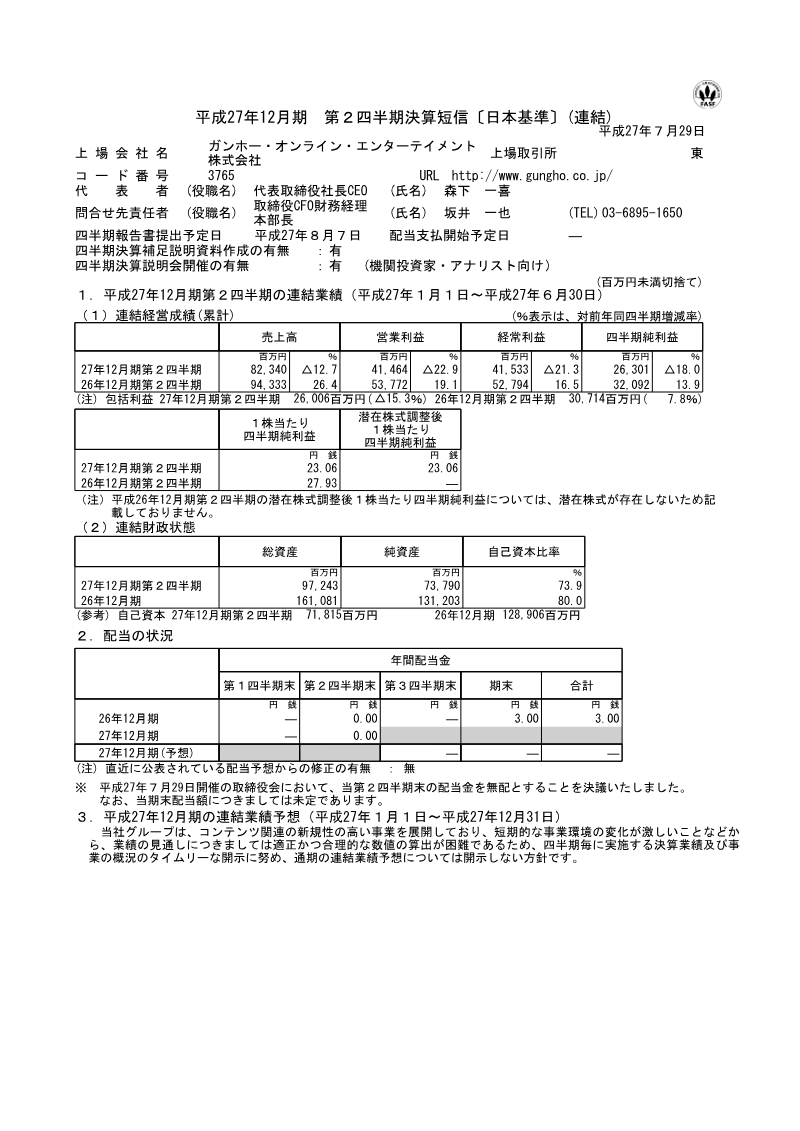
GungHo Online Entertainment’s financial results for the second quarter of the fiscal year ending December 2015 reflect a period of contraction compared to the previous year.
- Net sales fell 12.7% year-over-year to 82.34 billion yen in the second quarter of FY2015, with operating profit down 22.9% to 41.46 billion yen and quarterly net profit down 18.0% to 26.30 billion yen.
- The decline was driven mainly by falling short-term monetization of the flagship mobile puzzle RPG Puzzle & Dragons, which was entering its fourth year of operation.
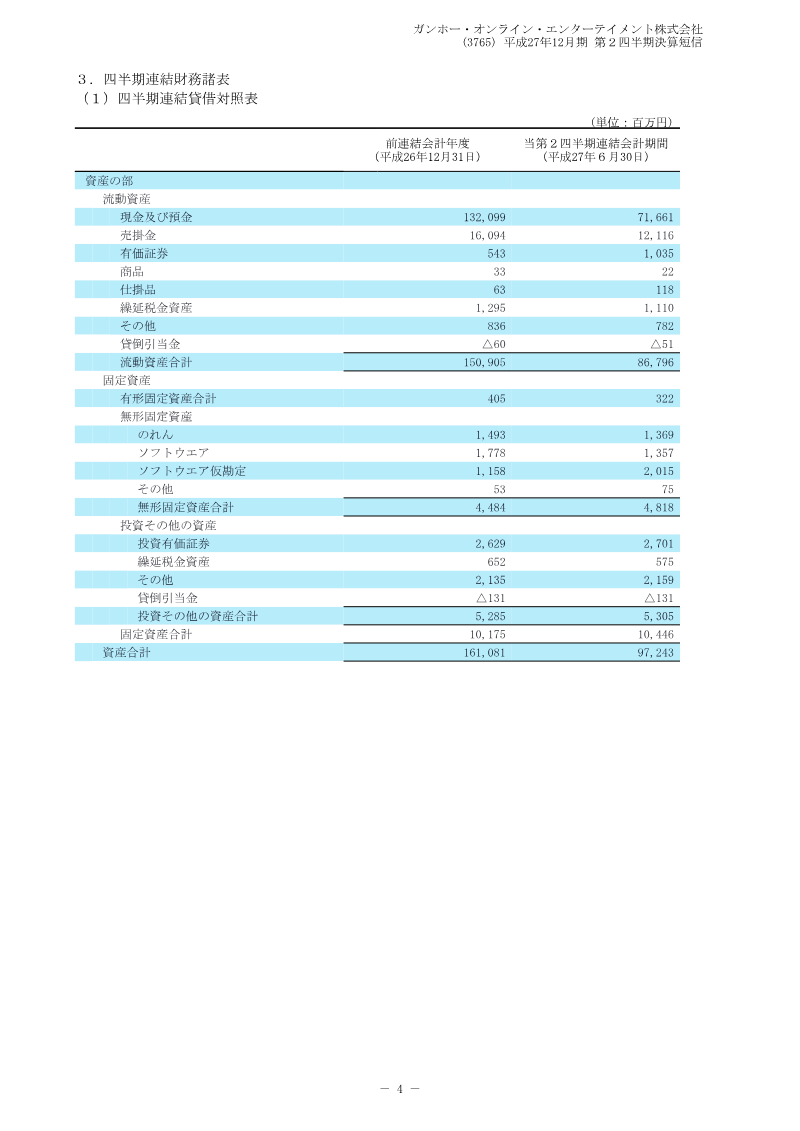
- A large-scale share buyback, including treasury stock acquired from SoftBank, cost 79.99 billion yen and cut cash and deposits by 60.44 billion yen, bringing total assets down to 97.24 billion yen.