Player Demographics
Documents
Level Up: A Guide to Succeed in Asia’s Gaming Market
Asia has established itself as the epicenter of the global gaming industry, driven by a mobile-first population exceeding 1.5 billion players. The region’s market is characterized by the dominance of free-to-play models, which account for nearly 99% of mobile revenue and all top-grossing titles. While China and Japan lead in total revenue, Japan maintains the highest value per user with an average revenue per download of $12.84. Growth is increasingly fueled by the female demographic, which expanded to 500 million players by 2019 and contributes nearly 40% of total mobile gaming revenue. This shift necessitates more inclusive storylines and diverse development teams to capture a demographic that is currently outgrowing its male counterpart.
The competitive landscape is defined by the rapid ascent of mobile esports, with Asia generating 68% of the sector's global revenue. Southeast Asia, in particular, has seen a 244% increase in tournament prize pools, signaling a transition from casual play toward complex, competitive genres like MOBAs and Battle Royales. Despite high interest, a significant gap remains between esports viewership and active participation, representing a massive untapped opportunity for developers. Success in these markets requires sophisticated monetization strategies, such as hybrid models combining gacha mechanics, battle passes, and rewarded video ads to accommodate varying income levels across the territory.
Navigating the Asian market demands deep localization that extends beyond language to include cultural customs, religious sensitivities, and technical optimization for diverse hardware. While Japan and South Korea remain dominated by local developers and legacy RPG franchises, India and Southeast Asia offer high-growth potential for international titles that provide "lite" versions for accessible play. To achieve long-term engagement, developers must leverage local influencers and community-driven gameplay, ensuring that titles resonate with the specific pop culture trends and infrastructure capabilities of each unique sub-region.
- Asia’s gaming market is driven by over 1.5 billion mobile-first players, with free-to-play models generating 99% of mobile revenue.
- The female demographic has grown to 500 million players and now contributes nearly 40% of total mobile gaming revenue, necessitating more inclusive content.
- Asia accounts for 68% of global mobile esports revenue, with Southeast Asia experiencing a 244% increase in tournament prize pools.
- Japan leads the region in monetization efficiency, maintaining the highest average revenue per download at $12.84.
- Developers should implement hybrid monetization strategies—combining gacha, battle passes, and rewarded video ads—to address varying income levels across the region.
For the Win: Breaking Down the Preferences of Asia's Mobile Gamers
Asia represents the world’s most significant mobile gaming hub, housing over half of the global player base and generating the majority of the industry's mobile revenue. The primary objective of this analysis is to examine the distinct player preferences, cultural influences, and market regulations across five key regions: China, Japan, South Korea, India, and Southeast Asia. By evaluating top-grossing titles and genre shifts through the first half of 2020, the findings illustrate a broader regional transition from casual play toward complex, competitive, and socially-driven experiences.
China remains the largest market, characterized by the successful migration of PC intellectual properties to mobile and a regulatory environment that necessitates domestic partnerships. In contrast, Japan’s market is defined by a deep-rooted console history and the pervasive influence of anime and manga aesthetics, with RPGs accounting for nearly half of its mobile revenue. South Korea leverages its robust 5G infrastructure and "PC bang" culture to sustain a market dominated by high-fidelity MMORPGs. Meanwhile, India and Southeast Asia emerge as high-growth regions where young populations and increasing smartphone accessibility are fueling a massive surge in mobile esports and battle royale titles.
The data reveals that localization involves more than translation; it requires integrating local folklore, respecting religious customs, and optimizing for hardware constraints. For instance, "lite" versions of games are essential for market penetration in India, while community-centric features are vital for success in Southeast Asia. Across all regions, the rise of mobile esports is a dominant trend, with competitive titles increasingly displacing traditional genres in the top-grossing charts.
The methodology utilizes data from Niko Partners, incorporating market models, five-year forecasts, and qualitative surveys from a panel of millions of consumers across Asia. The analysis covers the period from 2016 through June 2020, drawing on data from retailers, app markets, and interviews with industry executives to provide a comprehensive view of the mobile landscape.
- Asia accounts for over 50% of the global mobile gaming player base and generates the majority of the industry's total mobile revenue.
- Mobile esports and competitive, socially-driven titles are displacing traditional genres across all Asian markets, marking a major shift in consumer preference through the first half of 2020.
- China remains the largest market, where success is driven by migrating PC intellectual properties to mobile and navigating a regulatory environment that requires domestic partnerships.
- Japan’s mobile market is heavily influenced by console history and anime aesthetics, with RPGs consistently accounting for nearly 50% of total mobile revenue.
- South Korea’s market is defined by high-fidelity MMORPGs, supported by the country's advanced 5G infrastructure and a culture rooted in PC bang gaming.
Las Mujeres Juegan, Consumen, Participan: Contribución a la Industria de Videojuegos en 2020
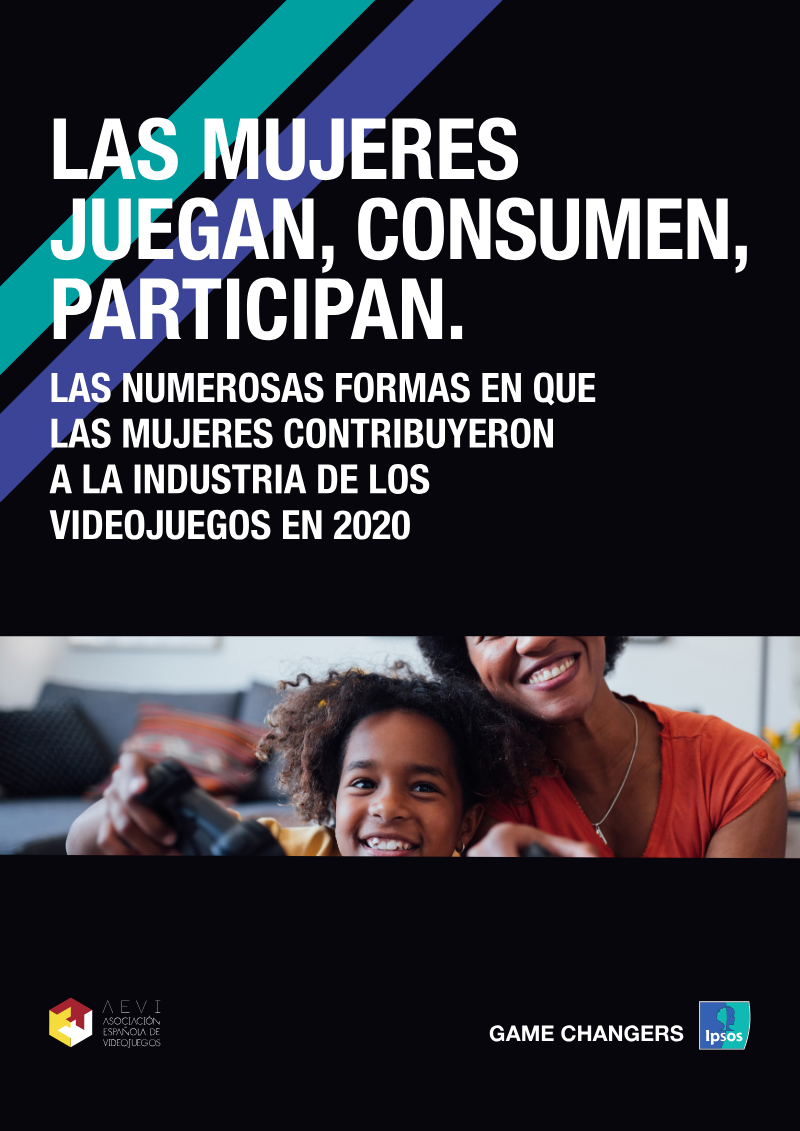
The analysis highlights how women have become a decisive force in the European video‑game market in 2020, both as players and as consumers. By the end of the year 118 million people aged 6‑64 were active gamers across Spain, France, Germany, Italy and the United Kingdom, with women accounting for 47 % of that base—up from 45 % in 2019. During the second‑quarter lockdown a record 60 million women played, and their average weekly playtime rose to 8.8 hours, with console sessions increasing by roughly one hour compared with the previous year. Mobile gaming proved especially important, as smartphone and tablet usage among women grew 3 % between Q1 2019 and Q4 2020.
Financially, women generated 38 % of total video‑game spending in the five markets, translating into approximately €6.8 billion of the €17.8 billion industry revenue—a 31 % year‑on‑year increase. Their purchases were split evenly between console titles and mobile apps, each contributing about €3 billion. The sector’s overall revenue rose by €3.2 billion in 2020, underscoring the economic impact of the expanding female audience.
Work
- Women accounted for 47% of the 118 million active gamers across Spain, France, Germany, Italy, and the UK in 2020, up from 45% in 2019.
- Female gamers generated €6.8 billion in spending in 2020, representing 38% of total industry revenue and a 31% year-on-year increase.
- During the 2020 Q2 lockdown, 60 million women played video games, with average weekly playtime rising to 8.8 hours and console sessions increasing by approximately one hour.
- Spending by women was split evenly between console titles and mobile apps, with each category contributing approximately €3 billion to the total.
- Smartphone and tablet usage among female gamers grew by 3% between Q1 2019 and Q4 2020, highlighting the rising importance of mobile platforms.
The Past, Present and Future of Games: Global and Local Opportunities
The global gaming industry is undergoing a generational transformation, evolving from a niche hobby into a pervasive cultural and economic force. This transition is characterized by a shift from traditional PC and console play toward a diversified ecosystem defined by mobile accessibility, free-to-play models, and the convergence of playing, watching, and social interaction. By 2022, the industry reached a state of "lifetime gamers," with a projected trajectory toward cross-market disruption by 2027.
Market data highlights the massive scale of this sector, with approximately 2.7 billion gamers globally and 1.3 billion spenders. The COVID-19 pandemic significantly accelerated this growth, leading to a $16 billion upward adjustment in 2020 revenue forecasts. Mobile gaming has emerged as the dominant segment, accounting for 49% of global consumer revenues. Furthermore, the rise of cloud gaming is expected to generate $4.8 billion in revenue by 2023, supported by major infrastructure plays from companies like Microsoft, NVIDIA, and Tencent.
Consumer behavior is also shifting, as evidenced by Newzoo’s segmentation which identifies diverse personas ranging from "Hardware Collectors" to "Backseat Viewers." Notably, 29% of enthusiasts do not rank playing as their primary interest, focusing instead on viewing or hardware. This engagement extends into new value chains, including in-game e-commerce—where players purchase physical goods directly through apps—and the integration of gaming with traditional media and travel industries.
The competitive landscape is defined by technological innovation and strategic content plays. While Sony emphasizes exclusive titles for its hardware, Microsoft focuses on subscription-based services. Simultaneously, the rise of esports and live-streaming has created new opportunities for celebrity engagement and music integration. As mobile esports viewership sees exponential growth on platforms like YouTube, the industry continues to blur the lines between casual and core gaming experiences, driven by global studios and empowered creator communities.
- The global gaming market has reached a scale of 2.7 billion gamers, with 1.3 billion active spenders driving the industry's evolution into a major economic force.
- Mobile gaming is the industry's dominant segment, currently accounting for 49% of global consumer revenues.
- Cloud gaming is a significant growth area, projected to generate $4.8 billion in revenue by 2023 through infrastructure investments from Microsoft, NVIDIA, and Tencent.
- Engagement is shifting beyond active play, as 29% of gaming enthusiasts identify viewing or hardware collection as their primary interest rather than gameplay.
- The COVID-19 pandemic acted as a major catalyst for the sector, necessitating a $16 billion upward adjustment to 2020 revenue forecasts.
Europe's Video Game Industry: Key Facts 2020
The European video games industry experienced steady growth in 2019, reaching a total market turnover of €21.6 billion. This represents a 3% year-on-year increase and a 55% rise since 2014 across key markets. Revenue is increasingly driven by digital ecosystems, with online and app-based income accounting for 76% of the market, while physical sales represent 24%. Within the online segment, 66% of revenue is generated through in-game extras and downloadable content. Console gaming remains the leading hardware category by revenue at 43%, closely followed by mobile and tablets at 40%.
Demographic data indicates that 51% of the European population aged 6 to 64 plays video games, with an average player age of 31. While engagement is highest among younger cohorts, 31% of those aged 45 to 64 are active players. Gender representation is nearly balanced, as women make up 45% of the player base and over half of all mobile gamers. On average, European players spend 8.6 hours per week gaming, significantly less than the time spent on social media or television.
The industry maintains a strong focus on responsible gameplay through the PEGI age rating system, which is active in over 35 countries. Approximately 67% of parents are aware of these labels, and 85% have established agreements with their children regarding in-game spending. Beyond consumer protection, the sector is expanding its educational footprint. Initiatives like the Games in Schools project, conducted with European Schoolnet, have trained over 4,000 teachers across 73 countries to integrate commercial games into pedagogical frameworks.
Data for these findings was primarily extrapolated from the 2019 GameTrack and Newzoo reports, utilizing surveys and sales tracking across major European territories including France, Germany, Italy, Spain, and the United Kingdom. The scope covers the 2019 calendar year while acknowledging the emerging impact of the COVID-19 pandemic on 2020 industry trends.
- The European video game market reached €21.6 billion in 2019, marking a 3% year-on-year increase and a 55% total growth since 2014.
- Digital ecosystems dominate the market, accounting for 76% of total revenue, with 66% of that online income derived specifically from in-game extras and downloadable content.
- Hardware revenue is split primarily between consoles at 43% and mobile/tablet devices at 40%.
- The European player base is 51% of the population aged 6 to 64, with an average age of 31 and a gender split of 55% male and 45% female.
- Engagement remains consistent across age groups, with 31% of individuals aged 45 to 64 identifying as active gamers.
State of the Polish Video Game Industry 2017
This report was made possible thanks to funding provided by the Ministry of Culture and National Heritage, the Ministry of Development, Creative Europe Desk Poland and the Agency The research part of the project was coordinated by the Kraków Technology Park. The partners of the report include the Polish Games Association, Indie Games Poland Foundation, Grupa Onet S.A. and Gry-Online S.A.
- The Polish video game industry is growing, with 13 companies listed on the Warsaw Stock Exchange (WSE) having a combined worth of nearly PLN 9.5 billion and generating PLN 270 million in earnings last year. These WSE-listed developers contributed over PLN 67 million in taxes to the Polish treasury in 2016.
- Poland is a significant test market for game soft launches, particularly for mobile games, due to its comparable market significance to the US, UK, or Germany, and lower user acquisition costs compared to Western or Asian markets. While the percentage of paying players and amounts spent are lower than in Western Europe or North America, the gap is narrowing.
- The PlayStation brand, especially the PS4, dominates the console market in Poland, significantly outselling Xbox One. This trend is partly attributed to the high system requirements of cross-platform titles like The Witcher 3: Wild Hunt, which encouraged many PC players to switch to consoles for a smaller hardware investment.
- The age distribution of Polish gamers shifted in 2016, with a significant decrease in the 15-24 age group (from 43% in 2015 to 31% in 2016), largely due to their migration from social network and PC gaming to mobile games (a 5% increase in mobile gaming for this age group).
- Asian companies are increasingly acquiring Western game developers and publishers, a trend observed over the past 1.5 years, with examples including Youzu buying Bigpoint, Netmarble acquiring Kabam, and Tencent purchasing Supercell. This indicates a growing interest from Asian giants and media conglomerates in the global video game market.
Estudio Videojuegos y Adultos 2015: España
The study aimed to gauge the penetration of video games among Spanish adults, map the demographic profile of adult gamers, explore attitudes and usage habits, compare adults with and without children, and assess purchase intentions for the 2015 holiday season. Conducted nationwide in November 2015, it surveyed 1,000 individuals aged 18 and over via telephone CATI interviews, yielding a margin of error of ±3.09 percent.
Overall, 38.9 percent of Spanish adults reported playing video games, while 61.1 percent did not. Play rates were highest among 18‑ to 29‑year‑olds, with three‑quarters engaging in gaming, and remained substantial for the 30‑44 age group at 54.3 percent. Men were more active than women (45.3 percent versus 32.8 percent), though women with children showed a higher participation rate (36.9 percent) than those without (30.1 percent), whereas the opposite pattern held for men. About 46.9 percent of gamers were occasional (at least monthly) and 41.5 percent habitual (weekly or daily), with habitual players being 60 percent male. Among habitual parents, 83.1 percent had children under nine, and 64.9 percent believed gaming strengthened parent‑child bonds, especially younger parents.
Education correlated with gaming intensity: 63.7 percent of habitual players held secondary or university qualifications. Consoles remained the dominant platform (61.1 percent), favored by men (66.2 percent), while women preferred smartphones (57.6 percent). Approximately 36.2
- In 2015, 38.9 percent of Spanish adults played video games, with the highest engagement found in the 18-29 age demographic at 75 percent.
- Gaming habits are gender-split by platform preference: men favor consoles (66.2 percent), while women primarily use smartphones (57.6 percent).
- Habitual gamers, defined as those playing weekly or daily, account for 41.5 percent of the gaming population and are 60 percent male.
- Parental status influences gaming behavior differently by gender, as women with children are more likely to play (36.9 percent) than those without (30.1 percent), while the inverse is true for men.
- Education level correlates with engagement intensity, with 63.7 percent of habitual players holding secondary or university qualifications.
Kondycja Polskiej Branży Gierwideo Raport 2015
Źródło fotografii: Materiały royality free z portalu Depositphotos.com oraz materiały prasowe z konferencji Digital Dragons Jeszcze kilkanaście lat temu gry wideo wydawały się obszarem zarezerwowanym jedynie dla największych entuzjastów technologii oraz młodszej części społeczeństwa. Dziś obraz gracza przedstawia się zgoła inaczej – w różnej formie ten rodzaj rozrywki wybiera coraz więcej osób, bez względu na wiek, za- wód czy wykształcenie.
- The global games market in 2015 was valued at $74.2 billion, with mobile games ($22.3 billion) and retail sales ($19.7 billion) being the largest segments.
- In Poland, 72% of internet users play games. 42% play games installed on computers, 40% play on smartphones/tablets, and 38% play browser games.
- Action games are the most popular genre among Polish players, accounting for 35% of page views on GRY-OnLine.pl in the first half of 2015.
- Polish game developers are productive, with 49% working on 1-2 projects simultaneously, and 37% on 3-5 projects. Over half (51%) are working on more than two projects.
- The Polish game industry is growing, with 64% of developers having budgets exceeding one million PLN, and a significant increase in employment.
Padres y Videojuegos Hoy: España 2014
The research investigates contemporary Spanish parental attitudes toward video gaming, focusing on usage patterns, perceived competence, and consumer behavior during the 2014 holiday season. It reveals that a substantial majority—84 %—of parents actively play video games and consider themselves technologically equal to or more knowledgeable than their children. This confidence translates into a notable educational dimension, with 40 % of parents employing games as learning tools for their offspring.
Family interaction emerges as a key driver, as more than half of the surveyed parents have maintained or increased their gaming time after becoming parents, citing shared play as a primary motivator. Economic analysis shows a modest decline in overall holiday spending on games compared with the previous year; however, parents who identify as gamers intend to allocate higher expenditures than non‑gamer parents. Video games rank as the most coveted Christmas gift for half of the children surveyed, with a particular preference for physical console titles.
Overall, the findings underscore a robust integration of gaming within Spanish households, highlighting parental confidence, educational utilization, and sustained consumer demand despite slight seasonal spending fluctuations. The study’s scope encompasses Spanish families during the December 2014 period, offering insight into parental influence on market dynamics across both digital and physical gaming segments.
- In 2014, 84% of Spanish parents actively played video games and reported feeling equally or more technologically competent than their children.
- 40% of Spanish parents utilized video games as formal educational tools for their children.
- More than 50% of surveyed parents maintained or increased their personal gaming time after becoming parents, primarily driven by the desire for shared family play.
- Video games were the most requested Christmas gift for 50% of children in Spain during the 2014 holiday season, with a strong preference for physical console titles.
- While overall holiday spending on games saw a slight decline in 2014, parents who identified as gamers planned to spend more on gaming products than non-gamer parents.
Essential Facts 2014: Canada
The 2014 overview of Canada’s video‑game sector presents a comprehensive picture of an industry that ranks among the world’s largest by per‑capita employment and is a cornerstone of the nation’s digital economy. Drawing on custom research commissioned by the Entertainment Software Association of Canada (ESAC)—including NPD surveys of 3,359 adults and 526 teens in 2014, a 2012 survey of 2,969 adults, 527 teens and 687 children, and quantitative data from 90 Canadian companies—the analysis covers national trends, regional breakdowns, workforce characteristics, public perception and consumer behaviour.
Employment figures reveal 16,500 individuals directly working in game development, equivalent to 27,000 full‑time jobs, with a 5 % increase in staff between 2011 and 2013 and two‑fifths of firms forecasting a 25 % expansion within two years. The sector generated $2.3 billion in GDP contribution and $1.6 billion in direct spending, a 12.5 % rise from 2011. More than half of Canadian companies identify as independent developers, and 53 % of the 329 firms operate as such. Salaries average $72,500 annually, with a median employee age of 31,
- Canada’s video game sector directly employs 16,500 people, representing 27,000 full-time equivalent jobs.
- The industry contributed $2.3 billion to Canada’s GDP and generated $1.6 billion in direct spending, marking a 12.5% increase since 2011.
- Employment in the sector grew by 5% between 2011 and 2013, with 40% of firms projecting a 25% staff expansion within two years.
- Independent developers comprise 53% of the 329 identified Canadian game companies.
- The average annual salary for industry employees is $72,500, and the median age of the workforce is 31.
Faits Essentiels 2014
The purpose of the compilation is to present a comprehensive portrait of Canada’s video‑game industry in 2014, demonstrating its economic weight, employment dynamics, and public perception. Data were gathered from four principal sources: an NPD Group survey of 3 359 adults and 526 adolescents (margin of error ± 2.19 %); a comparable 2012 NPD study of 2 969 adults and 527 adolescents (± 1.5 %); a Nordicity questionnaire completed by 90 Canadian studios; and a NewZoo global consumer poll of 35 000 respondents aged 10‑65. The scope covers the national market and its three largest provinces—Quebec, British Columbia and Ontario—while also
- The Canadian video game sector employs 16,500 people directly, creates 27,000 full-time equivalent jobs, and contributes $2.3 billion annually to Canada's GDP. It is the world's largest producer of video games per capita (by employee count).
- Canadian video game companies spent $1.6 billion directly, a 12.5% increase from 2011. The sector comprises 329 companies, with 53% identifying as independent developers, and 910 projects were completed in 2012.
- The average age of a Canadian video game worker is 31, with an average salary of $72,500 per year in 2012. 97% of new graduates hired are recruited within Canada.
- 54% of Canadians are gamers, having played a video or computer game in the last four weeks, with the average Canadian gamer being 33 years old. 85% of Canadian gamers own a console, 62% own a smartphone, and 35% own a tablet.
- Quebec's video game sector employs 8,749 people, with an estimated expenditure of $741 million, and an average salary of $65,500. British Columbia employs 5,140 people, with $548 million in expenditures, and an average salary of $80,100. Ontario employs 1,821 people, with $134 million in expenditures, and an average salary of $76,400.
Essential Facts About the Computer and Video Game Industry: 2013
The computer and video game industry in the United States demonstrated significant economic strength in 2013, generating a total revenue of $21.53 billion. This financial performance underscores the sector's role as a major contributor to the national economy, driven by robust consumer demand for interactive entertainment across various platforms and delivery methods.
Consumer spending on game content accounted for $15.39 billion of the total industry revenue. A notable shift in purchasing behavior is evident in the 11 percent year-over-year growth of digital format sales. This trend highlights a transition toward digital distribution models, reflecting evolving consumer preferences for immediate access to content over traditional physical media.
These findings provide a snapshot of the domestic gaming market during the 2013 calendar year, focusing specifically on revenue generation and sales distribution. By tracking the growth of digital formats alongside total content expenditure, the data illustrates a maturing market that is increasingly reliant on digital infrastructure to sustain its financial trajectory. The industry maintains a strong foothold in the entertainment sector, characterized by consistent revenue streams and a clear movement toward digital-first consumption patterns.
- The U.S. computer and video game industry generated $21.53 billion in total revenue during 2013.
- Consumer spending on game content reached $15.39 billion, representing the largest portion of total industry revenue.
- Digital format sales experienced an 11 percent year-over-year growth rate in 2013.
- The gaming market is undergoing a structural shift toward digital distribution models, prioritizing immediate content access over traditional physical media.
- The 2013 financial data confirms the industry's transition toward a digital-first infrastructure to sustain long-term revenue growth.