Global
Documents

Stream Hatchet Video Game Streaming Trends Report 2022 First Quarter Report
The report examines live video‑game streaming activity in Q1 2022, focusing on audience growth, platform market share, and creator performance across Twitch, YouTube Gaming, Facebook Gaming, and emerging competitors such as Trovo, AfreecaTV, and Naver TV. Total hours watched across all platforms rose 140 % from Q1 2019, yet the growth rate slowed to a 6 % decline versus Q1 2021, reflecting creator fatigue and pandemic‑induced saturation. Twitch maintained dominance with 75 % of total hours, adding 286 million hours (5 % growth), while Trovo and AfreecaTV experienced double‑digit gains of 188 % and 15 %, respectively. Esports viewership remained resilient, increasing by 61 % from pre‑pandemic levels and contributing 80 % of esports hours on Twitch.
Creator analytics reveal that xQcOW led all platforms with 62.8 million hours, while Spanish‑speaking channels dominated the top 30 % of viewership. Female creators such as Ironmouse and Valkyrae achieved significant growth, largely driven by VTuber content. Core viewers—those watching 5 hours daily—constitute only 7.8 % of the audience but generate two‑thirds of total hours and are 24 times more likely to engage with repeated advertising. Mobile game streaming remains largely casual, yet core audiences drive 78 % of mobile stream hours.
Methodologically, the study aggregates live and VOD metrics from third‑party APIs across 14 platforms, applying manual labeling and automated filtering to produce hourly, concurrent, and retention statistics. The findings underscore a maturing streaming ecosystem where platform diversification, creator niche specialization, and core audience targeting are pivotal for marketers and publishers.
- Twitch remains the dominant streaming platform with 75% of total market share, growing by 5% (286 million hours) in Q1 2022 despite a broader industry decline.
- Total hours watched across all streaming platforms fell by 6% compared to Q1 2021, signaling a market correction following pandemic-era saturation and creator fatigue.
- Core viewers who watch at least 5 hours daily represent only 7.8% of the total audience but account for two-thirds of all hours watched and are 24 times more likely to engage with ads.
- Esports viewership remains a high-performing sector, showing a 61% increase over pre-pandemic levels with 80% of all esports hours occurring on Twitch.
- Emerging platforms are gaining traction, with Trovo and AfreecaTV recording significant viewership growth of 188% and 15% respectively in Q1 2022.

Global Esports and Live Streaming Market Report
The report outlines the global esports and live‑streaming landscape for 2022, emphasizing key tournaments, viewership metrics, and emerging strategic shifts by major publishers. Counter‑Strike: Global Offensive dominated with the PGL Major Antwerp drawing 10.5 million hours watched and an average concurrent unique viewer (ACU) of 96.7 k, followed by Dota 2 and League of Legends events that collectively attracted over 20 million hours. Valorant’s regional tours and the upcoming Champions Tour in Japan added nearly 3 million hours, while Wild Rift’s global championship moved to Singapore with a $2 million prize pool and 24 teams. PUBG Mobile’s Nations Cup returned to Bangkok with a $500 k prize pool, and the IEM Rio Major was re‑announced after pandemic cancellations, selling out tickets in Brazil’s Jeunesse Arena.
The analysis highlights a shift toward franchising models that reduce entry barriers, notably Riot’s new Valorant structure that foregoes franchise fees in favor of long‑term partnerships and financial stipends, contrasting with the high costs seen in League of Legends. Third‑party organizers are encouraged to host off‑season events, expanding grassroots participation and diversifying content. The report also notes the growing importance of women’s tournaments, such as Riot’s Game Changers initiative, to broaden audience engagement.
Data were sourced from Newzoo’s platform aggregating Twitch, YouTube, and Facebook Gaming streams, covering global viewership across 2022. The scope spans North America, Europe, Asia-Pacific, and Latin America, focusing on major esports titles and live‑streaming platforms. The methodology involved compiling broadcast hours, ACU figures, and prize pool totals to assess market size, growth drivers, and investment trends within the esports ecosystem.
- Counter-Strike: Global Offensive led 2022 viewership with the PGL Major Antwerp recording 10.5 million hours watched and an average concurrent viewership of 96.7k.
- Riot Games is shifting its Valorant esports strategy from high-cost franchising to a partnership model that eliminates franchise fees in favor of financial stipends.
- Major esports titles including Dota 2 and League of Legends events generated over 20 million hours of combined viewership in 2022.
- Wild Rift’s global championship in Singapore featured a $2 million prize pool across 24 teams, while the PUBG Mobile Nations Cup in Bangkok offered a $500k prize pool.
- Valorant’s regional tours and the upcoming Champions Tour in Japan contributed nearly 3 million hours of viewership to the global landscape.
Modern Mobile Consumer 2022: App Monetization Report
The report examines how modern mobile consumers interact with app monetization, revealing that rewarded ads and in‑app purchases (IAP) coexist without cannibalizing revenue. Surveying 30,457 participants—18,894 from gaming apps and 11,563 from non‑gaming apps on the ironSource network, plus a 500‑person control group outside MobileVoice®—the study covers North America and global markets from April to May 2022. Respondents were verified as adults and opted in for virtual rewards, ensuring engagement accuracy.
Key findings show an almost even split between IAP and ad‑supported preferences across both gaming and non‑gaming audiences. Generation X favors occasional or frequent IAP yet prefers ad support overall, while 24% of Gen Z would pay a one‑time fee to remove ads. Approximately one third of users make occasional IAPs, a significant rise from the 2‑3% noted five years earlier. Free apps with IAP dominate downloads (52% of gaming users), and 15‑17% of consumers now spend more on IAPs than five years ago.
Methodologically, the study combined custom MobileVoice® surveys with third‑party polling (Pollfish) to mitigate bias. Data were analyzed using ironSource’s Offerwall and native survey offers, with age verification and global reach.
The report concludes that diversified monetization strategies—balancing ads, IAPs, and optional removal fees—are essential to meet evolving consumer expectations. It recommends audience‑specific research, price optimization, and value bundle offerings to maximize revenue while preserving user experience.
- Rewarded ads and in-app purchases (IAP) do not cannibalize each other, allowing for a hybrid monetization strategy that maximizes revenue without sacrificing user experience.
- The percentage of users making occasional IAPs has grown significantly to approximately one-third of the total user base, up from 2-3% five years ago.
- Free apps with IAP are the dominant model, accounting for 52% of all gaming app downloads.
- Consumer spending on IAPs has increased, with 15-17% of users reporting higher expenditure compared to five years ago.
- While preferences are split between IAP and ad-supported models, 24% of Gen Z users are specifically willing to pay a one-time fee to remove advertisements.
Gaming Deals Activity Report: Q1'22 Supermassive Start of the Year
The report examines gaming‑industry transactions during the first quarter of 2022, revealing a sharp contraction in overall deal value compared with the same period in 2021. Total closed deals reached $15.2 billion across 262 transactions, a decline driven almost entirely by a 90% drop in public offerings that fell to $0.5 billion. Private‑investment activity, however, expanded, with $3.2 billion raised in 174 deals—a 36% year‑over‑year increase—half of which came from blockchain‑powered gaming ventures that captured $1.6 billion.
Mergers and acquisitions maintained a steady volume of 81 deals but saw a 23% decline in value to $4.35 billion, with the gaming sector accounting for 35% of that figure ($4 billion). Mega‑acquisitions such as Microsoft’s $68.7 billion purchase of Activision Blizzard and Take‑Two’s $12.7 billion acquisition of Zynga underscored the sector’s high‑profile activity, even as overall M&A value fell 76% year‑over‑year.
Early‑stage funding contracted, with seed and Series A rounds totaling 37 deals that raised $334 million—an increase in average size but a 26% drop in count. Late‑stage rounds remained sizable, highlighted by Dream Games’ $255 million Series C. The blockchain gaming sub‑sector rebounded strongly, with 88 deals raising $1.6 billion—an eleven‑fold increase in count and a nineteen‑fold jump in value from the previous year. The analysis covers global activity across all gaming segments for Q1 2022, providing a comprehensive snapshot of the market’s shifting dynamics.
- Total gaming industry deal value reached $15.2 billion across 262 transactions in Q1 2022, marking a significant contraction driven by a 90% drop in public offerings to $0.5 billion.
- Blockchain-powered gaming saw a massive surge, accounting for $1.6 billion across 88 deals, representing an eleven-fold increase in deal count and a nineteen-fold jump in value year-over-year.
- Mergers and acquisitions saw a 76% year-over-year decline in total value, though the period was defined by high-profile mega-deals including Microsoft’s $68.7 billion acquisition of Activision Blizzard and Take-Two’s $12.7 billion purchase of Zynga.
- Private investment activity grew by 36% year-over-year, totaling $3.2 billion across 174 deals, with blockchain ventures accounting for half of this total capital raised.
- M&A transaction volume remained steady at 81 deals, though the total value of these transactions fell 23% to $4.35 billion.
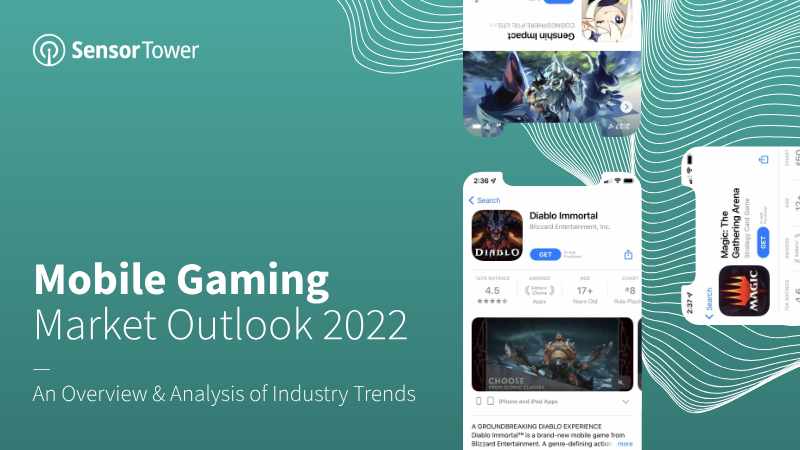
Market Outlook 2022
The analysis outlines a 2022 outlook for the global mobile‑gaming market, emphasizing that quarterly installs have plateaued at roughly 14 billion after a pandemic‑driven surge, with casual titles still accounting for about 80 % of downloads. Revenue dynamics have shifted: mid‑core games now generate 60 % of total earnings, while overall mobile‑game revenue fell 7 % year‑over‑year in Q1 2022, marking the first decline since the industry’s rapid expansion. The United States remains the largest spend market, yet Asia‑Pacific regions—especially Taiwan and Brazil—exhibit the fastest growth rates.
Advertising spend analysis reveals that role‑playing games dominate iOS channels, with YouTube capturing an 8.2 % share of voice and exceeding 10 % in Q2 2022; Android spend lags across all networks. Card‑battler titles emerge as the fastest‑growing sub‑genre, driven largely by Japan and China, which together account for 62 % of player spending. Yu‑Gi‑Oh! Master Duel leads launch revenue, reaching $80 million in five months and achieving a worldwide revenue per day of $20—twice that of its nearest competitor. MMORPGs hold the second‑largest spending position globally, with Diablo Immortal topping U.S. spend at $22 million in H1 2022 and maintaining a modest 10 % share of U.S. MMORPG installs.
In the United States, Diablo Immortal generated over $30 million in its first six weeks and captured 3.2 % of mid‑core revenue, yet U.S. players still lag behind Asian markets where Lineage M and Odin: Valhalla Rising amassed $225–$350 million in the same period. The report underscores that U.S. MMORPG revenue represents only about 4 % of the global total, highlighting the critical need for localized market strategies in future mobile RPG releases.
- Global mobile-game revenue declined 7% year-over-year in Q1 2022, marking the first such contraction after a period of rapid expansion.
- Quarterly mobile-game installs have plateaued at approximately 14 billion, with casual titles continuing to represent 80% of total downloads.
- Mid-core games now drive 60% of total mobile-game earnings, despite the U.S. market accounting for only 4% of global MMORPG revenue.
- Card-battler titles are the fastest-growing sub-genre, with Japan and China accounting for 62% of global player spending in this category.
- Yu-Gi-Oh! Master Duel achieved $80 million in revenue within five months, maintaining a daily revenue of $20 per player—double that of its nearest competitor.
The Metaverse, Blockchain Gaming, and NFTs: Navigating the Internet’s Uncharted Waters 2022
The analysis demonstrates that the metaverse, blockchain gaming, and NFTs have transitioned from niche curiosities to mainstream commercial forces, reshaping consumer engagement across entertainment, fashion, and gaming. Major brands—including Nike, Gucci, Samsung, and Louis Vuitton—are investing in digital real estate and virtual storefronts to capture a digitally native audience, while music artists leverage virtual concerts and NFT sales as alternative revenue streams. Virtual events such as Ariana Grande’s Rift Tour and Justin Bieber’s Wave performance illustrate the capacity of fully digital experiences to attract millions of concurrent viewers, signaling a shift toward immersive entertainment and fan‑centric monetization.
In the fashion sector, digital‑first houses like Auroboros and The Fabricant generate millions of users by selling high‑priced virtual garments, integrating NFTs to provide ownership and community benefits. The report projects that realistic XR shopping, AR try‑ons, and interoperable digital wardrobes will drive higher engagement and conversion rates, enabling luxury brands to test markets digitally before physical production. Blockchain gaming remains dominated by low‑revenue titles, yet play‑to‑earn (P2E) ecosystems—exemplified by Axie Infinity’s 3 billion gamers and Illuvium’s $72 million funding—are expanding, with guilds such as Yield Guild Games monetizing in‑game assets through lending models. Sustainability hinges on continued user engagement and broader adoption beyond speculative gains.
Non‑PFP NFTs, including virtual land, music collectibles, and utility tokens, are gaining traction through community‑building perks and cross‑game interoperability, as seen in VeeFriends, NBA Top Shot, Habbo Hotel, and Metakey. These use cases broaden the NFT value proposition and support deeper metaverse integration. However, the industry faces significant regulatory and safety challenges: governments are pushing for open standards to mitigate political, moderation, and privacy risks, while the proliferation of user‑generated content amplifies concerns over deepfakes, disinformation, and harassment. Addressing these issues will require new legal frameworks and robust community moderation before a safe, inclusive metaverse can be fully realized.
- The metaverse and blockchain gaming have evolved into mainstream commercial forces, with major brands like Nike, Gucci, Samsung, and Louis Vuitton investing in virtual storefronts and digital real estate.
- Virtual events are demonstrating massive scale, as evidenced by Ariana Grande’s Rift Tour and Justin Bieber’s Wave performance attracting millions of concurrent viewers.
- Blockchain gaming is expanding through play-to-earn models, highlighted by Axie Infinity’s 3 billion gamers and Illuvium’s $72 million in funding, though long-term viability depends on engagement beyond speculative gains.
- Digital-first fashion houses like Auroboros and The Fabricant are successfully monetizing virtual garments, utilizing NFTs to provide ownership and community benefits to users.
- Non-PFP NFTs, such as virtual land and music collectibles from projects like NBA Top Shot and VeeFriends, are gaining traction by focusing on utility and cross-game interoperability.
Newzoo’s Games, Esports, Live Streaming, Cloud and the Metaverse
The analysis examines how emerging technologies and shifting consumer behaviors are reshaping the global gaming ecosystem. Blockchain‑based monetisation, particularly non‑fungible tokens (NFTs), has met with mixed reception. While the promise of secure, legitimised trading is evident in titles such as Axie Infinity, major publishers have reacted cautiously. Valve’s ban of crypto games on Steam and Ubisoft’s withdrawal from NFT initiatives after player backlash illustrate a broader industry reluctance, compounded by regulatory constraints in jurisdictions like South Korea and platform‑level anti‑steering rules from Apple and Google. Consequently, publishers are exploring “NFT‑like” features under less controversial branding to satisfy investor appetite while mitigating gamer discontent.
Live‑streaming and cloud gaming are emerging as pivotal drivers of player engagement. Interactive shows such as Facebook’s Rival Peak and PAC‑MAN Community have amassed over 100 million minutes of viewership in three months, opening new monetisation avenues. The semiconductor shortage is accelerating the migration of high‑end titles—Elden Ring, Starfield—to cloud platforms. Services like NVIDIA GeForce NOW and Google Stadia have already recorded user growth, while publishers leverage cloud to deliver AAA content on legacy hardware (e.g., Nintendo Switch) and broaden access through subscription bundles such as Game Pass Ultimate. This trend signals a shift toward broader platform reach and subscription retention.
Geographically, the Asia‑Pacific region dominates global game revenues at $42.6 billion, driven by China’s mobile‑first market and an 8.7% compound annual growth rate (CAGR). North America matches this revenue figure at $42.6 billion, with a 7.9% CAGR. Latin America, the Middle East, and Africa are projected to grow faster than the global average, increasing their share of worldwide revenues. COVID‑19’s impact on Asia‑Pacific was muted, partly due to a strong console gaming emphasis that helped sustain growth. The findings collectively underscore the importance of balancing innovative monetisation models, expanding platform accessibility, and regional market dynamics in shaping the future of gaming.
- The Asia-Pacific and North American markets are currently tied for the global lead in game revenue at $42.6 billion each, with Asia-Pacific maintaining an 8.7% compound annual growth rate.
- Cloud gaming is expanding rapidly as publishers use services like NVIDIA GeForce NOW to deliver AAA titles to legacy hardware, driven by semiconductor shortages and the need for broader platform reach.
- Major publishers are pivoting away from explicit NFT branding due to significant player backlash and platform-level restrictions from companies like Valve, Apple, and Google, opting instead for less controversial 'NFT-like' monetization features.
- Interactive live-streaming content is proving to be a high-engagement driver, with titles like Rival Peak and PAC-MAN Community generating over 100 million minutes of viewership in a three-month period.
- Emerging markets in Latin America, the Middle East, and Africa are projected to outpace the global average in revenue growth, signaling a shift in the geographic distribution of the gaming industry.
The State of Mobile Game and App Markets
The analysis demonstrates that mobile app and game advertising in the first half of 2022 experienced a notable contraction, with a 6.24 % year‑over‑year decline in app advertisers and a 27.83 % drop in creative volume, yet the sector is pivoting toward higher‑quality, data‑driven campaigns. Predictive analytics and Apple’s SKAdNetwork 4.0 are emerging as essential tools for optimizing cost‑per‑install, in‑app purchase return on ad spend, and overall campaign effectiveness.
Advertisers are concentrating on impactful creative mechanics and event‑based optimisations, particularly within casual gaming, fitness, and finance verticals. The number of game creatives fell 27.8 % while the advertiser base remained flat at roughly 45,000, indicating a shift from quantity to quality. Major networks such as Unity Ads and AppLovin are leading the charge, with experimentation on offerwall formats that demand precise attribution windows. Meta continues to dominate paid‑social traffic outside the gaming sphere, underscoring its broader reach.
Geographically, tier‑1 markets—US, Australia, Germany, South Korea, UK, and France—dominate spend and revenue, with CPMs peaking in the United States at approximately $27. Lower‑cost regions such as Turkey and India present attractive lifetime value opportunities, especially during seasonal CPM spikes in fall and winter holidays. Android creatives have gained prominence post‑IDFA, while incentive‑based offerwalls are becoming more prevalent.
Publishers increasingly rely on search‑driven installs and coordinated ASO/paid‑social strategies, with Apple Search Ads projected to reach $20 billion by 2025. The focus on higher‑quality ad creatives, blended event optimisation (trial plus subscription), and rising subscription prices—driven by A/B testing and post‑iOS‑14.5 user acquisition costs—highlights a tightening competitive landscape, particularly in Android and tier‑2/3 markets.
- Mobile advertising experienced a significant contraction in H1 2022, marked by a 6.24% year-over-year decline in app advertisers and a 27.83% drop in creative volume.
- The industry is shifting from high-volume output to quality-focused, data-driven campaigns, evidenced by a flat advertiser base of 45,000 despite the sharp reduction in creative assets.
- Apple Search Ads are projected to reach $20 billion in revenue by 2025 as publishers increasingly prioritize search-driven installs and integrated ASO strategies.
- Tier-1 markets, led by the US with peak CPMs of approximately $27, remain the primary drivers of spend and revenue, while Turkey and India offer high lifetime value opportunities during seasonal CPM spikes.
- Predictive analytics and SKAdNetwork 4.0 have become essential for optimizing campaign effectiveness, return on ad spend, and cost-per-install metrics.

Global White Paper on Mobile Advertising & Marketing Game
Mobile game advertising in 2022 experienced a pronounced contraction, with total creatives falling nearly 30 % year‑over‑year to 15.8 million while the advertiser base stayed flat at 45,100. The decline stemmed from a shift toward quality‑focused marketing and the impact of Apple’s IDFA changes, which pushed spend to Android. Video ads dominated the format mix (over 86 % of creatives), and casual/puzzle titles captured the majority of spend, displacing RPGs in many markets. Tier 2 and Tier 3 regions saw significant growth, driven by cross‑platform titles such as Genshin Impact and the rise of esports and metaverse expectations.
Geographically, China’s HK/Macau/TW region maintained RPG dominance but broadened to action, casual and MOBA campaigns with large budgets. In the United States, mid‑core and hardcore titles produced the most creatives despite a 10 % revenue decline. Japan’s simulation games led advertising, while Korea shifted from MMOs to card‑RPGs and early NFT experimentation. South Asia’s market was shooter‑heavy, with casual games generating the most creatives and RPGs producing the highest volumes. Turkey’s top titles were ARPGs and shooters, with a surge in casual and parkour advertising tied to esports and influencer content.
Cost dynamics varied by genre and platform: strategy games commanded the highest CPM ($21.58), while casual titles hovered around $17–$18; iOS ads were 15 % costlier than Android. Female and older users (55–64) paid the highest CPMs ($22.26) and CPCs ($2.90), yet CTR increased with age across formats. Playable ads delivered the lowest CPI but weakest ROAS, whereas banner ads offered the best return on spend.
Emerging channels such as social‑first platforms and AR filters proved highly engaging, with Snapchat’s concise, sound‑driven ads capturing attention within five seconds and AR filters generating 1.7× more immersive brand links. In India, vernacular marketing and programmatic unified platforms are expanding reach to Tier II/III audiences, while playable and rewarded video formats mitigate banner blindness. Overall, the data underscore a diversification of genre advertising, a continued emphasis on high‑budget flexible media strategies, and a pivot toward video‑centric, narrative‑driven campaigns across high‑revenue titles.
- Mobile game advertising volume contracted by nearly 30% in 2022 to 15.8 million creatives, driven by a shift toward quality-focused marketing and the impact of Apple’s IDFA changes.
- Video ads dominate the market, accounting for over 86% of all creatives, while casual and puzzle titles have displaced RPGs as the primary drivers of advertising spend.
- Cost-per-mille (CPM) is highest for strategy games at $21.58, and iOS advertising remains 15% more expensive than Android equivalents.
- Targeting female and older users (55–64) yields the highest CPMs ($22.26) and CPCs ($2.90), with click-through rates showing a positive correlation with user age.
- While playable ads achieve the lowest cost-per-install (CPI), banner ads currently provide the most effective return on ad spend (ROAS).
Blockchain Industry Report
The report examines the blockchain ecosystem during a prolonged bear market, highlighting how macroeconomic pressures—high U.S. inflation, rising interest rates, and a recessionary environment—have driven investors to withdraw capital from both equity and cryptocurrency markets. This withdrawal has intensified selling pressure, reducing medium‑term trading volume and pushing dapp activity to its lowest point of 2022, with 1.68 million daily unique active wallets (UAW) in July, a 4 % month‑over‑month decline yet still 20 % above July 2021 levels.
DeFi remains the most affected segment, with UAW falling below 500 k for the first time since April 2021—a 22 % MoM drop and a 31 % YoY decline. Total value locked (TVL) has begun to recover, rising 22 % from July 1 to July 31 to $82.3 bn, driven by gains across Ethereum, BNB Chain, and Polygon. Polygon’s network upgrades and migration of Terra projects have contributed to a 17 % TVL increase, while the launch of a web3 smartphone partnership signals continued innovation.
NFT trading volume contracted 25 % MoM, falling below $1 bn for the first time since June 2021. Market concentration intensified, with Yuga Labs’ collections accounting for over 20 % of July’s volume. OpenSea’s dominance has eroded from 84 % to 58.6 %, as new marketplaces such as GameStop and Nickelodeon capture niche segments.
Gaming defied the downturn, achieving 1 million daily UAW and $857 m in transactions, with its share of overall usage rising from 52 % to 57.4 %. The report concludes that while the crypto winter has triggered significant market recalibration, resilient projects—particularly in DeFi and gaming—are positioned to drive a future bull run.
- Blockchain gaming remains the industry's most resilient sector, accounting for 57.4% of total daily unique active wallet (UAW) activity with 1 million daily UAW and $857 million in transactions.
- Total Value Locked (TVL) in DeFi showed signs of recovery in July, increasing 22% to $82.3 billion across major networks like Ethereum, BNB Chain, and Polygon.
- NFT trading volume dropped 25% month-over-month to below $1 billion, while OpenSea’s market share eroded significantly from 84% to 58.6% due to competition from new entrants like GameStop and Nickelodeon.
- Macroeconomic pressures, including high inflation and rising interest rates, caused overall dapp activity to hit its lowest point of 2022 in July with 1.68 million daily UAW.
- The DeFi sector experienced a sharp contraction, with UAW falling 22% month-over-month to below 500,000, marking its lowest level since April 2021.
Data Digest Q2 2022
Global mobile app activity in Q2 2022 showed a modest 2.5 % year‑over‑year decline in total downloads, falling to 35 billion worldwide. TikTok remained the undisputed leader on both Apple’s App Store and Google Play, while Meta’s suite of apps—Instagram, WhatsApp, Messenger—dominated the top‑10 rankings globally. In the United States consumer spending shifted away from games toward non‑game categories, and Meta’s share slipped to fourth place on Google Play. Europe and Asia mirrored TikTok’s dominance, yet regional leaders varied: Google Maps surged in Europe, and VooV Meeting experienced a 47 % jump amid China’s lockdowns.
On Google Play, Asia was the most dynamic market. Instagram captured 22 % of all Meta installs and outpaced Facebook, Snapchat, and WhatsApp. India accounted for 70 % of TikTok’s downloads, while Meesho and WhatsApp Business each exceeded 30 % of their regional installs. Meta’s overall Google Play installs in Asia grew 22 % YoY, whereas competitors showed mixed performance. Worldwide, Meta pulled more than 550 million downloads on Google Play—well ahead of Google’s 320 million—and expanded its lead over the rival.
Google Play downloads totaled 7 billion in Q2 2022, a 26 % YoY increase but still 9.7 % below pre‑pandemic Q2 2019 levels. India remained the largest market with 6 billion downloads, despite a ~10 % YoY decline, while Indonesia’s 8.5 % QoQ growth to 6 billion positioned it to potentially overtake Brazil’s 7.26 billion downloads. Other markets, including the U.S. and Mexico, saw modest changes, underscoring India’s continued dominance and Indonesia’s rapid expansion.
In gaming, Miniclip’s acquisition of Sybo and the inclusion of Subway Surfers propelled it to sixth place in worldwide mobile game downloads, achieving 472 million installs and $194 million in consumer spending, with a May spike. Travel‑app downloads rebounded to over 100 million in the U.S. and 28 million in the U.K., while ticket‑app installs surged, with the top five apps exceeding 10 million U.S. downloads—an increase of more than 70 % from pre‑pandemic levels—highlighting robust growth potential in both gaming and travel/event segments as consumer activity returns to pre‑COVID norms.
- Global mobile app downloads declined 2.5% year-over-year to 35 billion in Q2 2022, while Google Play downloads reached 7 billion, a 26% year-over-year increase that remains 9.7% below pre-pandemic Q2 2019 levels.
- Meta continues to dominate the global app market, securing over 550 million Google Play downloads compared to Google’s 320 million, with Instagram leading Meta’s growth in Asia at 22% of all its regional installs.
- TikTok remains the top-ranked app globally, with India accounting for 70% of its total downloads during the quarter.
- India remains the largest Google Play market with 6 billion downloads, while Indonesia’s 8.5% quarter-over-quarter growth positions it to challenge Brazil’s 7.26 billion download volume.
- Miniclip reached sixth place in worldwide game downloads with 472 million installs and $194 million in consumer spending, largely driven by its acquisition of Sybo and the Subway Surfers title.
Video Game Streaming Trends: 2022 Second Quarter Report
The second quarter of 2022 marked a period of stabilization for the live streaming industry as the rapid growth spurred by pandemic lockdowns began to cool. Total hours watched across major platforms fell 15% year-over-year to 8.1 billion hours. This decline is attributed in part to creator fatigue, evidenced by a 20% drop in unique channels and a 16% decrease in total hours broadcast. Despite this contraction, the industry remains significantly larger than its pre-pandemic state in 2019.
Twitch continues to dominate the market with a 68% share of total hours watched, followed by YouTube at 14%. Facebook Gaming saw a significant 50% decline in watch time compared to the previous year. Conversely, disruptor platforms like Trovo experienced a 127% increase in viewership, largely driven by Russian streamers migrating from Twitch. While the broader market slowed, the esports segment grew by 8%, with major events like the League of Legends Mid-Season Invitational and the PGL Major Antwerp driving significant engagement.
The data highlights a strategic shift among esports organizations, which are increasingly relying on content creators to reach broader audiences. For example, 98% of the hours watched for Luminosity were generated by its affiliated creators rather than competitive matches. Top-tier games like Grand Theft Auto V and League of Legends maintained their dominance, while new releases like The Quarry demonstrated the potential for narrative-driven titles to capture short-term viewership peaks. Non-gaming content also made an impact, as the Johnny Depp vs. Amber Heard trial boosted the Just Chatting category by over 7% during the quarter.
This analysis covers global streaming trends across nearly 20 platforms, including Twitch, YouTube, and Facebook Gaming, for the period of April through June 2022. The findings are based on proprietary data aggregation and business intelligence from Stream Hatchet.
- Total hours watched across live streaming platforms fell 15% year-over-year to 8.1 billion in Q2 2022, signaling a post-pandemic market stabilization.
- Twitch maintains a dominant 68% market share of total hours watched, while YouTube holds 14% and Facebook Gaming experienced a 50% decline in viewership.
- The esports segment grew by 8% during the quarter, bolstered by major events like the League of Legends Mid-Season Invitational and the PGL Major Antwerp.
- Creator activity contracted significantly, with a 20% drop in unique channels and a 16% decrease in total hours broadcast compared to the previous year.
- Esports organizations are increasingly reliant on content creators for reach, as evidenced by 98% of Luminosity’s total watch time being generated by affiliated creators rather than competitive matches.