Global
Documents
State of the Market: Puzzle Games Q1 2023
This analysis examines the performance of the mobile puzzle gaming category during the first quarter of 2023, utilizing data from the Apptica platform across 35 countries. The study focuses on the Apple App Store and Google Play, evaluating key metrics including download volume, revenue generation, and advertising activity. The findings highlight a significant platform disparity, where Android accounts for 80% of total puzzle game downloads, yet iOS generates 56% of the category's total revenue.
Match 3 games maintain a dominant position within the puzzle sector, representing approximately one-third of all downloads and between 56% and 86% of revenue across the analyzed markets. On a broader industry scale, Match 3 titles account for 6% of all gaming downloads and share the second-highest revenue position at 9%, trailing only MMORPGs. While subgenres like Trivia, Merge, and Word games show regional variance in profitability, Bubble Shooter games demonstrate high download volume but contribute significantly less to total revenue.
Advertising remains a critical component of the puzzle category, which accounts for over 50% of ad traffic on iOS and more than 33% on Android. Leading titles such as Candy Crush Saga, Royal Match, and Gardenscapes consistently rank at the top for both downloads and revenue. Geographically, the United States leads in both download and revenue shares, while markets like Japan show a unique preference for Merge-style mechanics. Overall, the data underscores the continued maturity and high monetization potential of the puzzle genre within the global mobile gaming ecosystem.
- Match 3 games dominate the puzzle sector, accounting for one-third of all downloads and between 56% and 86% of total revenue across analyzed markets.
- There is a significant platform disparity where Android captures 80% of total puzzle game downloads, while iOS generates 56% of the category's total revenue.
- Puzzle games are a primary driver of mobile advertising, representing over 50% of ad traffic on iOS and more than 33% on Android.
- Match 3 titles hold a strong position in the broader gaming industry, comprising 6% of all gaming downloads and 9% of total revenue, second only to MMORPGs.
- Candy Crush Saga, Royal Match, and Gardenscapes are the consistent market leaders for both download volume and revenue generation.

H1 2023 Gaming Deals Report: Navigating Turbulence
The gaming industry experienced a significant contraction in deal-making activity during the first half of 2023, characterized by a challenging macroeconomic environment and a cooling of investor sentiment. The primary thesis of this analysis is that the sector is navigating a period of turbulence where high-value exits and late-stage investments have stalled, forcing companies to prioritize profitability, cost optimization, and internal restructuring over aggressive growth.
Key data points highlight a sharp decline across all major investment categories compared to the first half of 2022. Private investments fell to $1.5 billion across 239 deals, representing a substantial decrease in both volume and value. M&A activity saw an even more pronounced drop, with deal values plummeting as strategic investors shifted focus toward internal housekeeping and portfolio management. Public offerings remained largely muted, with companies increasingly opting to postpone listings due to unfavorable market conditions and valuation corrections. While early-stage venture capital remains the most resilient segment, it has also seen a shift in mindset, with startups moving away from "growth at all costs" toward sustainable business models.
The scope of this analysis covers global gaming industry transactions, including private investments, M&A, and public offerings, throughout the first half of 2023. The methodology relies on tracking closed transactions involving companies with core operations in the video game sector, excluding pure gambling, betting, and non-gaming blockchain entities. Data is synthesized from public media, S&P Capital IQ, and market insights to provide a comprehensive view of the industry's financial health. Despite the current downturn, the report identifies emerging interest in artificial intelligence as a potential driver for future deal activity, even as the broader market continues to face headwinds.
- H1 2023 saw a significant contraction in gaming deal-making, with private investments falling to $1.5 billion across 239 deals compared to the same period in 2022.
- M&A activity experienced a sharp decline as strategic investors prioritized internal restructuring and portfolio management over new acquisitions.
- Public offerings remained largely stagnant throughout the first half of 2023 due to unfavorable market conditions and necessary valuation corrections.
- The industry has shifted its primary focus from aggressive growth strategies to profitability, cost optimization, and sustainable business models.
- Early-stage venture capital remains the most resilient segment of the market, though startups are increasingly abandoning 'growth at all costs' mentalities.
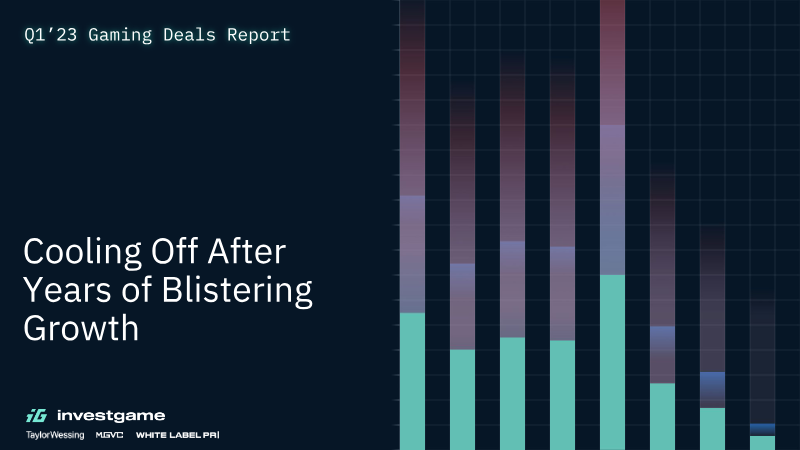
Q1 2023 Gaming Deals Report: Cooling Off After Years of Blistering Growth
The gaming industry experienced a significant cooling period in the first quarter of 2023, characterized by a sharp decline in deal activity across private investments, mergers and acquisitions (M&A), and public offerings. Following years of rapid expansion, the market has returned to more normalized levels as high interest rates and bearish public market conditions create a challenging environment for capital deployment. The analysis, which tracks closed transactions within the global video game industry, highlights a transition toward cautious investment strategies and a notable scarcity of late-stage funding.
Private investment activity remains the most resilient segment, though it has retreated from previous record highs. While early-stage funding continues to show robustness and serves as a primary driver for future industry unicorns, late-stage deals have stalled significantly, with only two closed transactions recorded in the quarter. Corporate investment activity has remained relatively stable compared to the previous year, though many participants have opted to keep deal values undisclosed. M&A activity reached a low point during the quarter, recording roughly half the volume of previous years, though early indicators suggest a potential rebound in subsequent periods driven by major strategic acquisitions.
Public offerings remain largely stagnant, with no immediate signs of recovery due to the prevailing macroeconomic climate. The methodology relies on tracking closed transactions—excluding pure gambling and non-gaming blockchain entities—using data from public media, business partners, and S&P Capital IQ. Despite the current downturn, the industry maintains a focus on early-stage development, with venture capital firms such as Andreessen Horowitz, Makers Fund, and BITKRAFT Ventures leading in deal volume and value. The overall outlook suggests a period of adjustment where market participants are prioritizing smaller, early-stage opportunities while navigating the uncertainties of the broader financial landscape.
- Q1 2023 marked a significant industry-wide cooling period, characterized by a sharp decline in private investments, M&A activity, and public offerings compared to previous years of rapid growth.
- M&A activity hit a low point in Q1 2023, recording approximately half the volume seen in previous years.
- Late-stage funding has stalled significantly, with only two closed transactions recorded throughout the entire first quarter.
- Private investment remains the most resilient segment, with early-stage funding continuing to show robustness despite a retreat from record-high deal volumes.
- Public offerings remain stagnant with no immediate signs of recovery, driven by high interest rates and bearish public market conditions.
Global Games Market Report: August 2023
The global games market is entering a period of recovery in 2023, characterized by a projected revenue of $187.7 billion and a total player base of 3.38 billion. This 2.6% year-on-year growth signals a stabilization following the post-pandemic market correction of 2022. While mobile gaming remains the largest revenue segment, console gaming serves as the primary catalyst for this year’s expansion, rebounding significantly from previous development delays. Looking toward 2026, the industry is expected to maintain this upward trajectory, with total revenues forecasted to reach $212.4 billion.
Regional performance remains uneven, as strong console demand in Western markets contrasts with slower growth in the Asia-Pacific region, where regulatory challenges in China continue to dampen momentum. To mitigate rising production costs and extended development cycles, studios are increasingly prioritizing live-service monetization models and integrating generative AI into their workflows. While these technologies offer potential for streamlined asset creation and prototyping, their long-term viability is complicated by unresolved legal and ethical concerns regarding copyright and intellectual property.
The industry is undergoing a structural shift toward digital-first engagement, evidenced by the continued decline of physical media and the rise of transmedia strategies and influencer-led development. Hardware diversification is also accelerating, with the emergence of complementary handheld devices expanding the reach of traditional platforms. Despite these advancements, specific genres are experiencing shifting player preferences; while adventure and shooter titles remain dominant, the battle royale genre is losing traction. Furthermore, the mobile sector faces persistent headwinds in monetization and user acquisition, largely driven by evolving privacy policies that have impacted the performance of previously lucrative genres like RPGs.
- The global games market is projected to reach $187.7 billion in 2023, reflecting a 2.6% year-on-year growth and a total player base of 3.38 billion.
- Console gaming is the primary driver of 2023 market expansion, rebounding from previous development delays to help push total industry revenues toward a forecasted $212.4 billion by 2026.
- Studios are increasingly adopting live-service monetization and generative AI to combat rising production costs and longer development cycles, despite ongoing legal and ethical uncertainties surrounding IP.
- Regional growth is uneven, with strong Western console demand contrasting with slower performance in the Asia-Pacific region due to regulatory challenges in China.
- The mobile gaming sector faces significant headwinds in user acquisition and monetization as evolving privacy policies negatively impact the performance of genres like RPGs.

The State of Puzzle Games: 2023
The puzzle game sector is undergoing a significant structural evolution, characterized by a shift in product models and monetization strategies. This analysis, covering global mobile market data from January 2018 through mid-2023, examines the performance of various sub-genres, including Swap, Blast, Merge, and Pair. The primary objective is to evaluate how developers are leveraging meta-features and hybrid monetization to sustain growth in a maturing market.
Key findings indicate that while traditional casual puzzle games continue to dominate total revenue, the hybridcasual model has emerged as a primary growth driver. Between early 2022 and early 2023, hybridcasual revenue surged by approximately 430%, signaling a departure from purely hypercasual, ad-supported frameworks. This transition is particularly evident in the Pair sub-genre, where hybridcasual revenue grew from 14.8% to 58.7% of the total within a single year. Conversely, many established sub-genres, such as Real-Time, Chain, and Bubble Shooter, experienced double-digit declines in both downloads and revenue during the same period.
Methodologically, the findings rely on consumer spending and download estimates from the Apple App Store and Google Play Store, excluding third-party Android marketplaces. The data highlights that successful titles increasingly integrate complex meta-features—such as narrative storytelling, decoration, and social clans—alongside diversified monetization tools like season passes and loot boxes. While casual games maintain the largest market share, the data suggests that future industry success depends on the ability to blend accessible gameplay with the deeper retention mechanics and hybrid revenue streams characteristic of the hybridcasual model.
- The hybridcasual model has become the primary industry growth driver, with revenue surging approximately 430% between early 2022 and early 2023.
- The Pair sub-genre experienced a significant shift toward hybridcasual monetization, which grew from 14.8% to 58.7% of its total revenue in just one year.
- Established sub-genres including Real-Time, Chain, and Bubble Shooter faced double-digit declines in both download volume and revenue throughout the 2022–2023 period.
- Successful puzzle titles are increasingly adopting complex meta-features such as narrative storytelling, decoration, and social clans to improve player retention.
- Monetization strategies are moving away from purely ad-supported frameworks toward diversified models that incorporate season passes and loot boxes.

Games & Interactive Salary & Satisfaction Survey 2023
The 2023 Games & Interactive Salary & Satisfaction Survey establishes that financial compensation has emerged as the primary catalyst for professional mobility within the global gaming industry. Driven largely by the prevailing cost of living crisis, employees are increasingly prioritizing salary increases when evaluating career moves. While monetary remuneration remains the dominant factor, non-monetary benefits such as flexible working arrangements, private healthcare, and robust pension schemes are essential for talent retention. The data indicates a high degree of industry volatility, with a significant portion of the workforce—particularly among programmers and artists—actively considering new employment opportunities throughout the year.
Geographically focused on the UK, Europe, and broader global markets, the findings underscore a fundamental shift in workplace expectations. Remote work has transitioned from a temporary accommodation to a standard requirement, with the vast majority of professionals now expecting at least one day of remote work per week. Despite this, a disconnect persists between employee needs and employer support. Many workers report inadequate institutional backing regarding mental health, neurodiversity accommodations, and financial pressures. Furthermore, project completion cycles serve as a major inflection point for retention, as employees frequently initiate job searches immediately following the conclusion of their current assignments.
Ultimately, the industry faces a complex retention landscape where high mobility is tempered by a desire for stability and work-life balance. Although a large percentage of the workforce is open to changing employers, many candidates decline offers that fail to meet specific salary thresholds or project-based interests. To remain competitive, organizations must reconcile the demand for flexible, remote-first environments with the necessity of addressing the financial and psychological well-being of their staff, particularly as project-based turnover continues to threaten long-term team cohesion.
- Financial compensation is the primary driver of professional mobility in the gaming industry, largely fueled by the global cost-of-living crisis.
- High workforce volatility persists, with programmers and artists showing the highest propensity to actively seek new employment opportunities throughout the year.
- Remote work has shifted from a temporary accommodation to a baseline industry requirement, with the majority of professionals now expecting at least one day of remote work per week.
- Project completion cycles are critical retention inflection points, as employees frequently initiate job searches immediately after finishing current assignments.
- A significant disconnect exists between employee needs and employer support regarding mental health, neurodiversity accommodations, and financial well-being.
From Hyper to Hybrid: 2023 Follow-up
The mobile gaming landscape experienced a notable shift in monetization and user acquisition patterns between 2022 and the first half of 2023. In-app purchase (IAP) activity demonstrated robust growth across both major mobile operating systems, with Android and Apple platforms recording increases of 23% and 24%, respectively. This upward trend in monetization suggests a resilient consumer base despite broader economic fluctuations within the mobile app ecosystem.
Geographic distribution of installs remained relatively stable on Android, with India, Brazil, and the United States maintaining their positions as the top three markets. Conversely, the iOS landscape underwent more significant regional changes, as the United Kingdom, Canada, and Germany gained prominence, displacing China and Saudi Arabia from the top five rankings. These shifts highlight the evolving importance of Western markets for iOS-based mobile game developers.
Ad network performance also saw a realignment in competitive dominance. On Android, Google Ads ascended to the top position for total installs in the first half of 2023, while Meta entered the top five. On iOS, AppLovin reclaimed the leading position, and Meta secured a top-five spot, reflecting a dynamic advertising environment where major platforms continue to vie for market share.
This analysis relies on anonymized data aggregated by Tenjin from January 1, 2022, through June 30, 2023. The findings are restricted to ad networks and countries that achieved a minimum threshold of 25 million installs, ensuring that the reported trends represent significant market activity. By tracking these metrics, the data provides a clear view of the shifting priorities and regional focus areas for mobile publishers navigating the transition toward hybrid monetization models.
- In-app purchase (IAP) activity grew significantly between 2022 and H1 2023, with revenue increasing by 23% on Android and 24% on Apple platforms.
- On iOS, the United Kingdom, Canada, and Germany have displaced China and Saudi Arabia in the top five markets for installs, signaling a pivot toward Western regions.
- Google Ads became the top-performing network for Android installs in H1 2023, while AppLovin reclaimed the leading position for iOS installs.
- Meta has successfully re-entered the top five ad networks for both Android and iOS, reflecting increased competition for market share among major advertising platforms.
- Android install distribution remained stable, with India, Brazil, and the United States continuing to hold the top three positions throughout the reporting period.

From Hyper to Hybrid in 2023
The report examines mobile advertising and in‑app purchase (IAP) trends across Android and iOS platforms from January 2022 through June 2023, focusing on the shift toward hybrid marketing strategies. Key findings show a 23 % rise in Android IAPs and a 24 % increase on Apple, indicating robust revenue growth for both ecosystems. Geographic analysis reveals that India, Brazil, the United States, Indonesia, and Mexico remain the top five Android install markets in both 2022 and H1 2023, while iOS installs shift from China and Japan in 2022 to Canada and Germany in H1 2023, underscoring changing regional appetites.
Ad network performance also evolved: Google Ads ascended to the top Android spot in H1 2023, overtaking AppLovin, while Meta entered the top five on both platforms. On iOS, AppLovin moved from second to first place, and Google Ads entered the top five for the first time. These shifts suggest advertisers are reallocating spend toward networks with stronger cross‑platform reach and data capabilities.
The methodology relies on anonymized Tenjin data collected between 1 January 2022 and 30 June 2023, with rankings limited to networks and countries exceeding 25 million installs. Tenjin positions itself beyond attribution, offering a data‑science platform, SKAdNetwork reporting, LTV analytics, automation APIs, and cost aggregation to support hyper‑growth for small and medium publishers. The report thus provides actionable insights into platform performance, regional dynamics, and network effectiveness for mobile marketers navigating the hybrid advertising landscape.
- In-app purchase revenue grew significantly between January 2022 and June 2023, with a 23% increase on Android and a 24% increase on iOS.
- Google Ads became the top-performing network for Android installs in H1 2023, while AppLovin rose to the number one position for iOS installs.
- Meta has successfully entered the top five ad networks on both Android and iOS platforms as of H1 2023.
- The top five Android install markets remained consistent from 2022 through H1 2023, led by India, Brazil, the United States, Indonesia, and Mexico.
- iOS install market focus shifted geographically between 2022 and H1 2023, moving away from China and Japan toward Canada and Germany.

2023 A Liftoff Company Midcore Gaming Apps Report
Midcore mobile games now represent roughly one‑third of U.S. iOS gaming revenue, a share that has expanded thanks to higher player engagement and diversified monetization streams. The average cost per install on iOS is about $2, roughly double the figure for casual titles, while Android users cost only $0.73 per install. Despite higher acquisition costs, day‑seven return on ad spend averages 4.3 % overall, with shooters and EMEA markets achieving the highest returns (6 % and 4.4 %, respectively). These figures underscore the importance of sustained LiveOps to maintain high lifetime value among midcore players.
Genre analysis shows that strategy games—particularly 4X‑build and battle titles—dominate the top‑grossing segment, accounting for seven of the ten highest‑earning iOS midcore games. Shooter titles such as Call of Duty: Mobile and PUBG Mobile anchor the shooter category, while Genshin Impact remains the sole RPG in the top‑ten. New releases that remain within the top 200 over a full year are almost exclusively midcore, highlighting their longer‑term engagement and monetization potential.
Publishers increasingly bypass Apple and Google storefronts, directing players to external web stores after the Epic‑Apple lawsuit opened that possibility. Leading titles—including Game of Thrones: Conquest, Clash of Clans, Star Wars: Galaxy of Heroes and Star Trek Fleet Command—use these sites to offer better‑priced bundles. Concurrently, top midcore games maintain high LiveOps activity, running an average of 15 simultaneous events such as PvP seasons and guild competitions to drive engagement and in‑app purchase revenue.
- Midcore mobile games now account for approximately one-third of U.S. iOS gaming revenue, driven by high player engagement and diversified monetization.
- Strategy games, specifically 4X-build and battle titles, dominate the top-grossing segment, claiming seven of the ten highest-earning iOS midcore games.
- Acquisition costs for midcore titles are significantly higher on iOS at $2 per install compared to $0.73 on Android, yet they achieve an average day-seven return on ad spend of 4.3%.
- Shooter titles and EMEA markets currently lead performance metrics, delivering the highest returns on ad spend at 6% and 4.4% respectively.
- Top-tier midcore games maintain engagement and revenue through intensive LiveOps, running an average of 15 simultaneous events like PvP seasons and guild competitions.

State of Mobile 2023
Global mobile usage reached a record in 2023, with users spending an average of more than five hours per day on apps and total advertising expenditure projected at $362 billion, reflecting an 18.5 % five‑year CAGR. While overall consumer spend dipped slightly in 2022, non‑gaming verticals—utilities, productivity tools, and OTT services—experienced robust growth in downloads (11 %), spend (9 %) and time‑spent (14 %). Gaming, by contrast, saw a 5 % decline in spend despite a surge to nearly 90 billion downloads, with RPGs dominating in‑app purchase revenue and hypercasual titles leading download volume. Creative sandbox games such as Roblox and Minecraft drove a 25 % rise in global playtime, whereas battle‑royale shooters fell by roughly 20 %, indicating a shift toward casual, creative experiences and age‑segmented targeting.
Social platforms continued to shape consumer spending patterns. TikTok surpassed all other non‑gaming apps with over $3 billion in 2022, achieving a 17 % year‑over‑year increase in total time spent and leading ARPU at approximately $0.85 per user; its revenue model relies heavily on high‑price in‑app purchases, while Snapchat’s earnings are largely subscription‑based. In the travel sector, airline and transportation apps such as Uber and Moovit dominated downloads across iOS and Google Play, with steady growth in North America and emerging markets like Mexico and Brazil. Sports‑focused apps remained fragmented yet profitable, driven by live‑score trackers and fan engagement platforms that generate high‑frequency usage.
Geographically, the top ten markets—China, India, the United States, Brazil, Indonesia and others—contributed the majority of downloads and spend, with pockets such as Mexico, Hong Kong and Brazil exhibiting 15–34 % year‑over‑year growth. The data underscore a continued dominance of mobile advertising, resilience of non‑gaming verticals amid economic headwinds, and the importance of diversified monetization strategies across social and gaming segments.
- Global mobile advertising expenditure is projected to reach $362 billion, maintaining an 18.5% five-year CAGR, while daily user engagement on apps has surpassed five hours.
- Non-gaming verticals showed resilience with 11% growth in downloads, 9% in spend, and 14% in time spent, contrasting with a 5% decline in gaming consumer spend despite nearly 90 billion downloads.
- TikTok leads non-gaming monetization with over $3 billion in 2022 revenue and an ARPU of approximately $0.85, driven by high-price in-app purchases.
- Gaming preferences are shifting toward creative sandbox titles like Roblox and Minecraft, which drove a 25% increase in global playtime, while battle-royale shooters experienced a 20% decline.
- Emerging markets including Brazil, Mexico, and Indonesia are key growth drivers, with specific regions exhibiting year-over-year download and spend growth between 15% and 34%.

2023 Games & Interactive Salary & Satisfaction Survey
The ninth‑year Games & Interactive Salary & Satisfaction Survey demonstrates that financial remuneration has become the predominant catalyst for career moves, eclipsing flexible or remote work as a primary motivator. Across the United Kingdom and Western Europe, 31 % of respondents cite higher pay as their main reason for leaving a position, while culture and benefits remain significant secondary drivers. In Eastern Europe, remote working is almost universal (91 %) yet salary still leads the list of motivations for job changes. The survey’s high response rate allows a granular view of compensation trends, revealing junior programmers earning £25‑£50 k globally and senior or managerial roles reaching up to £200 k in certain markets.
A notable trend is the heightened turnover during project close‑out periods, with 22 % of UK respondents declining offers to finish current projects and a global job‑hunt rate of 46 %. This suggests studios must strengthen retention strategies once projects conclude. Remote work expectations are high, with 92 % of global respondents anticipating at least one remote day per week, and flexible/remote working remains a top benefit sought (16‑19 % across regions).
Artist compensation has risen sharply, with average salaries increasing 35 % from 2021 to 2023. Mid‑level artists now earn around £75 k, while senior and lead roles approach £50 k. Remote work is preferred by 76 % of artists, and private health care (41 %) and pension plans (39 %) are the most valued benefits. Technical artists show lower job‑hunting activity compared to concept or character artists, indicating varying stability across creative roles. Overall, the survey underscores a cost‑of‑living pressure that prioritizes pay, while culture, flexibility, and robust post‑project retention remain critical for talent attraction and retention across the global games industry.
- Salary has overtaken flexible work as the primary driver for career moves, with 31% of UK and Western European respondents citing higher pay as their main reason for leaving a position.
- Artist compensation has seen a sharp 35% increase between 2021 and 2023, with mid-level artists now earning approximately £75k.
- Project close-out periods are a critical retention risk, as 22% of UK respondents decline new offers to finish current projects and 46% of global staff are actively job hunting.
- Remote work remains a baseline expectation for the industry, with 92% of global respondents requiring at least one remote day per week and 91% of Eastern European staff working remotely.
- Global compensation ranges are broad, with junior programmers earning between £25k–£50k and senior or managerial roles reaching up to £200k in specific markets.

From Hyper to Hybrid in 2023 (2023)
The report examines the evolving landscape of mobile gaming in 2023, focusing on the decline of pure hyper‑casual profitability and the rise of hybrid models that blend ad revenue with in‑app purchases. It attributes the downturn to factors such as iOS App Tracking Transparency, post‑COVID user behavior shifts, and stricter publisher gatekeeping that now demands “absolute hit” metrics. Consequently, developers increasingly self‑publish and diversify monetization strategies, incorporating IAPs and meta gameplay elements.
Key findings highlight that India leads in ad impressions and IAP volume, while the United States dominates eCPM earnings across both Android and iOS platforms. Apple Search Ads remains the top iOS ad network, securing three of the highest positions, whereas Applovin dominates Android advertising. In monetization channels, ironSource and Meta networks top the rankings for revenue generation on both operating systems. The data set spans global markets, covering major regions such as North America and Asia, and includes both Android and iOS ecosystems.
The methodology relies on Tenjin’s comprehensive data warehouse, aggregating millions of installs and ad impressions to produce rankings and predictive insights. The analysis integrates LTV prediction models, attribution visualization, and advanced metrics to provide actionable guidance for publishers transitioning from hyper‑casual to hybrid monetization strategies.
- The mobile gaming market is shifting away from pure hyper-casual models toward hybrid strategies that combine ad revenue with in-app purchases (IAP) to counter declining profitability.
- Profitability in the hyper-casual sector has been negatively impacted by iOS App Tracking Transparency, post-COVID user behavior shifts, and higher publisher thresholds for hit metrics.
- The United States leads global eCPM earnings across both Android and iOS, while India holds the top position for total ad impressions and IAP volume.
- Apple Search Ads is the dominant ad network on iOS, occupying three of the top-ranked positions, whereas Applovin leads the Android advertising landscape.
- IronSource and Meta are the top-performing networks for revenue generation across both Android and iOS operating systems.