Report31 pages
Motivations and Demographics Snapshot Report
The mobile gaming landscape in the United States is defined by a complex interplay between game mechanics and player psychology, categorized through a framework of twelve distinct motivational drivers. Analysis of the top 200 grossing titles reveals that while broad categories like Excitement and Thrill account for nearly a quarter of the market, the specific implementation of these drivers varies significantly across demographic lines. Younger male audiences typically engage with high-action PvP environments to satisfy mastery and competition, whereas players aged 45 and older gravitate toward progressive jackpots in social slots.
A significant shift in the casual gaming sector demonstrates the universal appeal of renovation and customization mechanics. Every top-100 grossing casual title released within the last two years has integrated renovation elements, signaling that Expression—the desire to customize and decorate—has become a fundamental requirement for modern engagement. This trend is particularly pronounced among female players, who show a strong preference for tycoon games and creative customization, while male players remain more focused on role-playing elements and reaction-based skill mastery.
Strategic drivers such as Management and Exploration show varying levels of market penetration. While Exploration is widely utilized through gacha mechanics and sandbox discovery, Management remains a specialized niche dominated by 4X strategy titles, which account for 70% of that segment. These findings underscore the necessity for developers to align specific gameplay features with the nuanced motivational profiles of their target age and gender groups to achieve commercial success in the competitive US mobile market.
- Renovation and customization mechanics are now a fundamental requirement for casual gaming, appearing in 100% of the top-100 grossing casual titles released in the last two years.
- Motivational drivers for US mobile gaming are highly demographic-specific, with younger males prioritizing mastery and competition in PvP, while players aged 45 and older favor social slots.
- The 'Expression' driver, centered on customization and decoration, is a primary engagement factor particularly among female players who show a strong preference for tycoon and creative titles.
- Excitement and Thrill-based mechanics account for nearly 25% of the market across the top 200 grossing titles.
- The Management genre is a specialized niche in the US market, with 4X strategy titles currently controlling 70% of that segment.
+1
GameRefineryFeb 2022
Report230 pages
Türkiye Game Market 2022 Report
The 2022 Turkish gaming market represents a landscape of significant resilience and structural transition. Despite facing substantial economic headwinds, including currency depreciation and a contraction in total revenue to $625 million, the industry solidified its position as a major global hub for mobile development and esports. The primary thesis of the market’s evolution is a strategic pivot away from the rapid, volume-based "gold rush" of hyper-casual gaming toward sustainable, high-quality production, intellectual property creation, and diversification into PC, console, and hybrid-casual projects.
The sector’s maturity is evidenced by record-breaking investment activity, with over $424 million raised across 23 deals, positioning Istanbul as a top-tier global city for gaming capital. This financial influx supports a robust ecosystem of nearly 6,000 publishers and a growing network of entrepreneurship centers and academic programs. While the number of new startups declined by 48% compared to the previous year, the remaining entities are increasingly focused on long-term viability through technological integration, including AI and gamification, as well as a professionalized esports infrastructure that saw the Turkish Esports Federation gain official status.
Geographically and demographically, the market remains highly engaged, with 44 million players and a notable shift toward high-income consumer segments. While traditional physical venues like internet cafes have contracted due to rising operational costs, the digital infrastructure remains strong, supported by widespread social media penetration and a sophisticated network of payment institutions. Moving forward, the industry’s trajectory is defined by a need for better alignment between academic curricula and commercial requirements, alongside a continued focus on global expansion and the development of specialized talent to maintain Türkiye’s competitive edge in the international gaming arena.
- The Turkish gaming market generated $625 million in 2022, reflecting a structural pivot from hyper-casual volume toward sustainable, high-quality PC, console, and hybrid-casual intellectual property.
- Investment activity reached a record $424 million across 23 deals, establishing Istanbul as a premier global hub for gaming capital.
- While the number of new gaming startups fell by 48% year-over-year, the remaining 6,000 publishers are increasingly prioritizing long-term viability through AI integration and professionalized operations.
- The Turkish gaming ecosystem serves a highly engaged base of 44 million players, characterized by a growing shift toward high-income consumer segments.
- The Turkish Esports Federation achieved official status in 2022, signaling the professionalization of the country's esports infrastructure despite the decline of traditional physical venues like internet cafes.
+2
Riot GamesJan 2022
Report40 pages
2022 The Israeli Mobile Game Market Report
The Israeli mobile gaming sector has solidified its position as a premier global hub, characterized by a robust ecosystem of approximately 200 companies and 14,000 employees. Generating $9 billion in annual revenue, the industry has experienced extraordinary growth, with total earnings increasing by 760% since 2016. This expansion, accelerated by pandemic-era shifts in consumer behavior, is anchored by major developers such as Playtika, Plarium, and Moon Active, who maintain a strategic focus on the social, casual, and hyper-casual genres.
Despite this financial success, the advertising landscape underwent significant volatility in 2022. Total ad creatives declined by 17.8% year-over-year, even as the number of active advertisers grew by 4.2%. This contraction was most pronounced within the RPG segment, while casual and puzzle titles maintained dominance. A pivotal shift in platform strategy has emerged, with Android now capturing 70% of all mobile game advertising, a trend largely attributed to Apple’s IDFA privacy changes. Video content remains the industry standard, accounting for over 86% of all creative output.
Global marketing strategies have become increasingly localized to meet regional preferences, ranging from live-action influencer content in the United States to character-centric assets in Japan and high-fidelity technology showcases in South Korea. Furthermore, creative trends are evolving away from traditional failure-based hyper-casual tropes toward more positive, success-oriented gameplay. While the Israeli market continues to demonstrate immense scale and innovation, the industry faces ongoing structural challenges, specifically regarding the availability of venture funding and the persistent shortage of skilled human resources required to sustain long-term growth.
- The Israeli mobile gaming industry has grown by 760% since 2016, reaching $9 billion in annual revenue across a ecosystem of 200 companies and 14,000 employees.
- Android now accounts for 70% of all mobile game advertising, a shift driven by Apple’s IDFA privacy changes.
- Despite a 4.2% increase in the number of active advertisers, total ad creative volume declined by 17.8% in 2022, with the sharpest contraction occurring in the RPG segment.
- Video content remains the dominant advertising format, representing over 86% of all creative output in the industry.
- Major developers like Playtika, Plarium, and Moon Active continue to anchor the market by focusing on social, casual, and hyper-casual genres.
+2
SocialPetaJan 2022
Report42 pages
The State of Mobile Game and App Markets: H1 2022
The mobile app and gaming landscape underwent a significant strategic pivot during the first half of 2022, characterized by a transition from high-volume advertising to a quality-focused, data-driven methodology. Faced with rising user acquisition costs and the restrictive post-ATT environment, marketers reduced the total volume of mobile game creatives by nearly 30% year-over-year. This contraction reflects a broader industry shift toward precise traffic optimization, where performance metrics like Cost Per Purchase and In-App Purchase Return on Ad Spend have superseded raw install volume as the primary indicators of success.
Geographically, the United States remains the dominant market, commanding the highest share of traffic and the most expensive advertising costs. CPMs surged significantly during this period, rising 18% for mobile games and 64% for non-gaming applications. In response to these economic headwinds and privacy-related tracking limitations, advertisers have increasingly pivoted toward the Android ecosystem, which now hosts approximately 70% of mobile game creatives. Simultaneously, growth is being sought in emerging Tier-2 and Tier-3 markets to offset the saturation and high costs found in traditional Western strongholds.
To maintain performance, publishers are diversifying their acquisition channels, moving beyond traditional social media giants to include incentive-based traffic sources and search-driven discovery. App Store Optimization and Apple Search Ads have become critical components of visibility strategies, while the adoption of predictive analytics and first-party data collection allows developers to navigate the loss of IDFA-based targeting. By prioritizing user-generated content styles and optimizing opt-in prompts, which have reached success rates as high as 51% in certain hyper-casual segments, the industry is successfully recalibrating its approach to sustain long-term growth despite a challenging macroeconomic climate.
- Marketers reduced mobile game creative volume by nearly 30% year-over-year in H1 2022, shifting focus from raw install volume to performance metrics like Cost Per Purchase and In-App Purchase Return on Ad Spend.
- Advertising costs rose significantly, with CPMs increasing 18% for mobile games and 64% for non-gaming applications.
- Advertisers are increasingly prioritizing the Android ecosystem, which now accounts for approximately 70% of all mobile game creatives.
- To mitigate high costs and market saturation in the U.S., publishers are expanding into emerging Tier-2 and Tier-3 geographic markets.
- Publishers are diversifying beyond traditional social media channels, placing greater strategic emphasis on App Store Optimization, Apple Search Ads, and search-driven discovery.
+3
AdQuantumJan 2022
Report51 pages
Global Esports & Live Streaming Market Report 2022
The global esports and live streaming industry is undergoing a period of robust expansion, with total esports revenue projected to reach $1.38 billion in 2022 and an audience base of 532 million people. This growth trajectory is expected to continue, with market valuations potentially hitting $1.86 billion by 2025. While sponsorship remains the dominant revenue stream, accounting for nearly 60 percent of total earnings, the industry is actively diversifying its financial models. Organizations are increasingly pivoting toward direct-to-fan strategies, including digital merchandise, loyalty programs, and educational initiatives, to mitigate risk and transition toward sustainable, lifestyle-oriented business models.
The live streaming sector serves as a critical pillar of this ecosystem, with its audience projected to grow to 1.41 billion by 2025. Market dominance is currently split between major platforms like Twitch, YouTube Gaming, and Facebook Gaming, each leveraging distinct regional strengths. Twitch maintains a stronghold in Western PC and console markets, whereas YouTube and Facebook are capitalizing on the rapid proliferation of mobile gaming in emerging economies. These platforms are further evolving by integrating non-gaming content and interactive features to enhance user retention and broaden monetization opportunities.
Despite the positive outlook, the industry must navigate potential volatility stemming from shifting media consumption habits, evolving publisher investment strategies, and the lingering economic effects of the pandemic. Nevertheless, the sector remains highly attractive to stakeholders due to its core demographic of young, high-income professionals. As the market matures, the integration of co-streaming and the expansion into emerging regions—supported by localized platforms—will be essential for maintaining long-term growth and fostering deeper engagement with a global, digitally native audience.
- Global esports revenue is projected to reach $1.38 billion in 2022, with a total audience of 532 million, and is expected to grow to $1.86 billion by 2025.
- Sponsorship currently accounts for nearly 60% of total esports revenue, though organizations are shifting toward direct-to-fan models like digital merchandise and loyalty programs to improve financial sustainability.
- The live streaming audience is forecast to reach 1.41 billion by 2025, driven by the integration of non-gaming content and interactive features to boost user retention.
- Market dominance in live streaming is split between Twitch, which leads in Western PC and console markets, and YouTube Gaming and Facebook Gaming, which are capturing growth in mobile-first emerging economies.
- The industry remains highly attractive to stakeholders due to its core demographic of young, high-income professionals.
+3
NewzooJan 2022
Report18 pages
Consumer Insights: Games and Esports 2022
The Consumer Insights: Games and Esports 2022 report provides a comprehensive analysis of global gaming behaviors, motivations, and market engagement. The primary purpose of the research is to equip game developers, publishers, and industry stakeholders with actionable data to benchmark titles, understand player demographics, and identify growth opportunities across 36 diverse international markets. By examining over 100 key performance indicators, the analysis offers a granular view of how players interact with PC, console, and mobile platforms.
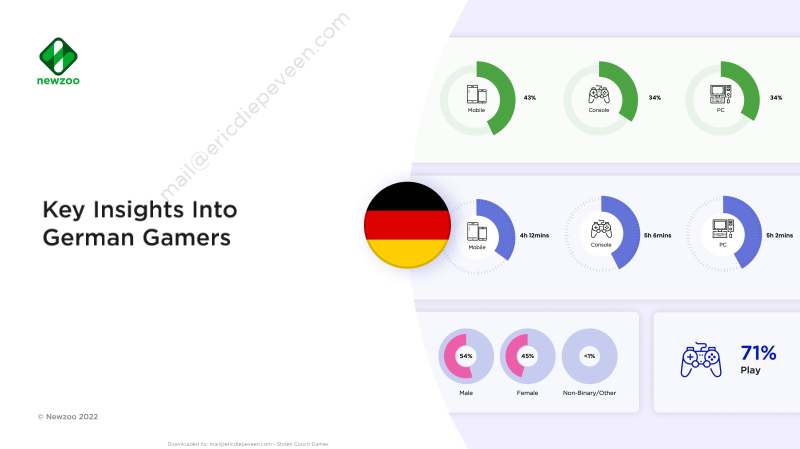
The research is underpinned by a robust methodology, drawing on survey data from over 75,000 consumers worldwide. The findings highlight distinct engagement patterns, such as the prevalence of specific gaming personas—notably Time Fillers and Mainstream Gamers—and the interplay between playing and viewing habits. For instance, data from the German market indicates that while playing remains the dominant activity, a significant portion of the population also engages with gaming video content and esports. Furthermore, the report identifies key drivers for consumer spending, noting that price sensitivity, the desire for exclusive content, and social connectivity are primary motivators for financial investment in games.
Covering a broad geographic scope that includes North America, Europe, Latin America, the Middle East, and the Asia-Pacific region, the report serves as a strategic tool for navigating the complex global gaming landscape. By synthesizing metrics such as monthly active users, daily active users, and lifetime player value, the analysis facilitates a deeper understanding of the motivations driving player behavior. Ultimately, the findings emphasize that a nuanced approach to audience segmentation and platform-specific engagement is essential for companies seeking to reach and retain diverse gaming populations in an increasingly competitive entertainment market.
- The research is based on a global dataset of over 75,000 consumers across 36 international markets, covering North America, Europe, Latin America, the Middle East, and the Asia-Pacific region.
- Consumer spending is primarily driven by three factors: price sensitivity, the desire for exclusive content, and the need for social connectivity.
- Gaming engagement is categorized into distinct personas, with 'Time Fillers' and 'Mainstream Gamers' identified as the most prevalent segments.
- Player behavior analysis utilizes over 100 key performance indicators, including monthly active users (MAU), daily active users (DAU), and lifetime player value (LPV).
- Engagement patterns in markets like Germany demonstrate that gaming video content and esports are significant activities that complement traditional gameplay.
+5
NewzooJan 2022
Whitepaper106 pages
2022 Global White Paper on Mobile Advertising & Marketing
The 2022 global mobile gaming landscape underwent a significant transition toward quality and strategic refinement, characterized by a 2% decline in total advertisers and a 27.83% reduction in ad creatives during the first half of the year. This contraction in mature markets was offset by robust growth in emerging regions such as the Middle East, South America, and South Asia, where increasing smartphone penetration and young demographics present substantial expansion opportunities. The industry’s primary thesis centers on the necessity of localized, narrative-driven content and creative optimization to navigate a post-IDFA privacy environment that has increased advertising costs and shifted focus toward Android platforms.
While casual, puzzle, and simulation genres dominate download volumes, RPGs and strategy titles remain the primary revenue drivers, commanding the highest advertising costs with average CPMs reaching $21.58. Video remains the dominant creative format, accounting for over 86% of all advertisements, as marketers increasingly leverage dramatic storytelling and influencer-led content to boost engagement. Despite the industry’s fascination with emerging technologies, consumer sentiment remains grounded; only 16% of players express interest in NFT-based gaming, whereas up to 39% show interest in metaverse-integrated experiences. Most users continue to prioritize mobile games as accessible tools for relaxation and time-killing.
To sustain growth, publishers are pivoting toward programmatic channels, OEM integrations, and culturally relevant marketing strategies. Success in this competitive landscape requires a dual approach: maintaining high-frequency engagement through playable and video-based ads while simultaneously adapting to regional preferences, such as the demand for vernacular content in India or MOBA-focused titles in Southeast Asia. Ultimately, the market is moving away from broad-spectrum advertising toward highly targeted, immersive, and quality-focused campaigns that align with the core motivations of diverse global player bases.
- The mobile gaming market is shifting toward quality over volume, evidenced by a 2% decline in total advertisers and a 27.83% reduction in ad creatives during the first half of 2022.
- RPG and strategy titles remain the primary revenue drivers, commanding the highest advertising costs with average CPMs reaching $21.58.
- Video is the dominant advertising format, accounting for over 86% of all ad creatives as marketers prioritize dramatic storytelling and influencer-led content.
- Growth in mature markets is slowing, forcing publishers to expand into emerging regions like the Middle East, South America, and South Asia to capitalize on rising smartphone penetration.
- Consumer interest in gaming technology is polarized, with only 16% of players interested in NFTs compared to 39% expressing interest in metaverse-integrated experiences.
+3
SocialPetaJan 2022
Report56 pages
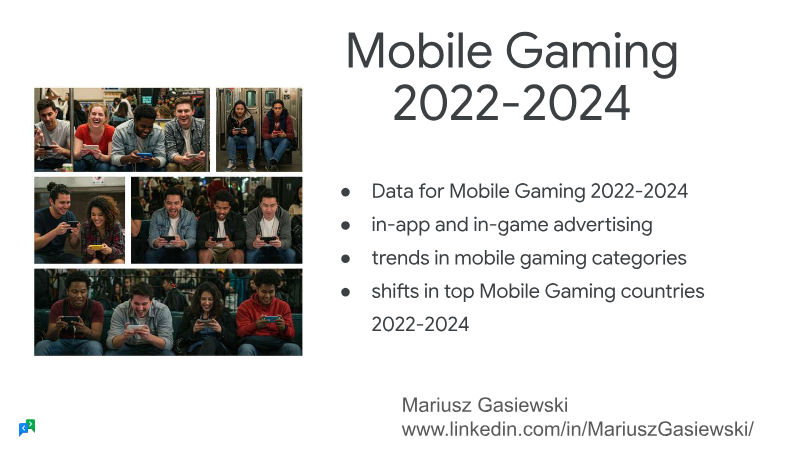
Data for Mobile Gaming 2022-2024
Mobile gaming maintains its position as the primary driver of industry expansion, fueled by widespread smartphone adoption and consistent engagement across both emerging and established markets. Between 2022 and 2024, the sector has demonstrated a clear trend where revenue growth consistently outpaces download volume on both iOS and Android platforms. This financial trajectory is increasingly supported by a strategic shift toward in-game advertising, which is currently outpacing traditional in-app purchases as a primary revenue stream.
Global market dynamics remain anchored by the United States, China, and Japan, which continue to serve as the most significant revenue generators. However, emerging markets are playing an increasingly critical role in the industry’s growth, particularly in regions like Brazil, where smartphone gaming penetration has surpassed 90% across all demographics. In these regions, player behavior is heavily influenced by free-to-play accessibility, narrative depth, and social recommendations. Furthermore, data from the U.S. and U.K. confirms that younger demographics prioritize smartphones over consoles and PCs, solidifying the mobile device as the central hub for modern gaming.
Despite the proliferation of available titles, the global player base exhibits a preference for focused engagement, with many users choosing to dedicate their time to a single game rather than managing multiple titles simultaneously. While market concentration among top-tier publishers remains stable, the rapid expansion of the advertising sector suggests a fundamental change in how developers monetize their audiences. Ultimately, the industry is transitioning toward a model that prioritizes long-term retention and diversified revenue streams over simple volume-based growth, ensuring that mobile gaming remains the most influential segment of the broader interactive entertainment landscape.
- Mobile gaming revenue growth is consistently outpacing download volume across iOS and Android platforms between 2022 and 2024.
- In-game advertising has overtaken traditional in-app purchases as the primary revenue stream for mobile developers.
- The United States, China, and Japan remain the dominant global revenue generators, while Brazil has reached over 90% smartphone gaming penetration across all demographics.
- Younger demographics in the U.S. and U.K. are increasingly prioritizing smartphones over consoles and PCs as their primary gaming platform.
- Player behavior is shifting toward focused engagement, with users increasingly dedicating their time to a single title rather than managing multiple games.
+2
GoogleJan 2022
Report17 pages
The Hyper-Casual Benchmark Report: Q3 2022
The hyper-casual mobile gaming sector experienced a notable escalation in acquisition costs during the latter half of 2022, characterized by rising median cost-per-install (CPI) rates across both Android and iOS platforms. By the fourth quarter of 2022, median CPI reached all-time highs of $0.20 on Android and $0.42 on iOS. This upward trend in acquisition spending was global, as no major market tracked by ad spend experienced a decrease in median CPI on Android, while iOS markets saw varied fluctuations, including a significant decrease in the United States and notable increases in France and Germany.
Retention metrics reveal a consistent performance advantage for iOS over Android across all tiers of game quality. For the top 2% of hyper-casual titles, iOS achieved a 45% Day 1 retention rate compared to 38% on Android, with Day 7 retention figures similarly favoring iOS at 19% versus 14%. This performance gap persists among the top 25% of games and the median cohort, where iOS maintains a higher percentage of returning players. These findings underscore a widening disparity between high-performing titles and average games, emphasizing the critical importance of engagement optimization in a landscape of increasing user acquisition costs.
The analysis draws upon data from over 100,000 games and one-third of the global mobile player base to establish these benchmarks. By segmenting performance by platform and geographic region, the data highlights the shifting economic landscape for developers and publishers. The findings suggest that while market saturation and rising costs present significant challenges, the ability to maintain player retention remains the primary differentiator between top-tier hyper-casual games and the broader market.
- Retention is the primary differentiator for success, with top-tier hyper-casual games significantly outperforming the median cohort as acquisition costs rise.
- Median cost-per-install (CPI) reached record highs in Q4 2022, hitting $0.20 on Android and $0.42 on iOS.
- iOS consistently outperforms Android in retention, with top-tier titles achieving 45% Day 1 retention on iOS compared to 38% on Android.
- Day 7 retention metrics show a persistent gap between platforms, with top-tier iOS titles retaining 19% of players versus 14% on Android.
- Rising acquisition costs are a global trend, as no major Android market tracked in the report experienced a decrease in median CPI during the period.
+5
TenjinJan 2022

Report67 pages
The State of Mobile Gaming: Market Trends and Top Titles in the U.S., Europe, and Asia 2022
The analysis demonstrates that the global mobile‑gaming market entered a contraction phase in early 2022, with revenue falling 6 % year‑over‑year and the first decline since 2019. The United States and Japan, historically dominant markets, experienced double‑digit drops in consumer spending—particularly a 22 % decline on Google Play in the U.S.—while emerging APAC regions such as India, Brazil, and Vietnam captured growing market share. Download volumes remained steady at roughly 14 billion worldwide; India retained the largest install base but is losing ground to Brazil, which is poised to overtake it.
Regional dynamics reveal divergent trends. Europe’s spending rose 18 % to $8.6 B, driven largely by hyper‑casual titles and rapid growth in Turkey (6 % YoY) and Poland (8 % YoY). In contrast, Asia’s revenue fell 7 % to $11.2 B, with China and Japan maintaining top positions but India’s spending accelerating despite lower monetisation rates. Genre‑level data shows a decline across the five largest categories, yet strategy games remain the strongest, generating over $4 B quarterly since late 2020. Hyper‑casual installs surged to 3.5 billion, accounting for 32.5 % of all downloads, while puzzle and arcade titles saw double‑digit revenue drops.
Monetisation strategies continue to evolve. Gacha mechanics dominate the mid‑core segment, often combined with season passes, subscriptions, or live‑ops to boost spend. Season passes have proven effective beyond shooters, doubling weekly revenue for titles such as Lords Mobile and revitalising legacy games like Hay Day. The data underscores the necessity of flexible, hybrid monetisation models—particularly in markets where overall genre revenues are contracting—to sustain profitability across diverse player bases.
- The global mobile gaming market experienced its first revenue decline since 2019, contracting 6% year-over-year in early 2022.
- Consumer spending in the U.S. and Japan saw double-digit drops, including a 22% decline on Google Play in the U.S., while emerging markets like Brazil and Vietnam gained significant share.
- Europe bucked the global trend with an 18% revenue increase to $8.6 billion, fueled by growth in Turkey and Poland and the popularity of hyper-casual titles.
- Hyper-casual games accounted for 32.5% of all global downloads, reaching 3.5 billion installs, while strategy games remained the highest-earning category with over $4 billion in quarterly revenue.
- Hybrid monetisation models are essential for profitability, as evidenced by the success of season passes in revitalizing legacy titles like Hay Day and boosting revenue for Lords Mobile.
Sensor TowerJan 2022
Report62 pages
State of Mobile India 2022
India’s mobile ecosystem in 2021 experienced a surge of activity, with total app downloads reaching 26.7 billion—a 41 % increase from the previous year—and Android users spending an average of 4.7 hours per day on apps, up 27 % from 2019. Consumer spend hit $417 million, positioning India as a dominant force in global downloads (10 % of worldwide figures) and driving significant growth in finance (+27 %) and medical (+38 %) categories. The country’s high usage time and spend levels make it a key growth engine for advertisers and developers.
Gaming shifted sharply toward hyper‑casual titles, which now dominate worldwide downloads. In 2021, hyper‑casual action and puzzle games generated over $5 billion in consumer spend, while strategy‑based “4× March‑battle” games captured nearly $10 billion in revenue. These trends highlight a pivot toward low‑friction, highly engaging experiences that accelerate user acquisition and monetization.
Food & drink apps saw explosive growth, with user sessions rising 33 % YoY to 12.1 billion in Q4 2021 after a pandemic dip. Rapid‑delivery services such as Zepto, Getir, Gorillas and Flink experienced double‑digit download surges, driven by international expansion and hyper‑fast grocery models. Brand‑centric searches dominate India’s market, while generic terms (“food”, “delivery”, “coffee”) rise in emerging regions, indicating a blend of branded and discovery‑driven usage.
Travel and rideshare apps rebounded strongly in H2 2021. India alone accounted for 259.5 million travel‑app downloads, up 15 million from H2 2020, while global downloads approached pre‑pandemic levels at 1.95 billion versus 2.08 billion in H2 2019. Rideshare demand recovered sharply, with rider sessions outnumbering driver sessions by roughly 3:1 in key markets such as the US, UK, and India. Travel apps and on‑demand transport services are regaining traction, with India playing a pivotal role in the global rebound.
In 2021, the most downloaded and highest‑spending apps in India included Google Pay, Instagram, Flipkart, Jio MyJio and Hotstar. In gaming, Free Fire (Tencent), Call of Duty: Mobile (Activision Blizzard) and Gardenscapes – New Acres (Playrix) led downloads, with Free Fire and Call of Duty: Mobile also topping spend charts. These figures underscore India’s status as a leading mobile market across diverse verticals and user segments.
- India’s mobile market saw 26.7 billion app downloads in 2021, a 41% year-over-year increase, with Android users spending an average of 4.7 hours per day on apps.
- Gaming revenue is driven by two distinct models: hyper-casual action and puzzle games generated over $5 billion globally, while strategy-based '4× March-battle' games captured nearly $10 billion.
- Food and drink app engagement in India surged 33% year-over-year to 12.1 billion sessions in Q4 2021, fueled by the rapid adoption of hyper-fast grocery delivery models.
- Travel and rideshare sectors are recovering toward pre-pandemic levels, with India recording 259.5 million travel app downloads in H2 2021 and a 3:1 ratio of rider-to-driver sessions in key markets.
- India’s consumer spending hit $417 million in 2021, with significant growth in finance (+27%) and medical (+38%) categories.
+1
IntelJan 2022
Report61 pages
State of Mobile Indonesia 2022
Indonesia’s mobile ecosystem expanded rapidly in 2021, with users downloading 7.31 billion apps and spending 532 million hours gaming—a 33 % rise in downloads and a 38 % jump in playtime over two years. Daily mobile usage climbed to 5.4 hours per user, while gaming apps alone accounted for 325 million downloads and generated $1,000 per minute of waking‑hour engagement. The overall market grew 20 % YoY, driven largely by hyper‑casual titles and a surge in app‑store consumer spend.
Gaming remained the dominant category, with hyper‑casual action and puzzle games surpassing 5 B downloads worldwide in 2021. The most lucrative genre, 4×‑march‑battle strategy games, produced $10 B in consumer spend. Finance apps also experienced explosive growth; Indonesia’s finance‑app downloads rose 82 % YoY to 400 M, and neobanks such as Jenius saw a 12 % increase in monthly active users, indicating deeper penetration into underbanked populations.
Mobile video‑streaming and food‑delivery apps surged, driven by exclusive content and rapid delivery models. Netflix achieved over one million local downloads in more than 60 countries, while Indonesia’s food‑delivery sessions grew 480 % YoY to roughly six billion, with a ninefold increase in app usage. Grab Eats and Gojek dominated the market, underscoring the importance of localized programming and ultra‑fast delivery for capturing highly engaged consumers.
Travel, dating, and sports apps rebounded strongly after pandemic restrictions. Travel app downloads reached 1.95 billion in H2 2021, nearly pre‑pandemic levels, with Traveloka leading the market. Global dating spend hit $5 billion, driven by growth in the US, Japan, UK, and China. Sports app engagement rose 30 % worldwide, with Indonesian time‑spend up 90 %, reflecting a broader shift toward lifestyle, social, and health‑related mobile services as consumers return to pre‑pandemic behaviors.
The market was dominated by casual and social‑gaming titles such as Higgs Domino, Free Fire, and Mobile Legends: Bang Bang, which topped downloads, spend, and MAU charts. Leading publishers were primarily Chinese (ByteDance/TikTok, Tencent) and US‑based Meta/Facebook, while local brands like Shopee and Lazada drove spend. Overall, the data highlight a strong preference for free‑to‑play games and social media apps, with significant consumer spending concentrated in a handful of high‑profile titles.
- Indonesia’s mobile market saw 7.31 billion app downloads and 532 million hours of gaming in 2021, with daily usage reaching 5.4 hours per user.
- Gaming remains the dominant category, with 325 million downloads generating $1,000 per minute of engagement, led by titles like Higgs Domino, Free Fire, and Mobile Legends: Bang Bang.
- Finance app adoption surged 82% year-over-year to 400 million downloads, with neobanks like Jenius recording a 12% increase in monthly active users.
- Food-delivery app sessions in Indonesia grew 480% year-over-year to approximately six billion, with Grab Eats and Gojek maintaining market dominance through rapid delivery models.
- Travel app downloads recovered to 1.95 billion in H2 2021, while sports app engagement in Indonesia increased by 90%, signaling a return to pre-pandemic lifestyle behaviors.
data.aiJan 2022
Report12 pages
Modern Mobile Consumer 2022: App Monetization Report
The report examines how modern mobile consumers interact with app monetization, revealing that rewarded ads and in‑app purchases (IAP) coexist without cannibalizing revenue. Surveying 30,457 participants—18,894 from gaming apps and 11,563 from non‑gaming apps on the ironSource network, plus a 500‑person control group outside MobileVoice®—the study covers North America and global markets from April to May 2022. Respondents were verified as adults and opted in for virtual rewards, ensuring engagement accuracy.
Key findings show an almost even split between IAP and ad‑supported preferences across both gaming and non‑gaming audiences. Generation X favors occasional or frequent IAP yet prefers ad support overall, while 24% of Gen Z would pay a one‑time fee to remove ads. Approximately one third of users make occasional IAPs, a significant rise from the 2‑3% noted five years earlier. Free apps with IAP dominate downloads (52% of gaming users), and 15‑17% of consumers now spend more on IAPs than five years ago.
Methodologically, the study combined custom MobileVoice® surveys with third‑party polling (Pollfish) to mitigate bias. Data were analyzed using ironSource’s Offerwall and native survey offers, with age verification and global reach.
The report concludes that diversified monetization strategies—balancing ads, IAPs, and optional removal fees—are essential to meet evolving consumer expectations. It recommends audience‑specific research, price optimization, and value bundle offerings to maximize revenue while preserving user experience.
- Rewarded ads and in-app purchases (IAP) do not cannibalize each other, allowing for a hybrid monetization strategy that maximizes revenue without sacrificing user experience.
- The percentage of users making occasional IAPs has grown significantly to approximately one-third of the total user base, up from 2-3% five years ago.
- Free apps with IAP are the dominant model, accounting for 52% of all gaming app downloads.
- Consumer spending on IAPs has increased, with 15-17% of users reporting higher expenditure compared to five years ago.
- While preferences are split between IAP and ad-supported models, 24% of Gen Z users are specifically willing to pay a one-time fee to remove advertisements.
+2
ironSourceJan 2022
Report48 pages
Market Outlook 2022
The analysis outlines a 2022 outlook for the global mobile‑gaming market, emphasizing that quarterly installs have plateaued at roughly 14 billion after a pandemic‑driven surge, with casual titles still accounting for about 80 % of downloads. Revenue dynamics have shifted: mid‑core games now generate 60 % of total earnings, while overall mobile‑game revenue fell 7 % year‑over‑year in Q1 2022, marking the first decline since the industry’s rapid expansion. The United States remains the largest spend market, yet Asia‑Pacific regions—especially Taiwan and Brazil—exhibit the fastest growth rates.
Advertising spend analysis reveals that role‑playing games dominate iOS channels, with YouTube capturing an 8.2 % share of voice and exceeding 10 % in Q2 2022; Android spend lags across all networks. Card‑battler titles emerge as the fastest‑growing sub‑genre, driven largely by Japan and China, which together account for 62 % of player spending. Yu‑Gi‑Oh! Master Duel leads launch revenue, reaching $80 million in five months and achieving a worldwide revenue per day of $20—twice that of its nearest competitor. MMORPGs hold the second‑largest spending position globally, with Diablo Immortal topping U.S. spend at $22 million in H1 2022 and maintaining a modest 10 % share of U.S. MMORPG installs.
In the United States, Diablo Immortal generated over $30 million in its first six weeks and captured 3.2 % of mid‑core revenue, yet U.S. players still lag behind Asian markets where Lineage M and Odin: Valhalla Rising amassed $225–$350 million in the same period. The report underscores that U.S. MMORPG revenue represents only about 4 % of the global total, highlighting the critical need for localized market strategies in future mobile RPG releases.
- Global mobile-game revenue declined 7% year-over-year in Q1 2022, marking the first such contraction after a period of rapid expansion.
- Quarterly mobile-game installs have plateaued at approximately 14 billion, with casual titles continuing to represent 80% of total downloads.
- Mid-core games now drive 60% of total mobile-game earnings, despite the U.S. market accounting for only 4% of global MMORPG revenue.
- Card-battler titles are the fastest-growing sub-genre, with Japan and China accounting for 62% of global player spending in this category.
- Yu-Gi-Oh! Master Duel achieved $80 million in revenue within five months, maintaining a daily revenue of $20 per player—double that of its nearest competitor.
+1
Sensor TowerJan 2022
Report24 pages
Games: India Plays!
The report examines the rapidly expanding Indian mobile gaming market, highlighting a projected 91 % share of online gamers playing on smartphones and an estimated revenue of US$2.2 billion in 2022, with a projected average revenue per user of US$1.5 by 2027. It distinguishes between non‑real‑money gaming (non‑RMG) and real‑money gaming (RMG), focusing on the top five non‑RMG genres—Adventure, Battle Royale, Puzzle, Arcade, and Racing—and key RMG categories such as card‑based games, sports‑fantasy, and casual RMG. Data sourced from Newzoo consumer research and MAAS campaign analytics reveal that 62 % of non‑RMG players are male, while RMG users skew slightly more balanced at 55 % male. Millennials and Gen‑Z (ages 13–41) dominate, with 55 % of adventure and battle royale players in the 13‑27 bracket. Motivations differ: non‑RMG gamers seek entertainment and challenge, whereas RMG players are driven by seasonal events like cricket tournaments or festive card‑game gatherings.
Key performance indicators for advertisers include install‑to‑registration rates of ~50 % for casual games and ~25 % for card‑based RMG, with retention dropping from 30 % on day one to 3 % by day thirty for casual titles. The analysis underscores the importance of vernacular creatives, cross‑interest programmatic targeting, and multi‑channel optimization to reduce audience overlap. It also notes emerging trends—Web3 play‑to‑earn models, esports growth, and super‑app consolidation—that signal continued market maturation. The report concludes that while monetization remains a challenge for non‑RMG segments, strategic acquisition and in‑game advertising innovations can unlock substantial growth across India’s diverse gaming ecosystem.
- The Indian mobile gaming market generated US$2.2 billion in 2022, with smartphones accounting for 91% of the online gaming audience.
- Non-real-money gaming (non-RMG) is dominated by Adventure, Battle Royale, Puzzle, Arcade, and Racing genres, while real-money gaming (RMG) centers on card games and sports-fantasy.
- Demographics skew young, with 55% of Adventure and Battle Royale players falling into the 13–27 age bracket, and 62% of non-RMG gamers being male.
- Advertiser performance metrics show a 50% install-to-registration rate for casual games compared to 25% for card-based RMG, with casual game retention dropping from 30% on day one to 3% by day thirty.
- Average revenue per user is projected to reach US$1.5 by 2027, necessitating a focus on vernacular creatives and in-game advertising to overcome current monetization challenges.
+2
EAJan 2022
Report43 pages
The State of Mobile Game and App Markets
The analysis demonstrates that mobile app and game advertising in the first half of 2022 experienced a notable contraction, with a 6.24 % year‑over‑year decline in app advertisers and a 27.83 % drop in creative volume, yet the sector is pivoting toward higher‑quality, data‑driven campaigns. Predictive analytics and Apple’s SKAdNetwork 4.0 are emerging as essential tools for optimizing cost‑per‑install, in‑app purchase return on ad spend, and overall campaign effectiveness.
Advertisers are concentrating on impactful creative mechanics and event‑based optimisations, particularly within casual gaming, fitness, and finance verticals. The number of game creatives fell 27.8 % while the advertiser base remained flat at roughly 45,000, indicating a shift from quantity to quality. Major networks such as Unity Ads and AppLovin are leading the charge, with experimentation on offerwall formats that demand precise attribution windows. Meta continues to dominate paid‑social traffic outside the gaming sphere, underscoring its broader reach.
Geographically, tier‑1 markets—US, Australia, Germany, South Korea, UK, and France—dominate spend and revenue, with CPMs peaking in the United States at approximately $27. Lower‑cost regions such as Turkey and India present attractive lifetime value opportunities, especially during seasonal CPM spikes in fall and winter holidays. Android creatives have gained prominence post‑IDFA, while incentive‑based offerwalls are becoming more prevalent.
Publishers increasingly rely on search‑driven installs and coordinated ASO/paid‑social strategies, with Apple Search Ads projected to reach $20 billion by 2025. The focus on higher‑quality ad creatives, blended event optimisation (trial plus subscription), and rising subscription prices—driven by A/B testing and post‑iOS‑14.5 user acquisition costs—highlights a tightening competitive landscape, particularly in Android and tier‑2/3 markets.
- Mobile advertising experienced a significant contraction in H1 2022, marked by a 6.24% year-over-year decline in app advertisers and a 27.83% drop in creative volume.
- The industry is shifting from high-volume output to quality-focused, data-driven campaigns, evidenced by a flat advertiser base of 45,000 despite the sharp reduction in creative assets.
- Apple Search Ads are projected to reach $20 billion in revenue by 2025 as publishers increasingly prioritize search-driven installs and integrated ASO strategies.
- Tier-1 markets, led by the US with peak CPMs of approximately $27, remain the primary drivers of spend and revenue, while Turkey and India offer high lifetime value opportunities during seasonal CPM spikes.
- Predictive analytics and SKAdNetwork 4.0 have become essential for optimizing campaign effectiveness, return on ad spend, and cost-per-install metrics.
+1
AdQuantumJan 2022
Report106 pages
Global White Paper on Mobile Advertising & Marketing Game
Mobile game advertising in 2022 experienced a pronounced contraction, with total creatives falling nearly 30 % year‑over‑year to 15.8 million while the advertiser base stayed flat at 45,100. The decline stemmed from a shift toward quality‑focused marketing and the impact of Apple’s IDFA changes, which pushed spend to Android. Video ads dominated the format mix (over 86 % of creatives), and casual/puzzle titles captured the majority of spend, displacing RPGs in many markets. Tier 2 and Tier 3 regions saw significant growth, driven by cross‑platform titles such as Genshin Impact and the rise of esports and metaverse expectations.
Geographically, China’s HK/Macau/TW region maintained RPG dominance but broadened to action, casual and MOBA campaigns with large budgets. In the United States, mid‑core and hardcore titles produced the most creatives despite a 10 % revenue decline. Japan’s simulation games led advertising, while Korea shifted from MMOs to card‑RPGs and early NFT experimentation. South Asia’s market was shooter‑heavy, with casual games generating the most creatives and RPGs producing the highest volumes. Turkey’s top titles were ARPGs and shooters, with a surge in casual and parkour advertising tied to esports and influencer content.
Cost dynamics varied by genre and platform: strategy games commanded the highest CPM ($21.58), while casual titles hovered around $17–$18; iOS ads were 15 % costlier than Android. Female and older users (55–64) paid the highest CPMs ($22.26) and CPCs ($2.90), yet CTR increased with age across formats. Playable ads delivered the lowest CPI but weakest ROAS, whereas banner ads offered the best return on spend.
Emerging channels such as social‑first platforms and AR filters proved highly engaging, with Snapchat’s concise, sound‑driven ads capturing attention within five seconds and AR filters generating 1.7× more immersive brand links. In India, vernacular marketing and programmatic unified platforms are expanding reach to Tier II/III audiences, while playable and rewarded video formats mitigate banner blindness. Overall, the data underscore a diversification of genre advertising, a continued emphasis on high‑budget flexible media strategies, and a pivot toward video‑centric, narrative‑driven campaigns across high‑revenue titles.
- Mobile game advertising volume contracted by nearly 30% in 2022 to 15.8 million creatives, driven by a shift toward quality-focused marketing and the impact of Apple’s IDFA changes.
- Video ads dominate the market, accounting for over 86% of all creatives, while casual and puzzle titles have displaced RPGs as the primary drivers of advertising spend.
- Cost-per-mille (CPM) is highest for strategy games at $21.58, and iOS advertising remains 15% more expensive than Android equivalents.
- Targeting female and older users (55–64) yields the highest CPMs ($22.26) and CPCs ($2.90), with click-through rates showing a positive correlation with user age.
- While playable ads achieve the lowest cost-per-install (CPI), banner ads currently provide the most effective return on ad spend (ROAS).
+2
TencentJan 2022
Report75 pages
Data Digest Q2 2022
Global mobile app activity in Q2 2022 showed a modest 2.5 % year‑over‑year decline in total downloads, falling to 35 billion worldwide. TikTok remained the undisputed leader on both Apple’s App Store and Google Play, while Meta’s suite of apps—Instagram, WhatsApp, Messenger—dominated the top‑10 rankings globally. In the United States consumer spending shifted away from games toward non‑game categories, and Meta’s share slipped to fourth place on Google Play. Europe and Asia mirrored TikTok’s dominance, yet regional leaders varied: Google Maps surged in Europe, and VooV Meeting experienced a 47 % jump amid China’s lockdowns.
On Google Play, Asia was the most dynamic market. Instagram captured 22 % of all Meta installs and outpaced Facebook, Snapchat, and WhatsApp. India accounted for 70 % of TikTok’s downloads, while Meesho and WhatsApp Business each exceeded 30 % of their regional installs. Meta’s overall Google Play installs in Asia grew 22 % YoY, whereas competitors showed mixed performance. Worldwide, Meta pulled more than 550 million downloads on Google Play—well ahead of Google’s 320 million—and expanded its lead over the rival.
Google Play downloads totaled 7 billion in Q2 2022, a 26 % YoY increase but still 9.7 % below pre‑pandemic Q2 2019 levels. India remained the largest market with 6 billion downloads, despite a ~10 % YoY decline, while Indonesia’s 8.5 % QoQ growth to 6 billion positioned it to potentially overtake Brazil’s 7.26 billion downloads. Other markets, including the U.S. and Mexico, saw modest changes, underscoring India’s continued dominance and Indonesia’s rapid expansion.
In gaming, Miniclip’s acquisition of Sybo and the inclusion of Subway Surfers propelled it to sixth place in worldwide mobile game downloads, achieving 472 million installs and $194 million in consumer spending, with a May spike. Travel‑app downloads rebounded to over 100 million in the U.S. and 28 million in the U.K., while ticket‑app installs surged, with the top five apps exceeding 10 million U.S. downloads—an increase of more than 70 % from pre‑pandemic levels—highlighting robust growth potential in both gaming and travel/event segments as consumer activity returns to pre‑COVID norms.
- Global mobile app downloads declined 2.5% year-over-year to 35 billion in Q2 2022, while Google Play downloads reached 7 billion, a 26% year-over-year increase that remains 9.7% below pre-pandemic Q2 2019 levels.
- Meta continues to dominate the global app market, securing over 550 million Google Play downloads compared to Google’s 320 million, with Instagram leading Meta’s growth in Asia at 22% of all its regional installs.
- TikTok remains the top-ranked app globally, with India accounting for 70% of its total downloads during the quarter.
- India remains the largest Google Play market with 6 billion downloads, while Indonesia’s 8.5% quarter-over-quarter growth positions it to challenge Brazil’s 7.26 billion download volume.
- Miniclip reached sixth place in worldwide game downloads with 472 million installs and $194 million in consumer spending, largely driven by its acquisition of Sybo and the Subway Surfers title.
+1
Sensor TowerJan 2022
Report73 pages
State of Mobile 2022
The global mobile economy experienced unprecedented expansion in 2021, characterized by a 19% year-over-year increase in app store spending to $170 billion and a 23% rise in mobile advertising to $295 billion. This growth was underpinned by a fundamental shift in consumer behavior, as users in leading markets now average 4.8 hours daily on mobile devices. Social, photo, and video applications dominate this engagement, accounting for 70% of time spent. The ecosystem's vitality is further evidenced by the release of 2 million new apps and the emergence of 233 individual titles that each surpassed $100 million in annual consumer spend.
Mobile gaming remains the primary engine of monetization, reaching a record $116 billion in spend. While hypercasual titles drive download volume, core gaming experiences like 4X March-Battle strategy and creative sandboxes drive the highest revenue. Beyond gaming, the finance sector saw a 28% increase in downloads, propelled by the rise of neobanks in emerging markets and a surge in cryptocurrency adoption. Similarly, retail engagement surpassed 100 billion hours, while the food and drink sector reached record sessions through the rapid expansion of ultra-fast delivery services.
The landscape also reflects a recovery in travel and sports, with engagement returning to pre-pandemic levels alongside a 95% increase in dating app spend since 2018. Emerging trends such as live streaming and avatar-based social platforms indicate growing consumer interest in the metaverse, with live streaming engagement outpacing the general market by nine times. Geographically and corporately, the market is led by U.S. giants like Google and Meta in general utility, while Chinese firms like Tencent dominate the gaming sector. This data illustrates a mature yet diversifying mobile industry that has become the central platform for finance, entertainment, and social interaction globally.
- The global mobile economy saw massive growth in 2021, with app store spending rising 19% to $170 billion and mobile advertising increasing 23% to $295 billion.
- Mobile gaming remains the primary revenue driver, reaching a record $116 billion in consumer spend, with 4X March-Battle strategy and creative sandbox titles generating the highest returns.
- Daily mobile usage in leading markets reached 4.8 hours, with social, photo, and video applications capturing 70% of that time.
- The mobile ecosystem demonstrated high-level commercial success with 233 individual titles surpassing $100 million in annual consumer spend.
- Finance app downloads grew by 28% in 2021, fueled by the expansion of neobanks in emerging markets and increased cryptocurrency adoption.
+1
data.aiJan 2022
Report39 pages
Newzoo IP-Based Mobile Games Report (2022)
Intellectual property has emerged as a primary driver of success in the mobile gaming landscape, particularly as privacy changes like Apple’s IDFA have complicated traditional user acquisition. In 2021, the dominance of established franchises was underscored by the fact that only one non-IP title reached the top ten global downloads. High-spending players, defined as those investing over $25 per month, demonstrate a significantly higher propensity to download games based on familiar franchises compared to low spenders. This trend translates into superior long-term value and revenue potential for developers who leverage recognized brands to bypass rising marketing costs.
The global market exhibits distinct regional dynamics regarding IP performance. While Western properties such as Disney and Marvel achieve massive download volumes worldwide, Eastern IPs—specifically those originating from Japanese manga and Chinese literature—consistently lead the top-grossing charts. This financial success is driven by the integration of deep monetization mechanics, such as gacha systems, and a strong cultural fit within Asian markets. However, the mere presence of a popular brand does not guarantee longevity. Success requires a "fan-first" approach where game mechanics align seamlessly with the source material. Titles like Umamusume: Pretty Derby illustrate how high-quality simulation and immersive character work drive retention, whereas technical shortcomings or a poor fit between the genre and the IP can lead to rapid player churn.
Long-term profitability in the IP-based mobile sector depends on deep collaboration between developers and licensors to create exclusive content that expands the franchise's universe. Experts emphasize that localized cultural optimization and high production values are essential for maintaining engagement. By utilizing comprehensive market data and consumer research, industry stakeholders can better navigate these trends, sizing global opportunities and identifying the specific franchise-mechanic combinations that resonate most effectively with high-value audiences.
- Established intellectual property is now a primary driver of mobile success, evidenced by the fact that only one non-IP title reached the top ten global downloads in 2021.
- High-spending players, defined as those investing over $25 per month, show a significantly higher propensity to download games based on familiar franchises than low spenders.
- While Western IPs like Disney and Marvel drive high global download volumes, Eastern IPs from Japanese manga and Chinese literature dominate top-grossing charts due to deep monetization mechanics like gacha systems.
- Leveraging recognized brands serves as a critical strategy to bypass rising user acquisition costs caused by privacy changes such as Apple’s IDFA.
- Long-term retention requires a 'fan-first' approach where game mechanics, such as the high-quality simulation found in Umamusume: Pretty Derby, align seamlessly with the source material.
+1
NewzooJan 2022