Marvel Contest of Champions
GameBy Kabam Games, Inc.
18 documents in the library are about Marvel Contest of Champions, from writers such as Netmarble, Sensor Tower and Deconstructor of Fun. Each has a summary and key insights with the page they come from.
Connections
The documents about Marvel Contest of Champions on the inner ring, the other games and companies they name on the outer one. Select a cover to see it up close and open it in a new tab; drag to move, pinch or Ctrl + scroll to zoom.
Key figures from the reports
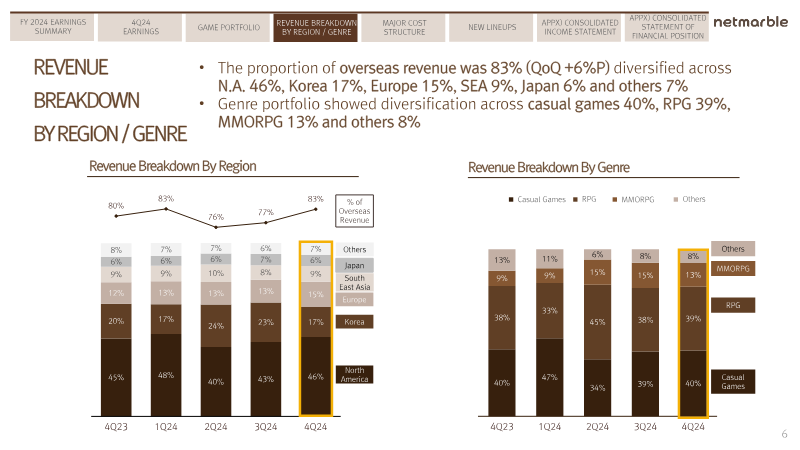
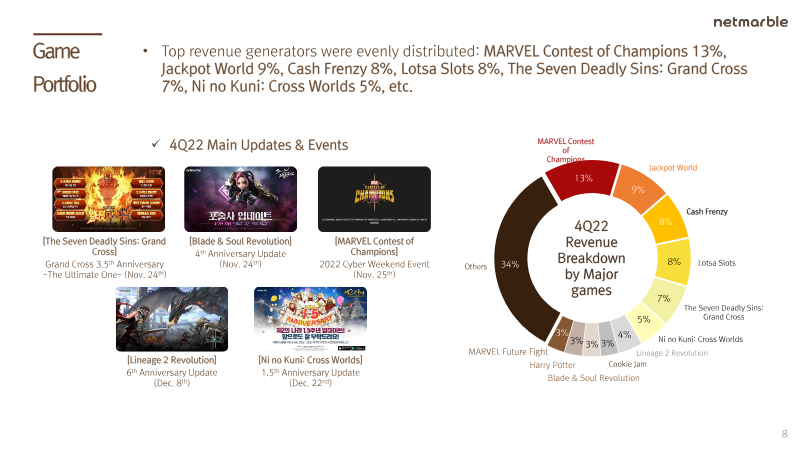
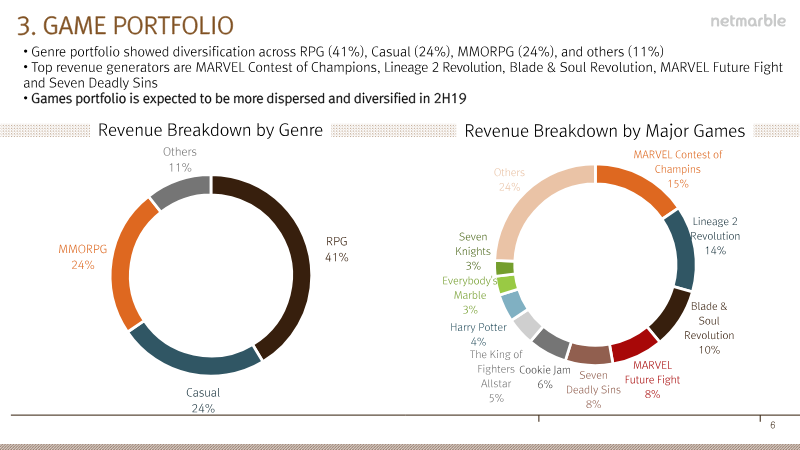
The company's revenue is balanced across genres, comprising 40% casual games, 39% RPGs, and 13% MMORPGs, with key contributions from Marvel Contest of Champions, Jackpot World, and Solo Leveling: ARISE.
Netmarble, 2025 · Netmarble 4Q 2024 and FY 2024 Earnings Results, p. 6
Marvel Contest of Champions by Kabam was the top-grossing mobile game on Black Friday, generating approximately $2.7 million in player spending.
Sensor Tower, 2019 · Black Friday Spurs Mobile Game Revenue to Single-Day Record of $70 Million: USA
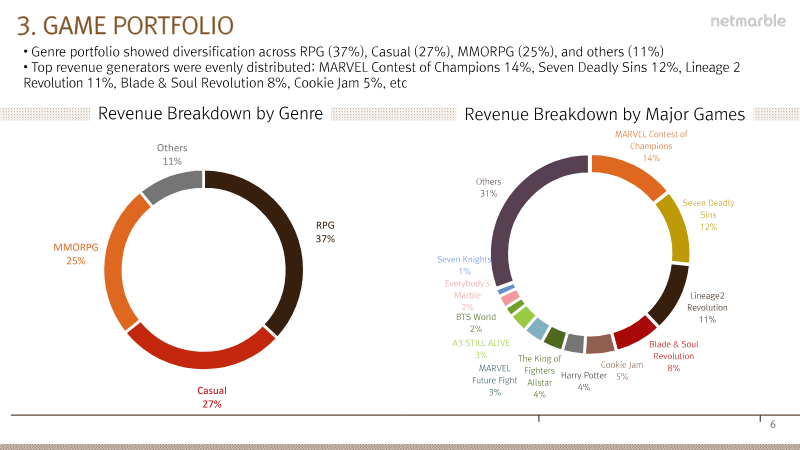
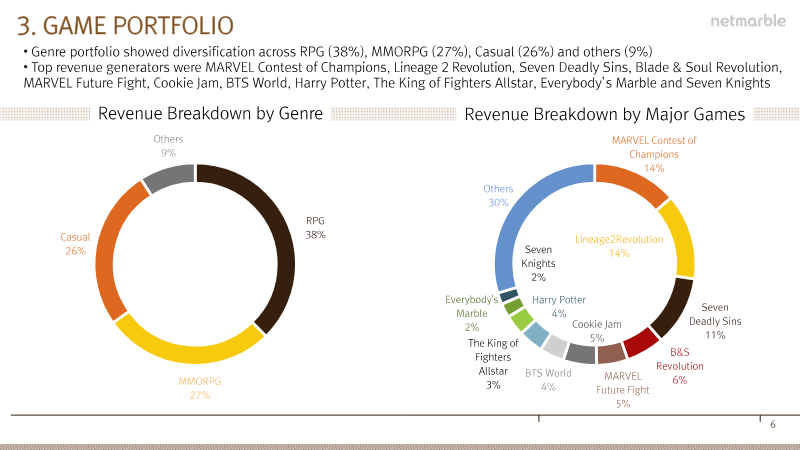
The company's revenue is distributed across RPGs (37%), casual games (27%), and MMORPGs (25%), led by titles such as Marvel Contest of Champions, Seven Deadly Sins, and Lineage 2 Revolution.
Netmarble, 2020 · Netmarble 1Q 2020 Earnings Results, p. 7
On Steam
Steam estimates as of 9 Oct 2026. Revenue is premium revenue on Steam only: game sales, without DLC, and without in-game spending in a free game.
- Revenue to date
- $0
- Units sold
- 130K
- Price
- Free
- Positive reviews
- 70%
- of 1,752 reviews
- Peak players
- 965
- at the same time
- Followers
- 6,572
- Average playtime
- 30 h
| Year | Share of the best year | Revenue | Units |
|---|---|---|---|
| 2025 | $0 | 74K | |
| 2026 so far | $0 | 56K |
On Steam since Jun 18, 2025 · Developer Kabam Games, Inc.Steam store page
Documents about Marvel Contest of Champions

Weekly Industry Brief: Google Play Fees, Kingshot Ads, and Funding
The mobile gaming industry experienced significant shifts in late June 2026, characterized by major regulatory changes, substantial capital investments, and strategic corporate restructuring.
- Google Play will open up billing options and lower store fees for developers in the US, EU, and UK starting June 30, with other regions to follow.
- AppsFlyer received a $1 billion investment from Google, Unity, Meta, and Moloco, valuing the ad measurement firm at approximately $2.7 billion.
- Kabam, the developer of Marvel Contest of Champions, is undergoing layoffs and downsizing its Los Angeles office to streamline operations.
Netmarble 4Q 2024 and FY 2024 Earnings Results
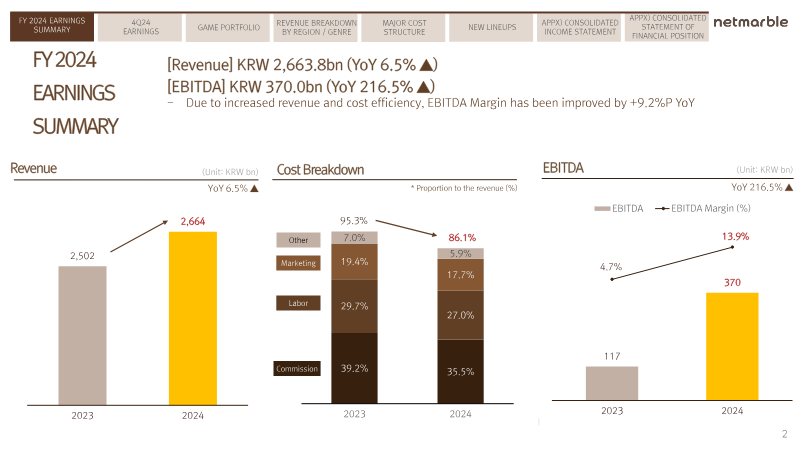
Netmarble’s financial performance for the 2024 fiscal year reflects a period of revenue growth and improved operational efficiency, despite significant bottom-line volatility in the fourth quarter.
- Netmarble achieved KRW 2,663.8 billion in annual revenue for 2024, a 6.5% increase over the previous year, while annual EBITDA surged 216.5% to KRW 370.0 billion.
- The company recorded a net loss of KRW 166.7 billion in 4Q 2024, driven primarily by the recognition of impairment losses on intangible assets.
- Netmarble maintains a strong global presence with 83% of its revenue generated outside of Korea, led by North America at 46%.
Netmarble Ends 2022 with Net Loss of $714 Million
Netmarble’s 2022 financial performance highlights a significant period of volatility for the South Korean mobile developer and publisher.
- Netmarble reported a net loss of ₩906 billion ($714.8 million) in 2022, a sharp reversal from the ₩249 billion ($196.4 million) profit recorded in 2021.
- Despite the net loss, total annual revenue grew 6.6% year-over-year to reach ₩2.67 trillion ($2.1 billion).
- The company’s EBITDA declined by 57.6% year-over-year to ₩127.8 billion ($100.8 million), reflecting significant pressure on operational profitability.

Netmarble 4Q 2022 and FY 2022 Earnings Results
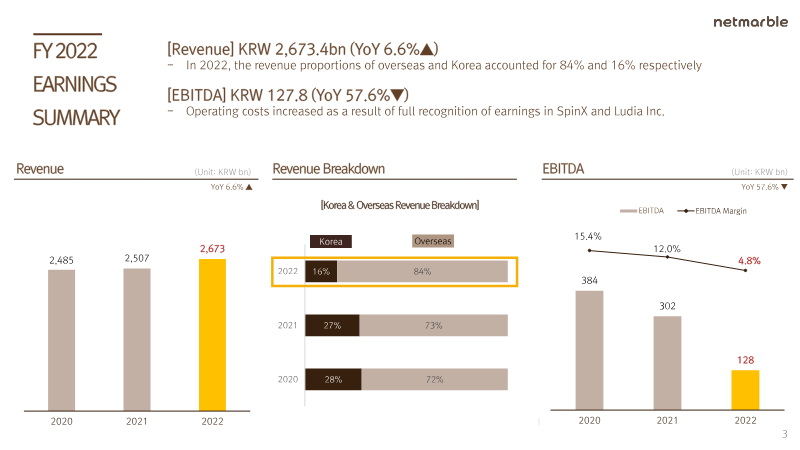
Netmarble’s financial results for the 2022 fiscal year reflect a period of revenue growth tempered by significant profitability challenges.
- Netmarble reported a 2022 annual revenue of KRW 2,673.4 billion, a 6.6% increase, but annual EBITDA dropped 57.6% to KRW 127.8 billion due to rising operating costs from the integration of SpinX and Ludia Inc.
- The company recorded a Q4 2022 operating loss of KRW 19.8 billion and a net loss of KRW 456.6 billion, the latter significantly impacted by impairment charges on intangible assets.
- International markets remain critical to the business, accounting for 84% of total annual revenue, with North America serving as the primary driver at 51% of Q4 revenue.
Call of Duty: Mobile and 11 More Mobile Games to Join $2 Billion Club in 2023
The global mobile gaming market is experiencing a period of contraction, with consumer spending projected to decline by 5% in 2022 to $110 billion, followed by an additional 3% decrease in 2023.
- The global mobile gaming market is contracting, with consumer spending projected to fall by 5% in 2022 and an additional 3% in 2023.
- Economic instability and privacy-related user acquisition challenges, including IDFA restrictions and Google privacy updates, are the primary drivers of the market downturn.
- Eleven mobile games, including Call of Duty: Mobile, State of Survival, and Brawl Stars, are projected to reach the $2 billion lifetime revenue milestone in 2023.


An Analysis of IPs in U.S. Mobile Gaming
The analysis evaluates the influence of licensed intellectual property (IP) on the U.S. mobile gaming market during 2020, using Sensor Tower’s taxonomy and revenue data from the App Store and Google Play.
- Licensed IP titles represent only 9% of the U.S. mobile market but account for 23% of total player spending and 17% of all installs.
- Video game franchises are the primary drivers of IP revenue, contributing one-third of the total, followed by manga (13%), television (12%), and comics (10%).
- Action, shooter, and role-playing games rely most heavily on licensed IP, with these genres deriving 64%, 45%, and 47% of their respective revenues from such titles.

Battle Legion: How to Launch and Grow a Strategy Game
This analysis examines the launch and growth strategy of the mobile action-strategy title Battle Legion, evaluating whether innovative gameplay and a strong core loop are sufficient to succeed in the highly competitive free-to-play market.
- Battle Legion differentiates itself in the strategy genre by combining the card-collecting and upgrade systems of Clash Royale with a unique 100-vs-100 automated battle mechanic.
- The game utilizes a 'Strategy-Team-Unit' framework where player success depends on pre-battle troop selection and tactical placement, rather than real-time manual control.
- Monetization relies on a mix of aggressive targeted offers, watch-to-earn ads, and a Battle Pass, though the game lacks a clear value distinction between micro-transactions and season pass rewards.
Netmarble 1Q 2020 Earnings Results
Netmarble’s first-quarter 2020 earnings results reflect a period of strategic investment and revenue diversification, characterized by a focus on global market expansion and a robust pipeline of new game titles.
- Netmarble reported 1Q 2020 revenue of 532.9 billion KRW, an 11.6% increase year-over-year, despite a 4.0% decline from the previous quarter.
- Operating profit fell to 20.4 billion KRW due to increased marketing expenditures for new title launches in March.
- Net profit reached 57.5 billion KRW, driven by non-operating income including foreign exchange gains, dividend income, and equity method investments.
Netmarble 4Q 2019 Earnings Results
Netmarble’s fourth-quarter 2019 earnings results reflect a period of financial contraction characterized by a decline in revenue and operating margins compared to the previous quarter.
- Netmarble reported a 4Q 2019 net loss of 6.3 billion KRW, driven by 52.4 billion KRW in one-off non-operating costs, including 27.4 billion KRW in foreign exchange losses and 25.0 billion KRW in investment asset valuation adjustments.
- Quarterly revenue reached 551.8 billion KRW, marking an 11.0% sequential decline, while operating profit fell 40.5% quarter-over-quarter to 50.2 billion KRW due to the underperformance of new game titles.
- Overseas markets remain the primary revenue engine, contributing 72% of total quarterly revenue, with North America accounting for 30% and Japan for 15%.
Black Friday Spurs Mobile Game Revenue to Single-Day Record of $70 Million: USA
Black Friday 2019 served as a record-breaking day for the United States mobile gaming industry, with consumer spending reaching an estimated $69.7 million across the Apple App Store and Google Play.
- U.S. mobile game revenue reached a single-day record of $69.7 million on Black Friday 2019, representing a 25% year-over-year increase.
- App Store spending accounted for 60% of the total revenue at $42.1 million, while Google Play generated $27.6 million.
- Google Play experienced a 34% year-over-year growth in game spending, significantly outpacing the App Store's 20% growth.
Netmarble 3Q 2019 Earnings Results
Netmarble’s third-quarter 2019 earnings results demonstrate significant financial growth, driven primarily by the successful integration of new game titles and effective cost management.
- Netmarble reported 3Q 2019 revenue of 619.9 billion KRW, an increase of 17.9% year-over-year and 17.8% quarter-over-quarter.
- Operating profit reached 84.4 billion KRW, reflecting a 154.2% increase from the previous quarter due to optimized marketing spend and new title revenue.
- International markets generated 68% of total revenue, with North America leading at 28%, followed by Japan at 15%, Europe at 8%, and Southeast Asia at 7%.
Netmarble 2Q 2019 Earnings Results
Netmarble’s second-quarter 2019 earnings results demonstrate a period of top-line growth driven by new game releases, alongside a strategic focus on international market expansion.
- Netmarble reported 2Q 2019 revenue of 526.2 billion KRW, marking a 5.1% year-over-year increase and a 10.2% quarter-over-quarter increase.
- Operating profit fell 46.6% year-over-year to 33.2 billion KRW, driven by higher marketing costs and labor expenses related to new game launches and a North American studio acquisition.
- Overseas revenue accounted for 64% of total earnings in 2Q 2019, with management targeting an increase to 70% by the end of the year.
Companies behind it

As the documents state it.