Dragon Quest
Game
Documents about Dragon Quest
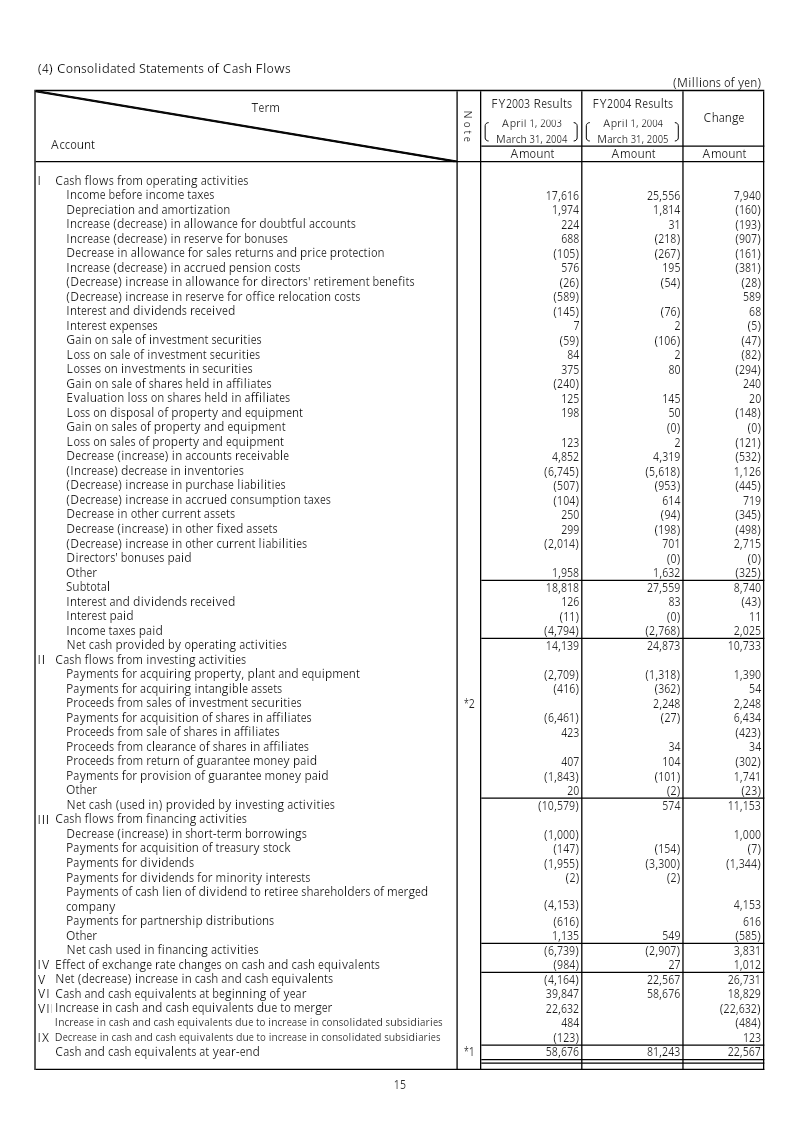
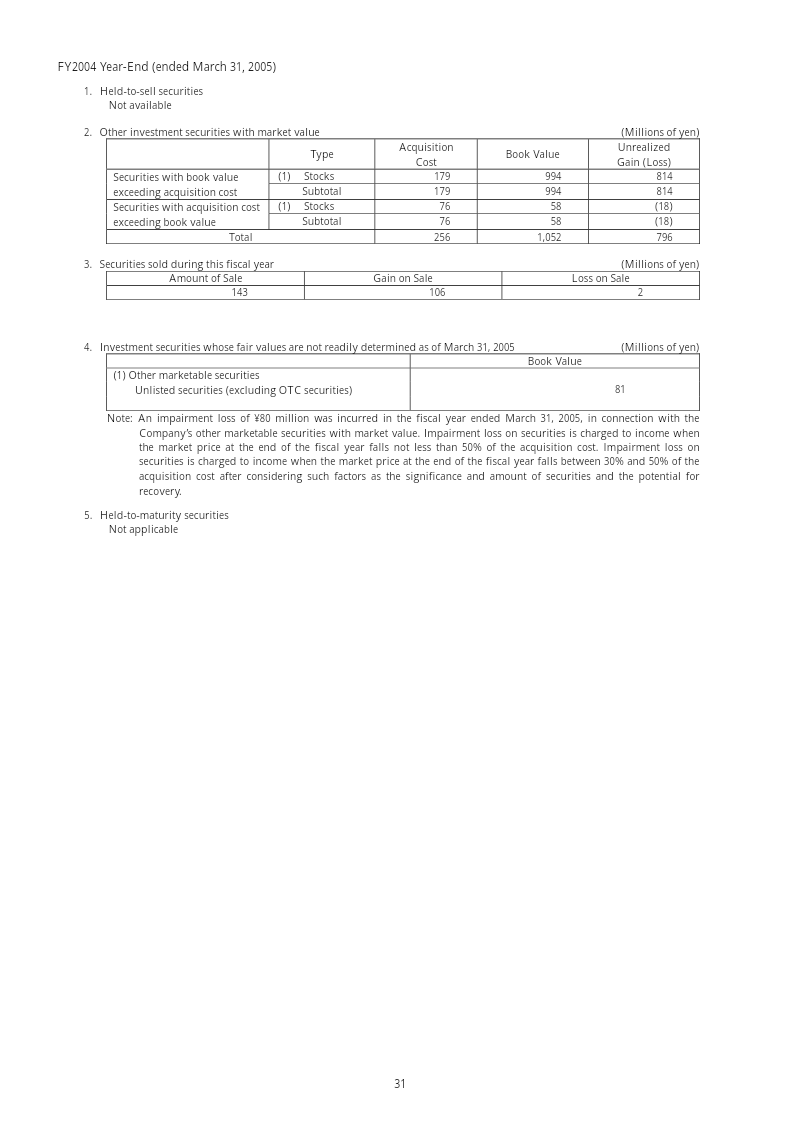
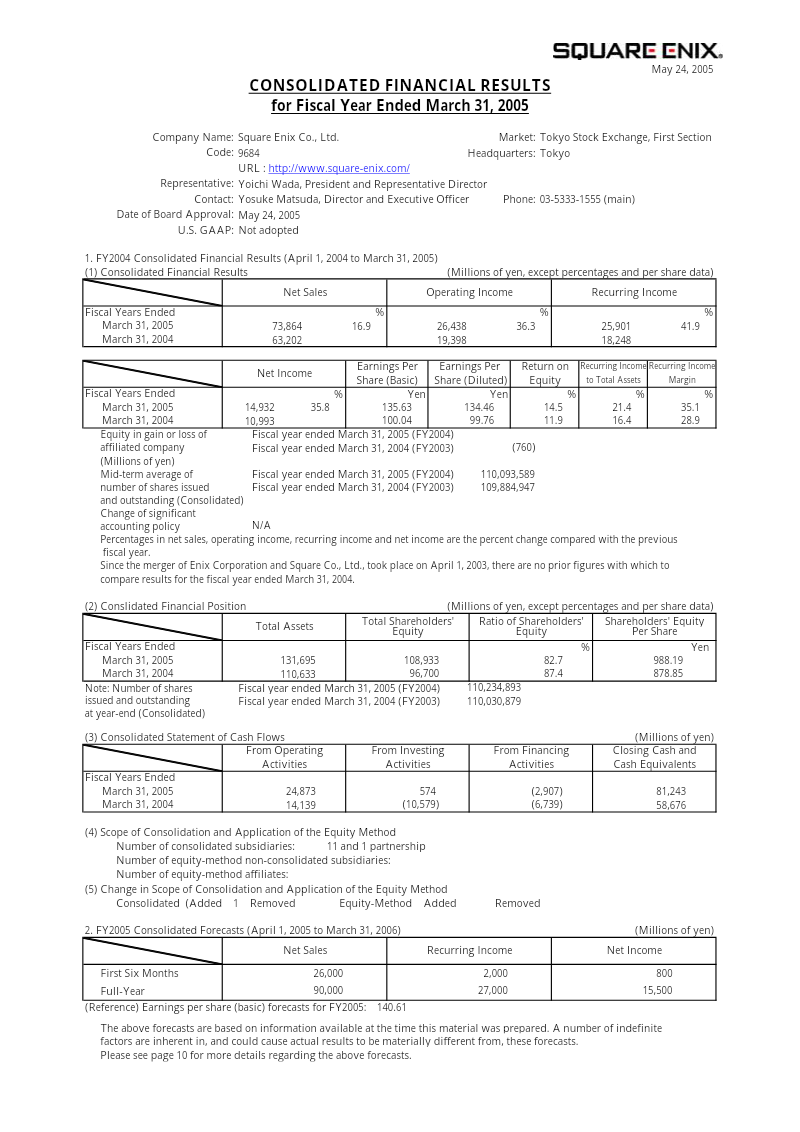
Square Enix Consolidated Financial Results: Fiscal Year Ended March 31, 2005
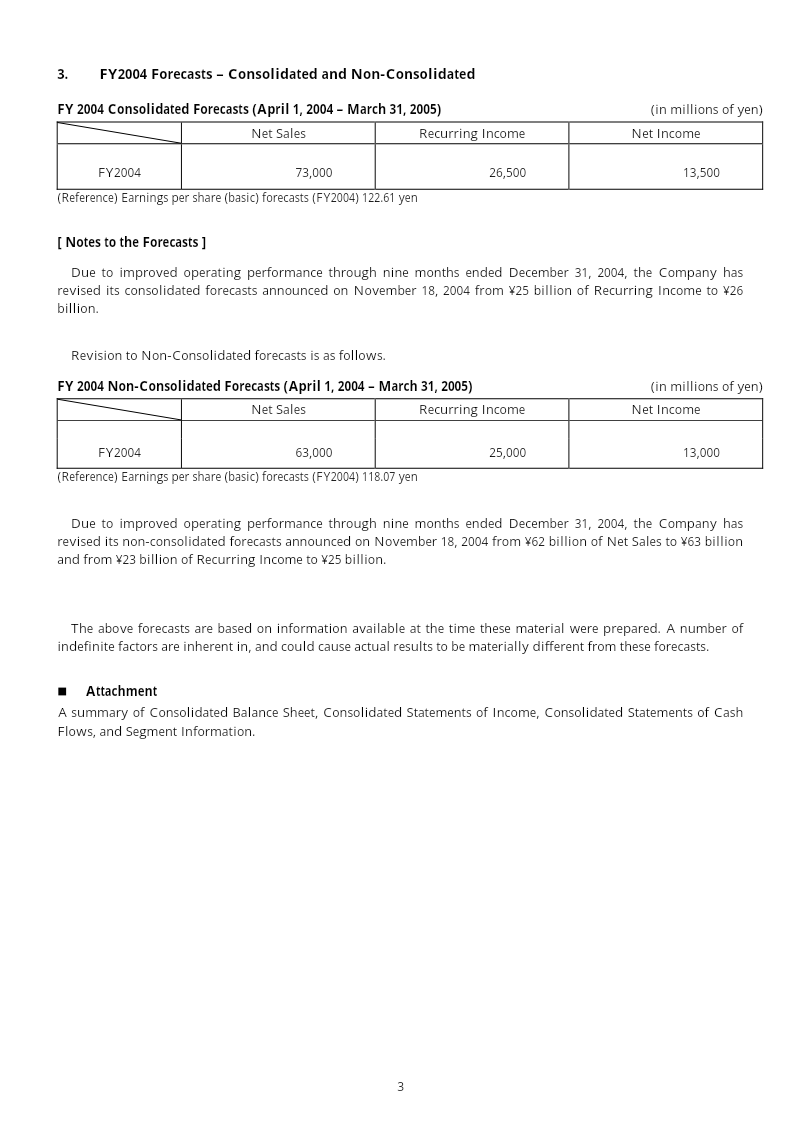
Square Enix achieved robust financial expansion during the fiscal year ended March 31, 2005, characterized by a 16.9 percent increase in net sales to 73.86 billion yen and a 36.3 percent rise in operating income to 26.44 billion yen.
- Square Enix reported strong fiscal growth for the year ending March 31, 2005, with net sales rising 16.9% to 73.86 billion yen and operating income increasing 36.3% to 26.44 billion yen.
- Growth was heavily driven by the Online Games and Mobile Phone Content segments, which saw revenue surges of 55.2% and 63.2% respectively.
- The company achieved a global sales volume of 11.05 million units, bolstered by the performance of key titles including Dragon Quest VIII and the Final Fantasy XI online service.
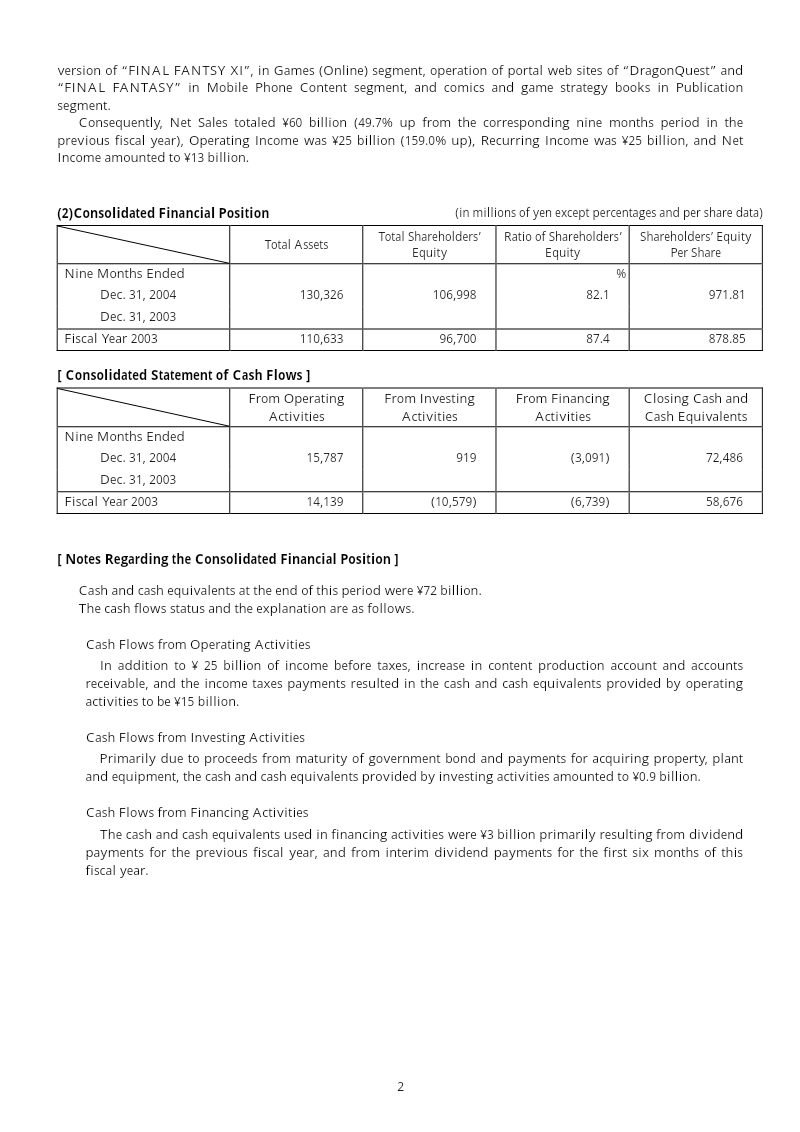
Square Enix Consolidated Financial Report: Nine Months Ended December 31, 2004
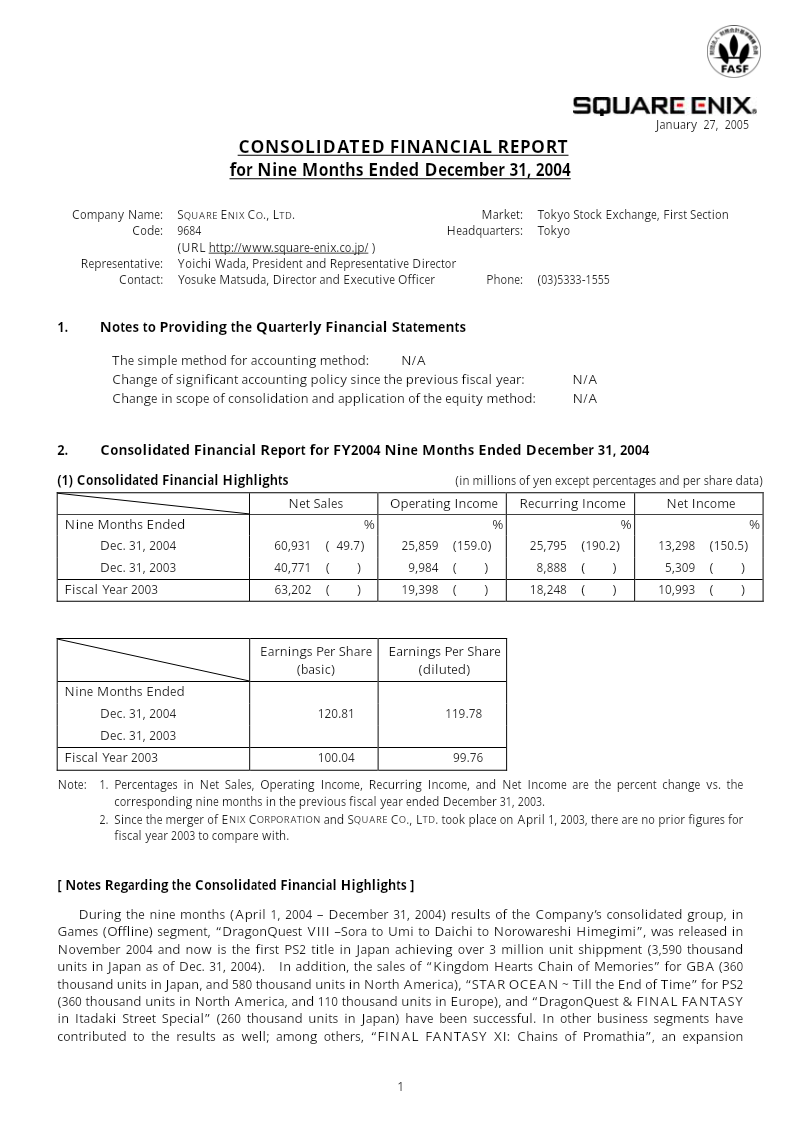
The consolidated financial report for the nine-month period ending December 31, 2004, details strong growth for Square Enix following the 2003 merger of Square Co., Ltd. and Enix Corporation.
- Square Enix achieved significant growth for the nine months ending December 31, 2004, with net sales rising 49.7% to ¥60.9 billion and operating income surging 159% to ¥25.8 billion.
- Net income for the period reached ¥13.3 billion, a 150.5% increase compared to the same period in the previous year.
- The release of Dragon Quest VIII was a primary performance driver, achieving over 3.5 million unit shipments in Japan.


Square Enix Annual Report 2022
Square Enix’s 2022 fiscal year was defined by record-breaking financial performance and a major strategic pivot toward long-term technological transformation.
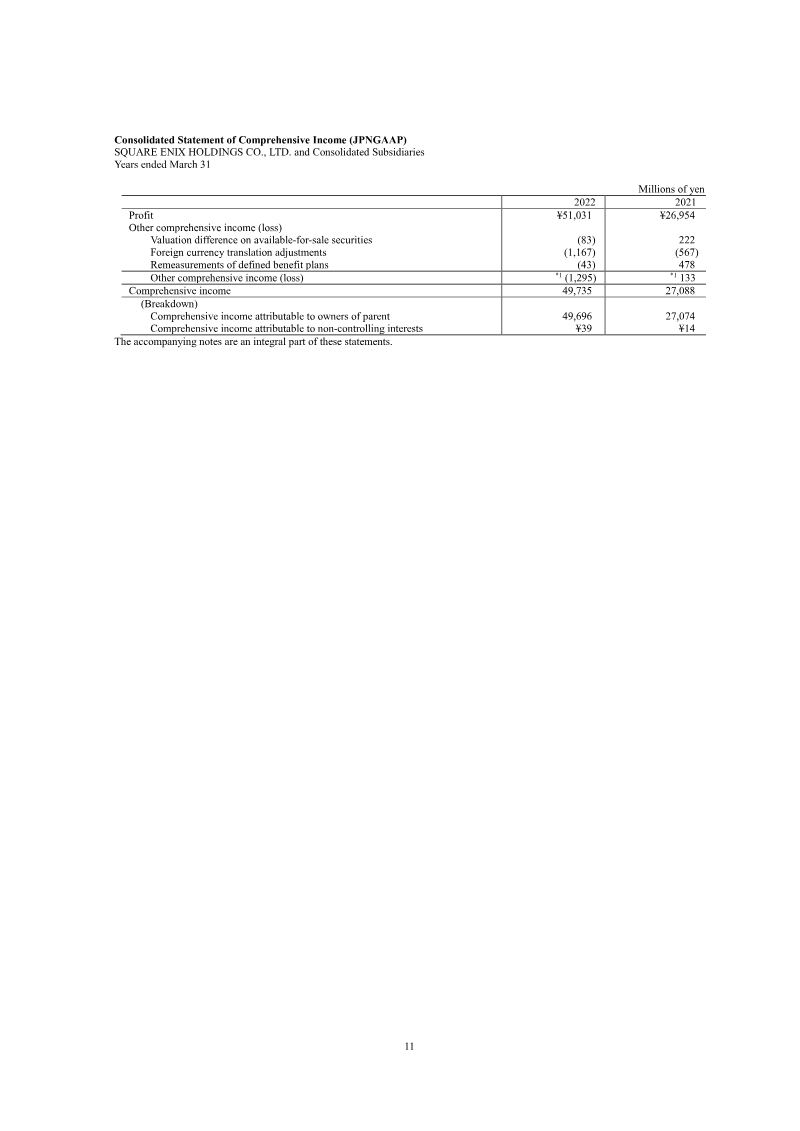
- Square Enix achieved record financial results for the fiscal year ending March 31, 2022, with net sales rising 9.8% to ¥365.3 billion and profit attributable to owners of the parent surging 89.3% to ¥51.0 billion.
- The company divested select Western studios, including Crystal Dynamics and Eidos Interactive, to the Embracer Group for $300 million to optimize capital allocation and focus on core growth areas.
- Strategic resources are being redirected toward emerging technologies, specifically blockchain, artificial intelligence, and cloud-based gaming, to address rising development costs and market volatility.

Aiming FY2019 Financial Results: Q&A Summary
Aiming’s fiscal year 2019 financial results briefing focuses on strategic operational restructuring and the development pipeline for upcoming mobile titles.
Aiming Q2 2020 Earnings Q&A Summary
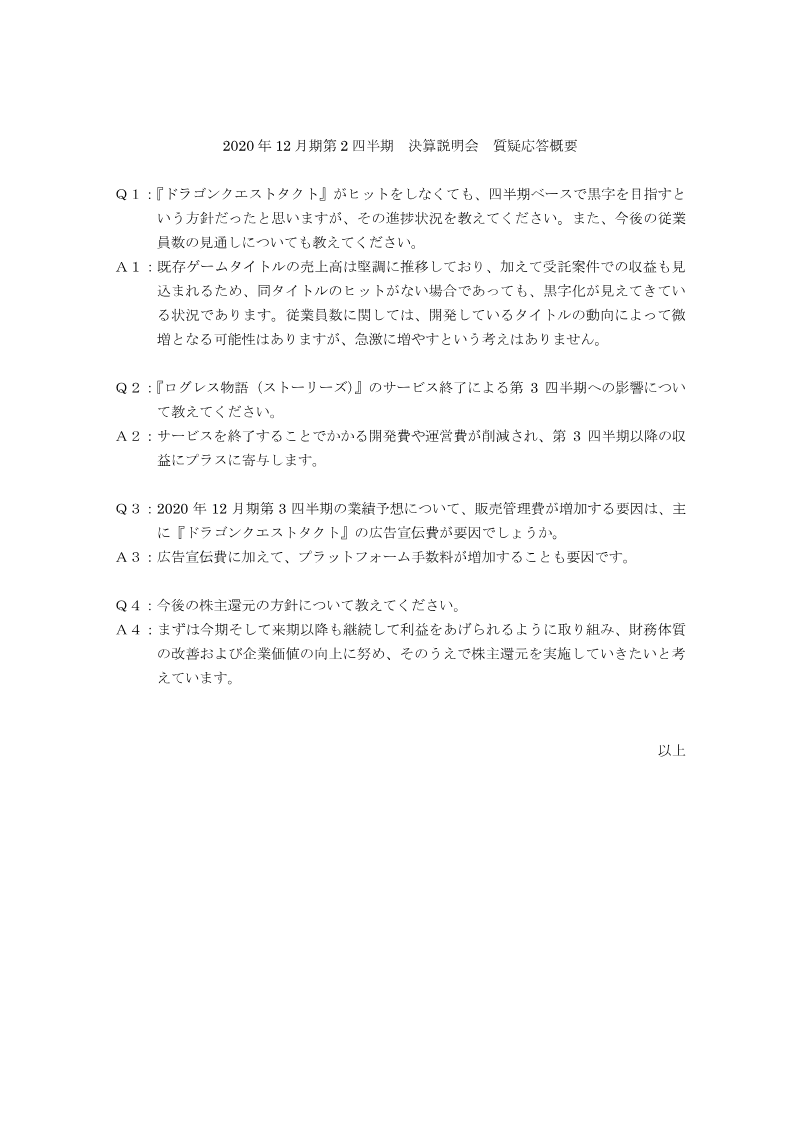
Aiming maintains a strategic focus on achieving quarterly profitability for the 2020 fiscal year, independent of the performance of specific high-profile titles like Dragon Quest Tact.

Japan: Game Market Insights 2026
Japan remains a cornerstone of the global gaming industry, characterized by high-value player engagement and a robust ecosystem that spans mobile, PC, and console platforms.
- The Japanese mobile gaming market generated over $10 billion in in-app purchase (IAP) revenue during the 12-month period ending July 2026.
- Japanese mobile gamers accounted for nearly 17 billion hours of total playtime and 585 million game downloads during the same 12-month period.
- Mobile genre performance is segmented by function, with Puzzle games leading in total downloads, while RPG and Strategy titles command the highest revenue shares.
COLOPL Quarterly Securities Report: The Third Quarter of the Fiscal Year Ending September 30, 2022
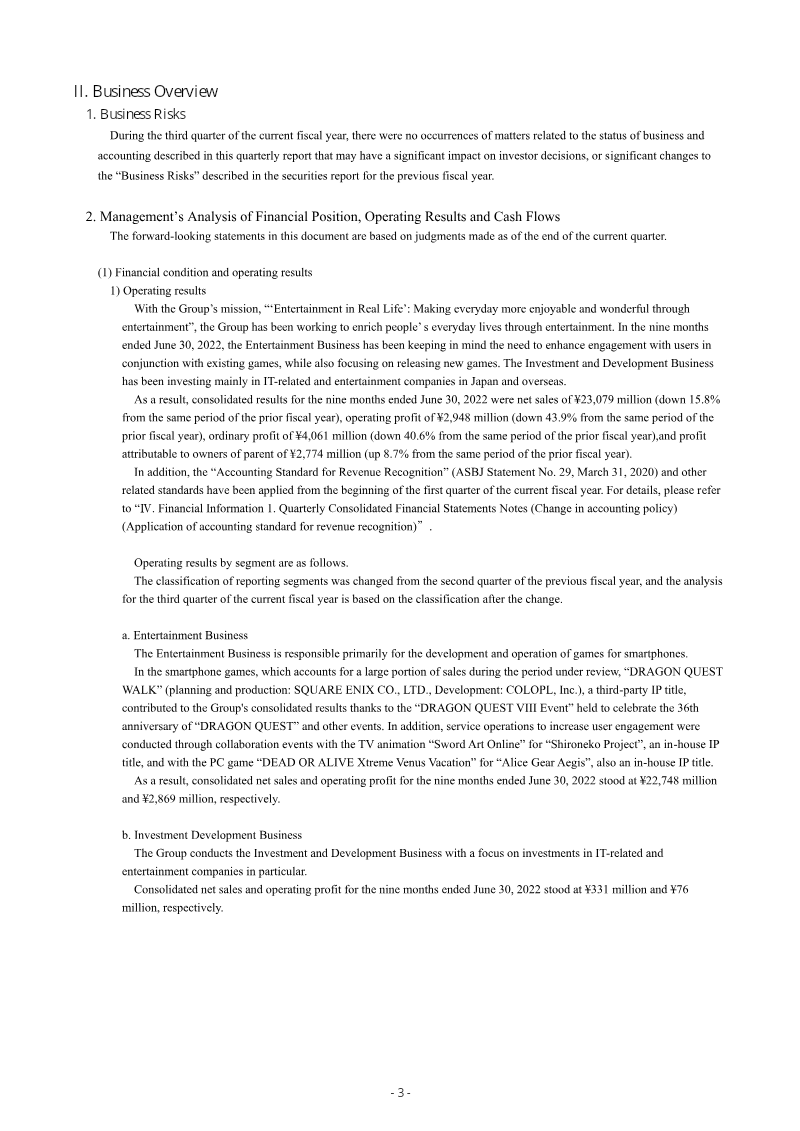
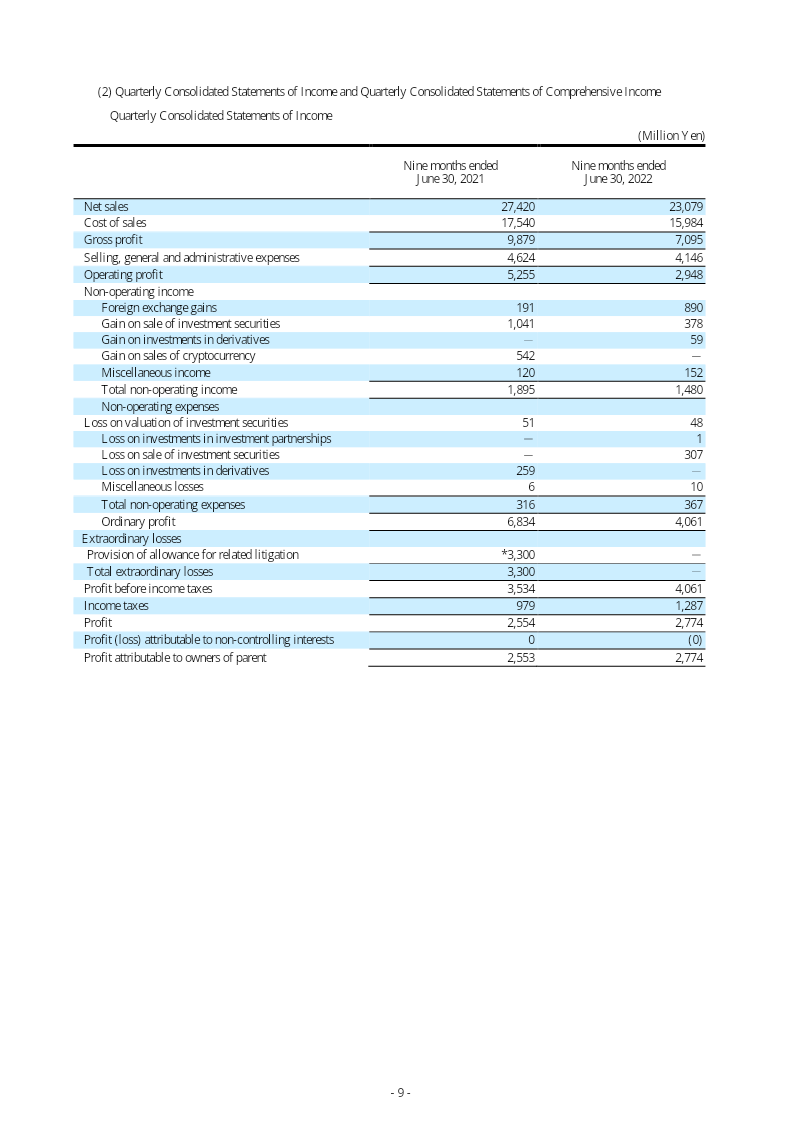
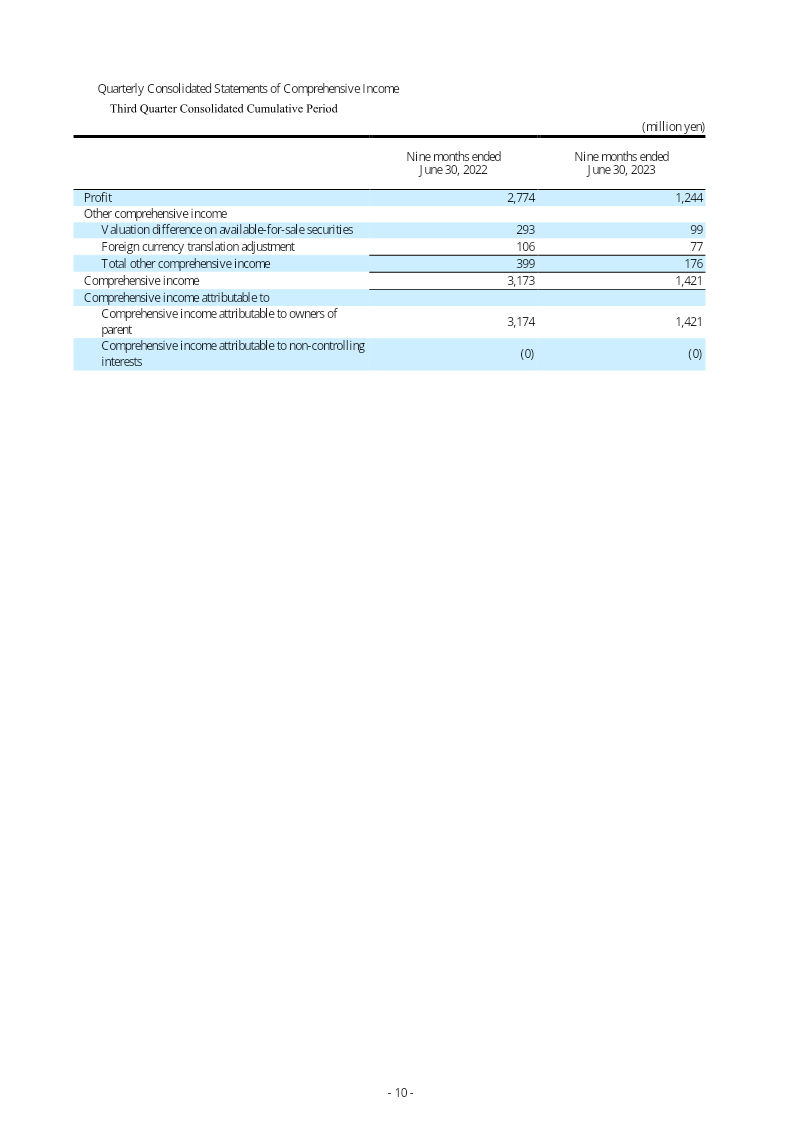
COLOPL’s financial performance for the nine-month period ending June 30, 2022, reflects a transitional phase characterized by declining top-line revenue alongside improved bottom-line profitability.
COLOPL Quarterly Securities Report: 15th Business Term Third Quarter
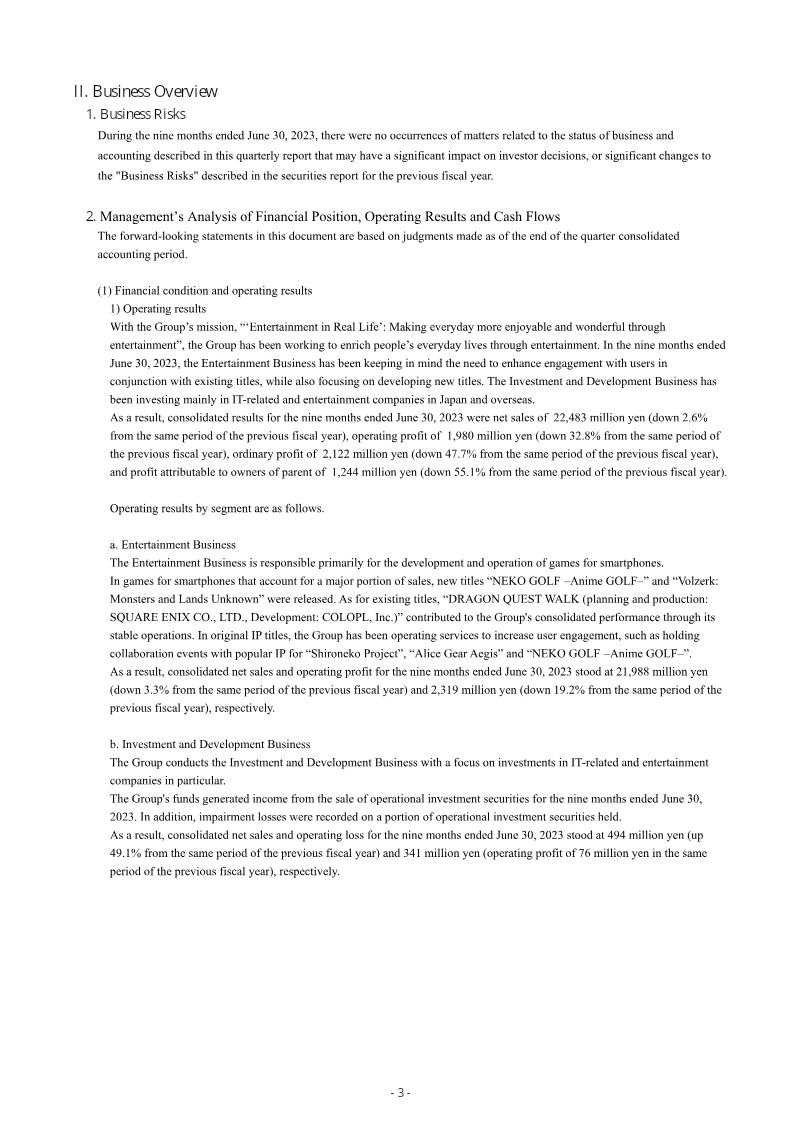
COLOPL experienced a period of financial contraction during the first nine months of the 2023 fiscal year, ending June 30.
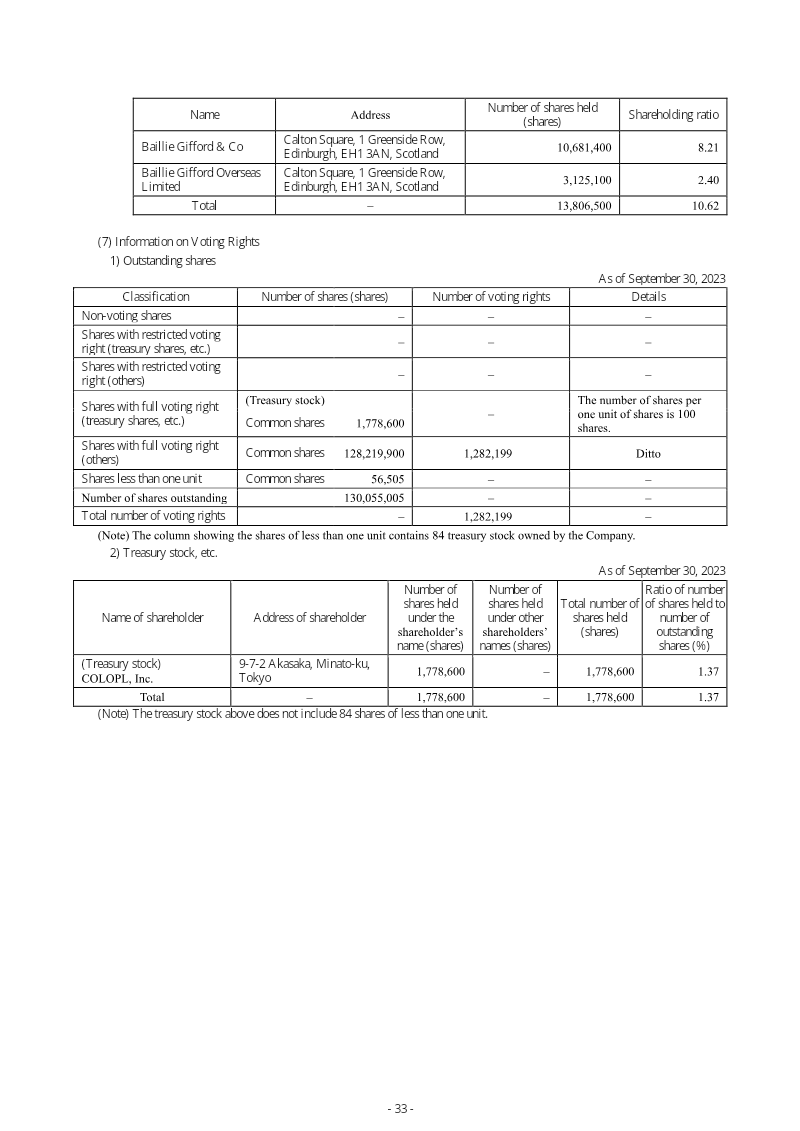
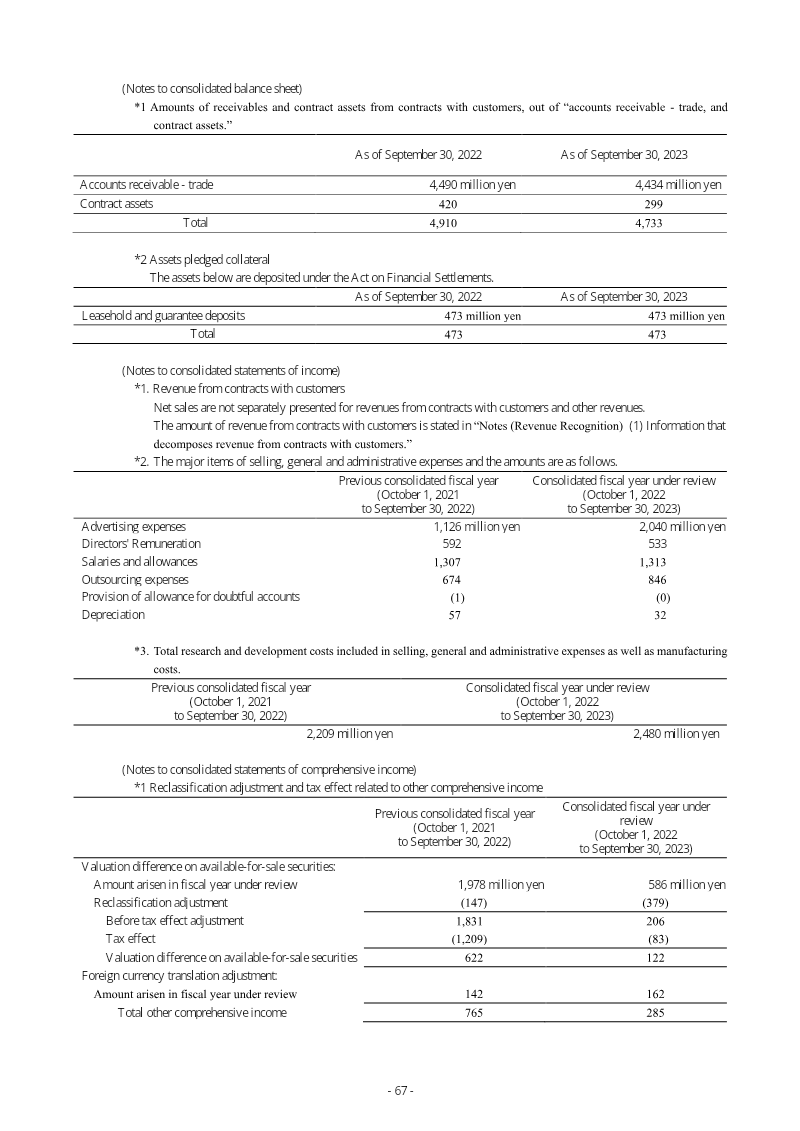

COLOPL Annual Securities Report: Fiscal Year 2023
COLOPL, Inc.’s fiscal year 2023 performance reflects a period of financial contraction characterized by a 5.0% decline in consolidated net sales to 30,926 million yen and a 33.7% drop in operating profit to 2,858 million yen.
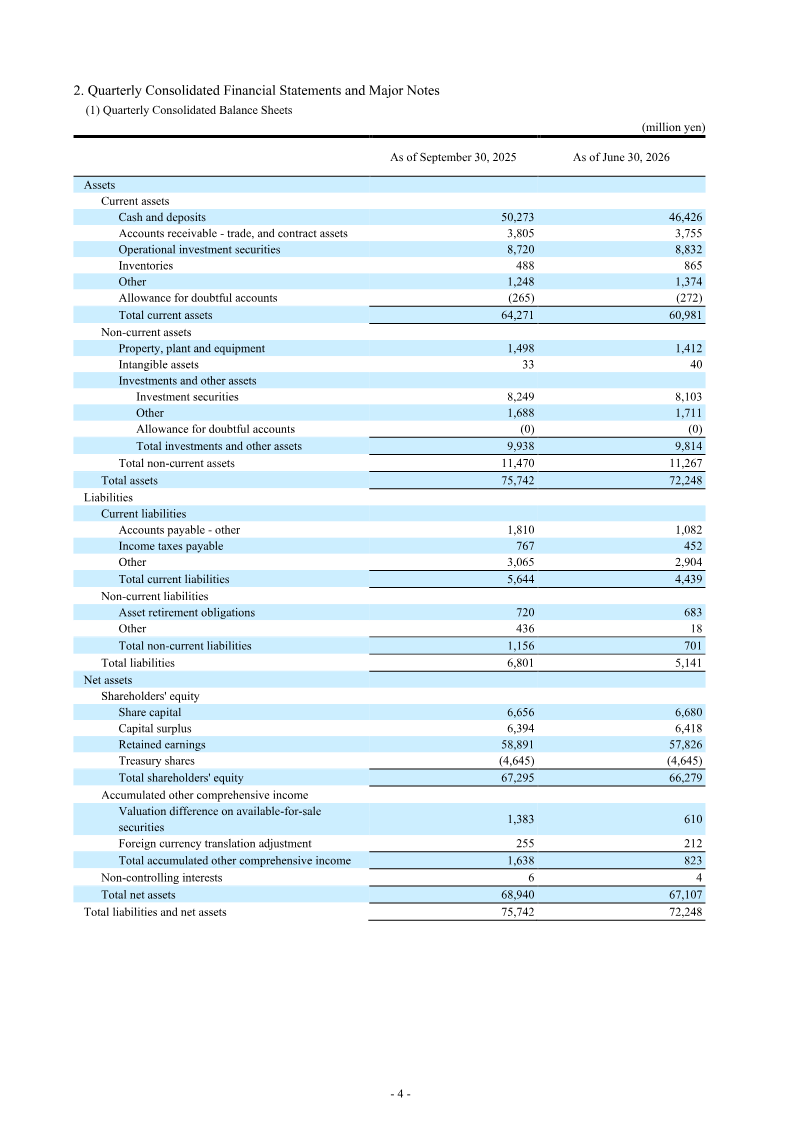
Consolidated Financial Results for the Nine Months Ended June 30, 2026: Japan
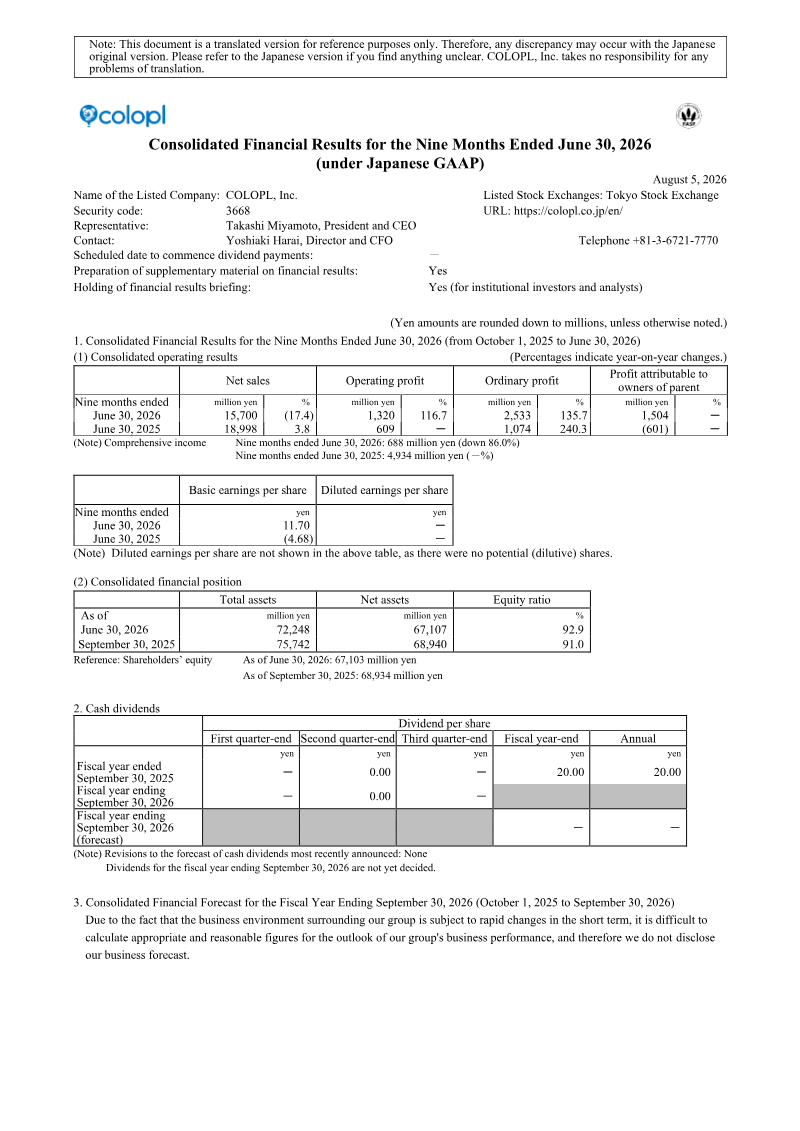
COLOPL, Inc. reported its consolidated financial results for the nine-month period ending June 30, 2026, reflecting a strategic shift toward cost optimization and improved profitability despite a decline in top-line revenue.
- COLOPL, Inc. achieved a significant profit turnaround for the nine months ending June 30, 2026, reporting a net profit of 1,504 million yen compared to a 601 million yen loss in the same period last year.
- Operating profit surged 116.7% to 1,320 million yen and ordinary profit rose 135.7% to 2,533 million yen, despite a 17.4% decline in net sales to 15,700 million yen.
- Profitability improvements were driven by aggressive cost-cutting measures, specifically a group-wide reduction in advertising and operational expenses within the Entertainment Business.


2Q FY Sep. 2026 Financial Results Presentation: Japan
COLOPL’s financial performance for the second quarter of fiscal year 2026 reflects a period of significant structural transition and contraction.
- COLOPL reported a 39.1% year-over-year decline in total sales to 5.3 billion yen and a 71.1% drop in operating profit to 0.6 billion yen for 2Q FY 2026.
- The core Entertainment business achieved a 49% increase in operating profit, driven by disciplined advertising cost management and the sustained performance of Dragon Quest Walk and Shironeko Project.
- The company’s significant financial contraction is primarily attributed to a strategic exit from its Investment and Development segment.

Q1 2026 Financial Results: Japan GAAP (Consolidated)
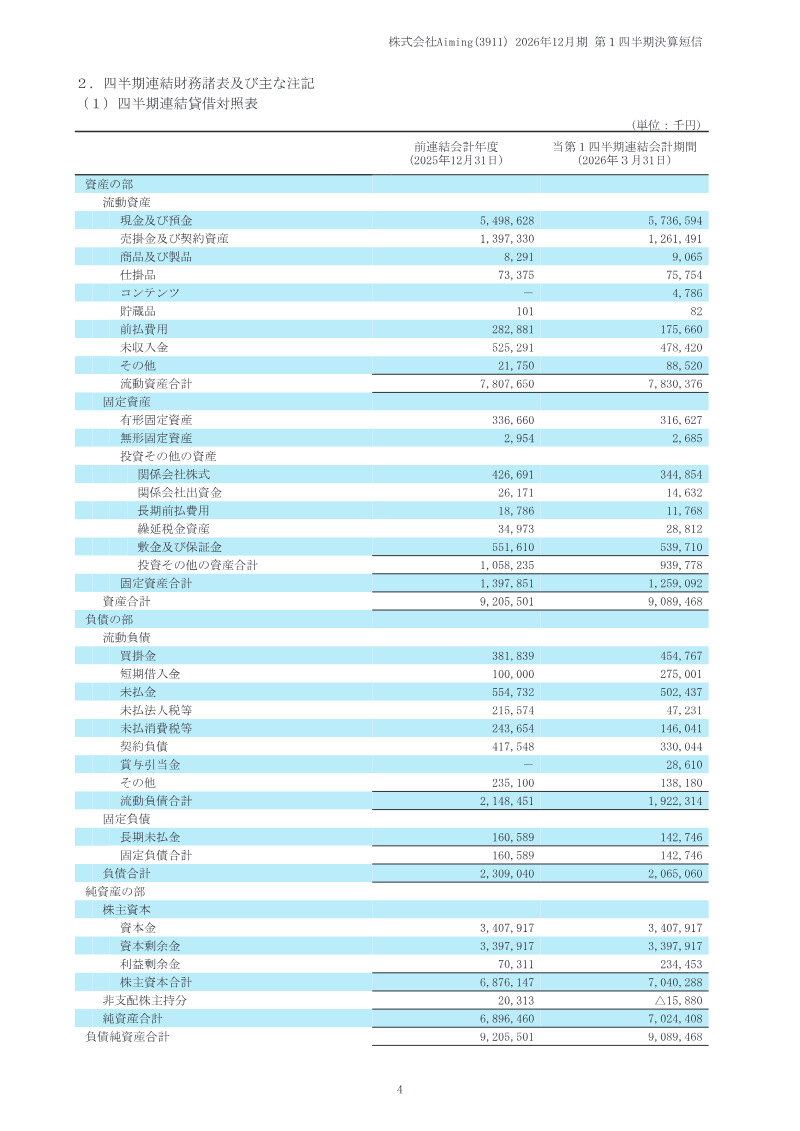
The financial results for the first quarter of 2026 reflect a period of significant contraction for Aiming, a company primarily engaged in the development and operation of free-to-play online games for smartphones.
- Aiming experienced a significant Q1 2026 downturn, with net sales falling 37.1% year-over-year to 3,249 million yen.
- Operating profit plummeted 82.2% to 241 million yen, while net profit attributable to owners of the parent declined by 54.7%.
- The company attributes the financial contraction to a highly competitive domestic market and rising costs linked to extended game development cycles.
Companies behind it

As the documents state it.