2015
Company
Documents about 2015

Koei Tecmo Holdings Annual Report 2016
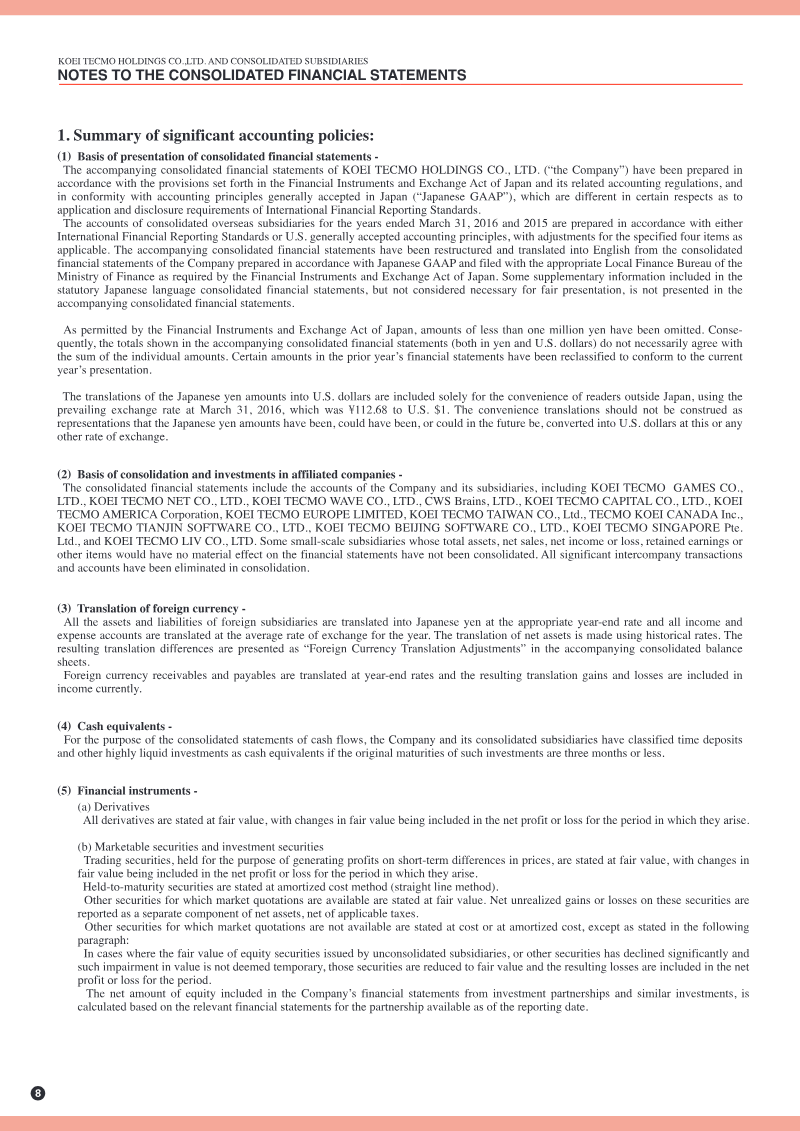
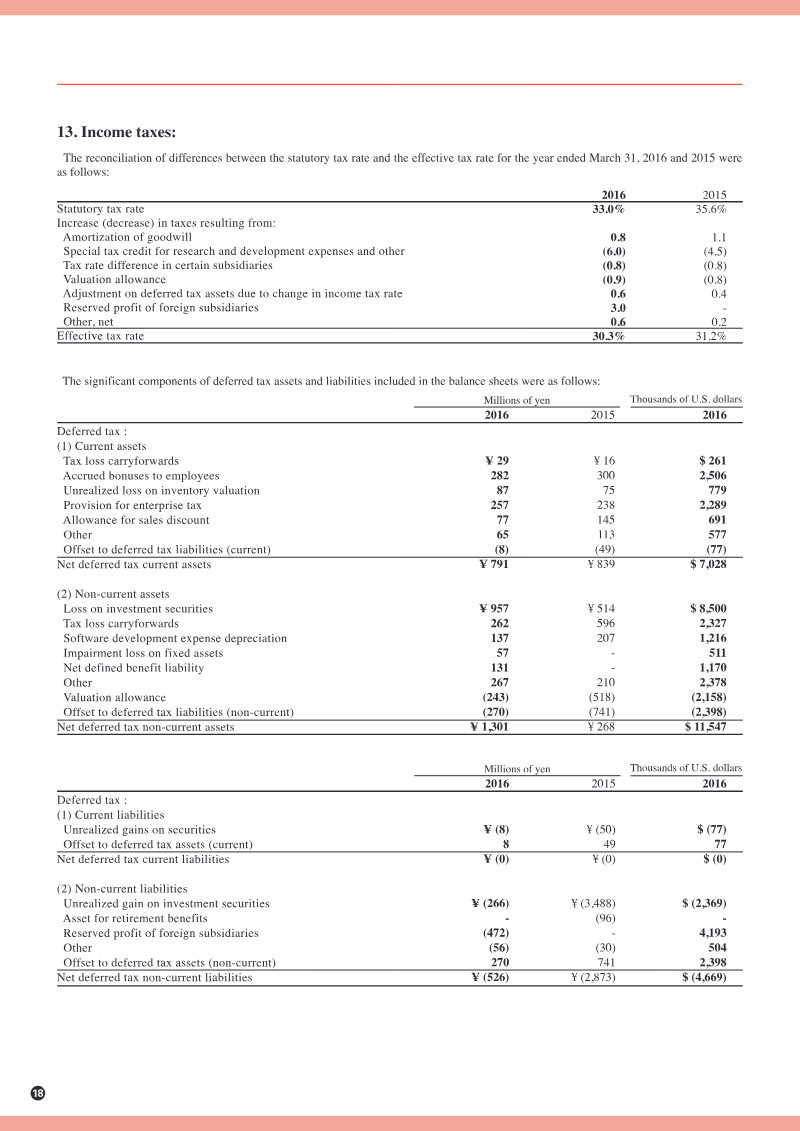
Koei Tecmo Holdings achieved record-breaking financial performance during the 2016 fiscal year, marking a sustained period of growth characterized by three consecutive years of rising sales and six consecutive years of profit expansion.
- Koei Tecmo achieved record financial performance in fiscal year 2016, marking three consecutive years of sales growth and six consecutive years of profit expansion.
- Consolidated net sales reached ¥38.3 billion, supported by a strong asset base that includes ¥59.8 billion in marketable securities.
- Growth was primarily driven by the Game Software segment, with a strategic focus on mobile and online platforms and the development of high-profile titles like Nioh.
Sega Sammy 2014 Interim Report
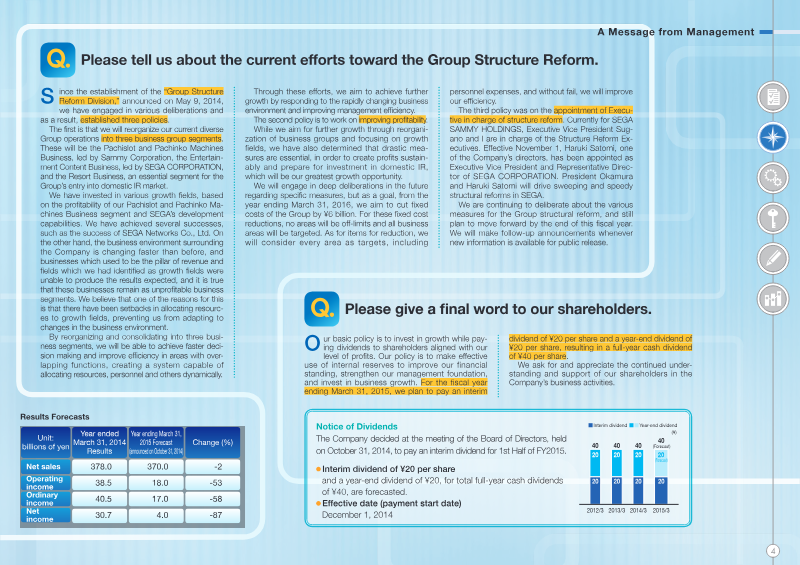
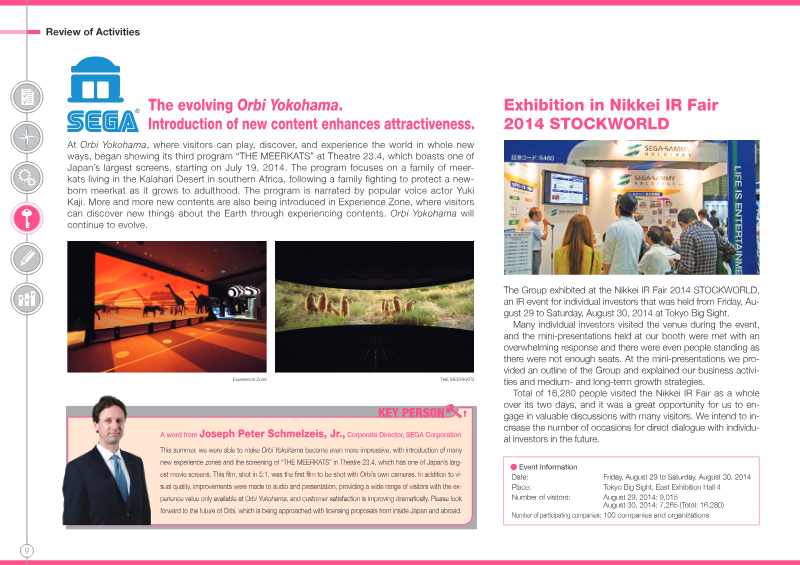
Sega Sammy experienced a period of significant financial contraction during the first half of fiscal year 2015, characterized by a 5% decline in net sales to ¥154.2 billion and a 72% collapse in operating income to ¥3.4 billion.
- Sega Sammy reported a 5% decline in net sales to ¥154.2 billion and a 72% collapse in operating income to ¥3.4 billion for the first half of fiscal year 2015, resulting in a net loss of ¥2.0 billion.
- The financial downturn was primarily caused by regulatory changes in pachislot model testing and reduced demand for packaged software and traditional toys.
- The company is implementing a restructuring plan to reduce fixed costs by ¥6 billion by fiscal year 2016 and has reorganized into a three-segment business structure.
Business Report: Summer 2015
SEGA SAMMY faced a period of significant financial contraction during the fiscal year ending March 31, 2015, recording a net loss of ¥11.2 billion alongside a 6% decline in net sales to ¥354.9 billion.
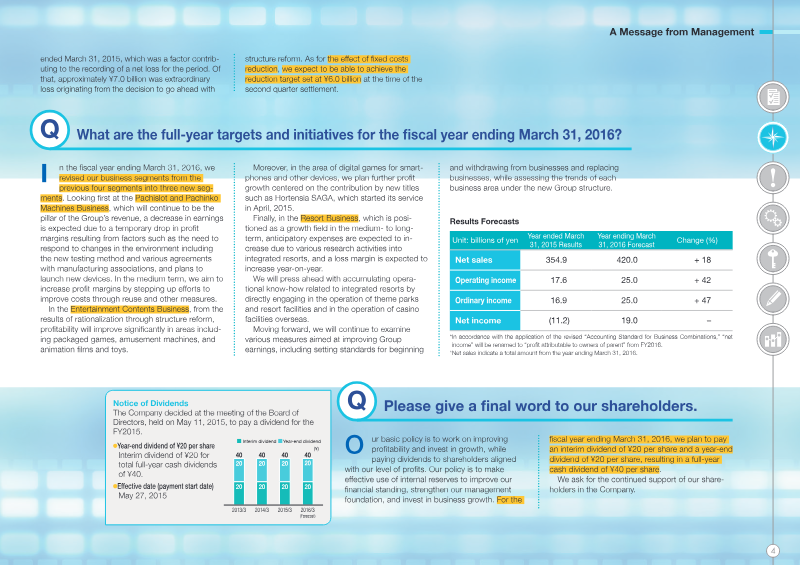
- SEGA SAMMY reported a net loss of ¥11.2 billion and a 6% decline in net sales to ¥354.9 billion for the fiscal year ending March 31, 2015.
- Management forecasts a return to profitability for the fiscal year ending March 31, 2016, projecting ¥420 billion in net sales and ¥19 billion in net income.
- The company implemented a major restructuring that consolidated operations into entertainment, digital games, and resorts, aiming for ¥6 billion in fixed cost savings through personnel reductions.
Sega Sammy Fiscal 2017 Business Report
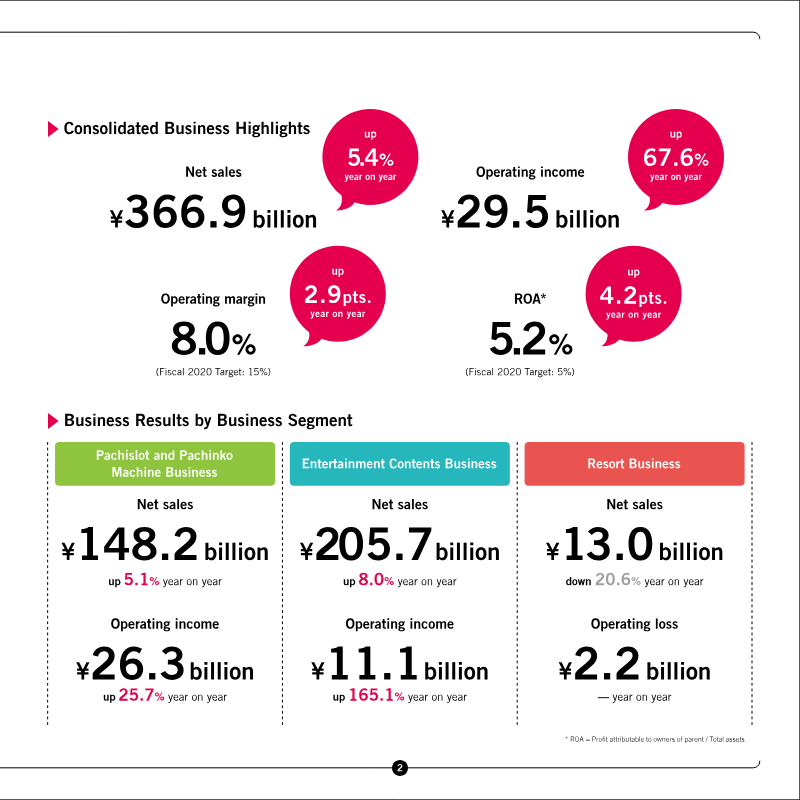
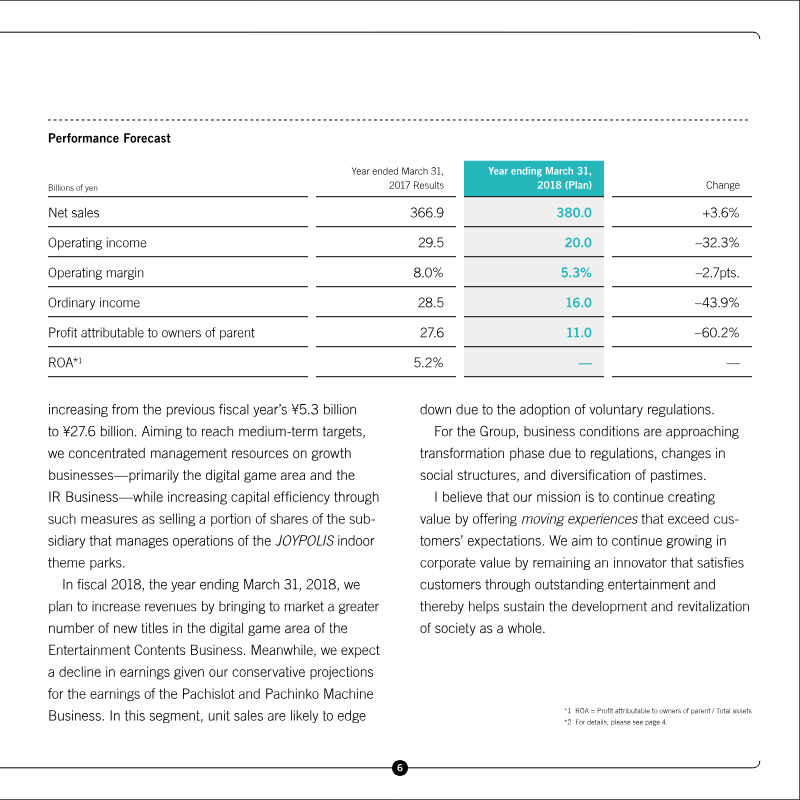
The Sega Sammy Holdings fiscal 2017 business report outlines the company’s financial performance for the period ending March 31, 2017, and details its strategic "Road to 2020" initiative.
- Sega Sammy achieved consolidated net sales of ¥366.9 billion in fiscal 2017, representing a 5.4% year-on-year increase, while operating income grew 67.6% to ¥29.5 billion.
- The Entertainment Contents segment generated ¥205.7 billion in sales, significantly aided by the global success of Persona 5, which exceeded 1.5 million units sold.
- The Pachislot and Pachinko Machine business contributed ¥148.2 billion in sales, supported by the performance of titles like Pachislot Hokuto No Ken Syura no kuni hen.
Tencent 2015 Annual Report
Tencent’s 2015 annual performance reflects a period of robust financial expansion and strategic consolidation within the Chinese technology sector.
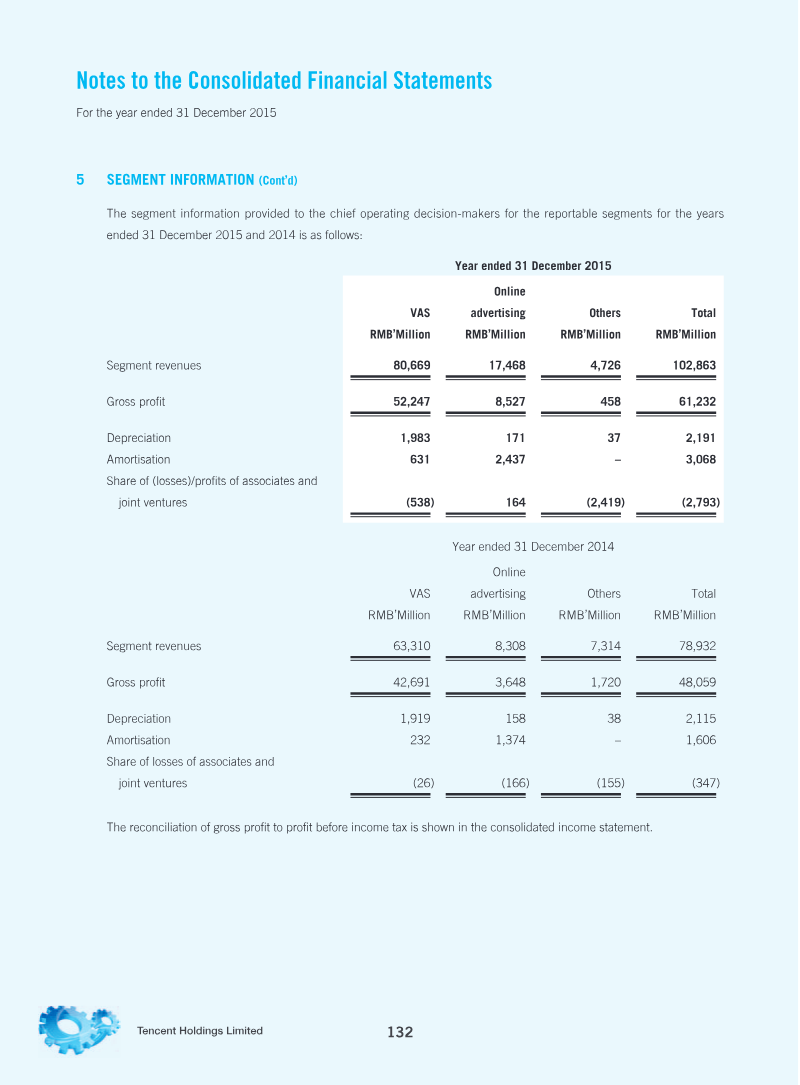
- Tencent achieved a 30% increase in total annual revenue to RMB 102.9 billion and a 21% rise in profit to RMB 28.8 billion in 2015.
- Growth was driven by a 39% increase in combined Weixin and WeChat monthly active users, a 26% rise in online game revenue, and a 110% surge in online advertising.
- The company utilized 'Structure Contracts' to consolidate domestic operating companies in restricted sectors like telecommunications and gaming, while acknowledging inherent regulatory and tax risks.
Q3 2015 Data Digest
The Q3 2015 Data Digest provides a comprehensive analysis of the iOS mobile application market, focusing on global and U.S. trends in downloads, revenue, and advertising strategies.
- Gaming remains the dominant App Store category, generating over 20 times the revenue of the next leading category.
- Clash of Clans maintained its lead in Q3 2015, though Game of War significantly narrowed the revenue gap in the U.S. market.
- Aggressive advertising on the Facebook network, particularly using high-production image and video assets, shows a strong correlation with increased revenue for gaming and lifestyle apps like those from ContextLogic.

Le Guide du PEGI: France
The Pan European Game Information (PEGI) guide serves as a comprehensive resource for understanding the standardized classification system used to inform consumers about video game content.
- The PEGI system is an industry-led classification framework officially recognized and homologated by the French Ministry of the Interior since December 2015.
- The system currently operates across 38 European countries to provide standardized age ratings and content descriptors for video games.
- The Interactive Software Federation of Europe (ISFE) developed the PEGI system to address concerns regarding content suitability for younger audiences.

Mobile Game Market
The provided content serves as a comprehensive digital repository for the mobile gaming industry, functioning as a resource hub for market analysis, publisher performance, and strategic trends as of 2026.
- Playrix has reached a significant milestone of over $12 billion in total revenue and 2.6 billion downloads as of 2026.
- Playtika has generated more than $9.3 billion in revenue specifically through in-app purchases.
- Outfit7 has achieved a massive scale in user acquisition, recording over 25 billion total downloads.
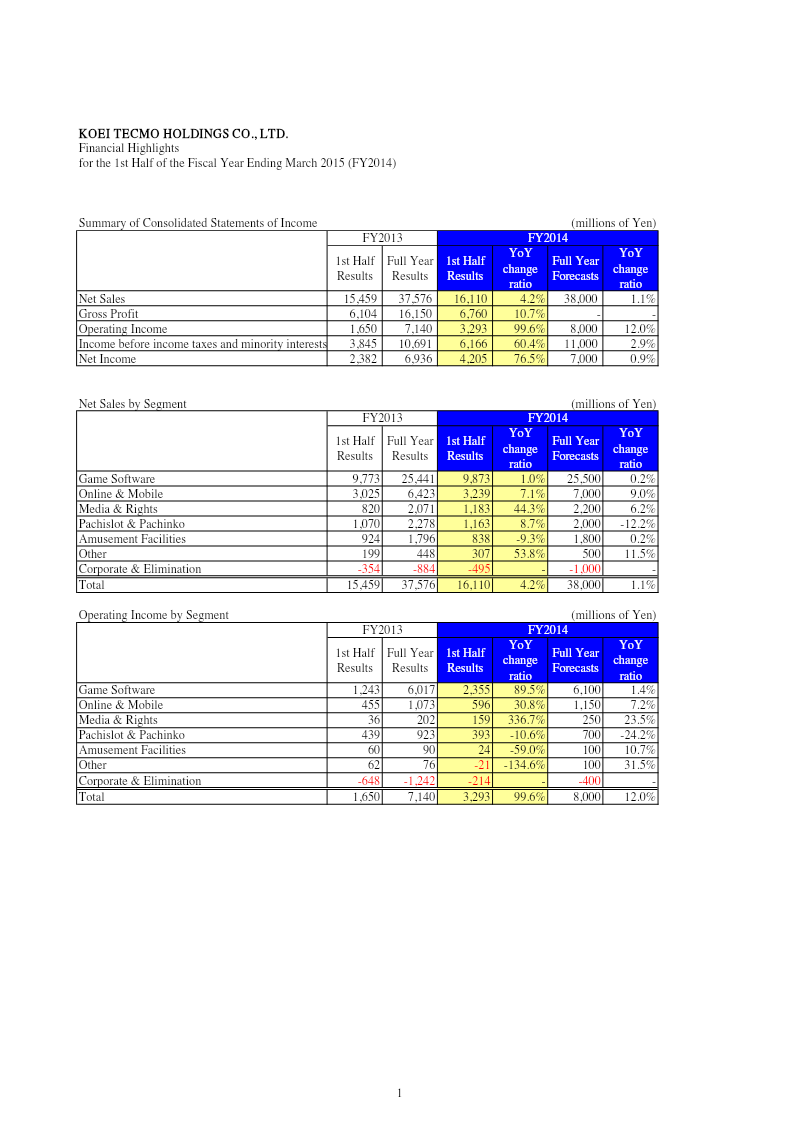
Financial Highlights: 1st Half of the Fiscal Year Ending March 2015
Financial highlights for the first half of fiscal year 2014, ending March 31 2014, show robust growth across KOEI TECMO HOLDINGS’ core segments.
- KOEI TECMO HOLDINGS achieved a 99.6% increase in operating income to ¥7,140 million and a 76.5% rise in net income to ¥6,936 million for the first half of the fiscal year ending March 2015.
- Net sales grew 4.2% year-on-year to ¥37,576 million, fueled by a 1.0% increase in game software sales and a 7.1% rise in online and mobile revenue.
- Profitability in the game software segment surged with an 89.5% increase in operating profit, while the online and mobile segment saw a 30.8% profit gain.
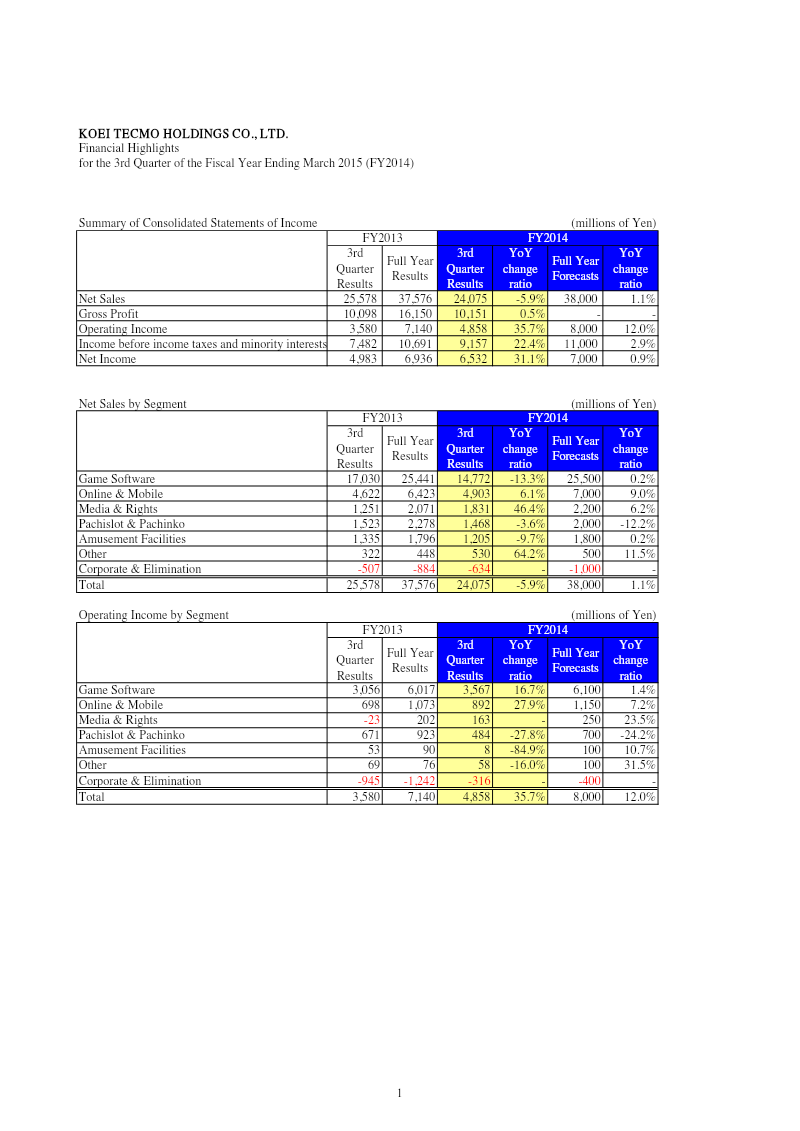
Financial Highlights: 3rd Quarter of the Fiscal Year Ending March 2015
Financial highlights for the third quarter of fiscal year 2014, ending March 31 2015, show a robust performance across KOEI TECMO HOLDINGS’ core segments.
- KOEI TECMO HOLDINGS achieved a 35.7% surge in operating income to ¥7,140 million, significantly outperforming the company's forecast by 12.0%.
- Net income for the third quarter ending March 31, 2015, rose 31.1% year-over-year to ¥6,936 million, despite a 5.9% decline in net sales to ¥37,576 million compared to the prior year.
- The Media & Rights segment experienced a sharp 46.4% revenue expansion to ¥2,071 million, successfully shifting from a loss to a profit of ¥202 million.
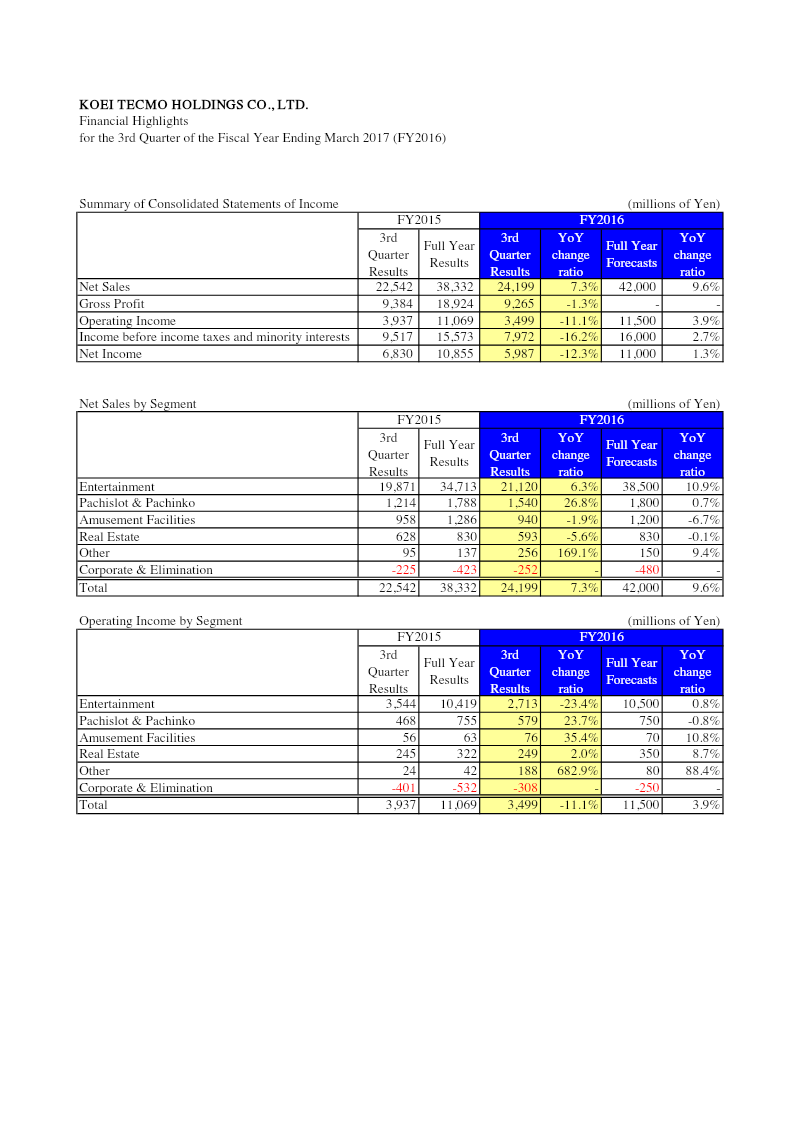
Financial Highlights: 3rd Quarter of the Fiscal Year Ending March 2017
Financial highlights for KOEI TECMO Holdings’ third quarter of fiscal 2016 reveal a robust revenue surge, with net sales rising to ¥38.3 billion from ¥22.5 billion in the same period of fiscal 2015, a 7.3% increase that aligns with the company’s forecast of 9.6%.
- KOEI TECMO Holdings reported a significant revenue increase to ¥38.3 billion for the third quarter of fiscal 2016, up from ¥22.5 billion in the same period of the previous year.
- Operating income rose 11.1% to ¥11.1 billion, while net income grew 12.3% to ¥10.9 billion, tracking closely toward the company's full-year forecast of ¥11 billion.
- The entertainment segment remains the primary driver of financial performance, generating ¥34.7 billion in sales and contributing ¥10.4 billion to the total operating income.