2015
Company
Documents about 2015
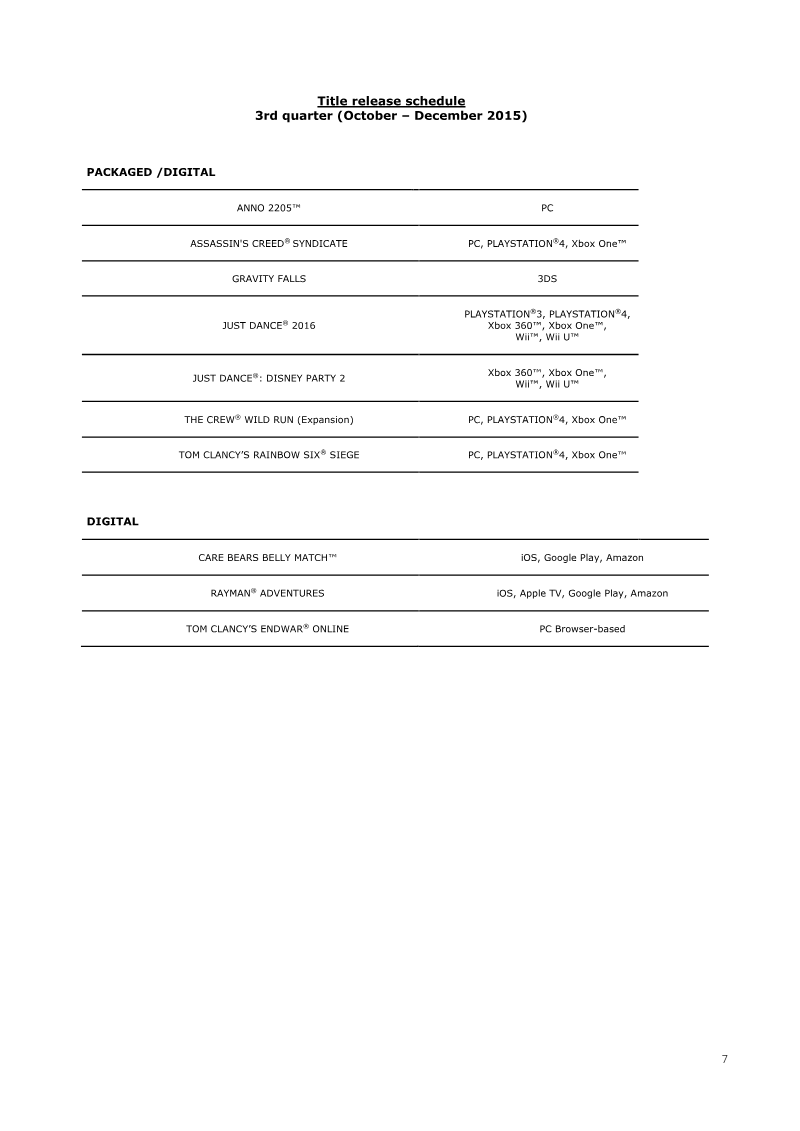
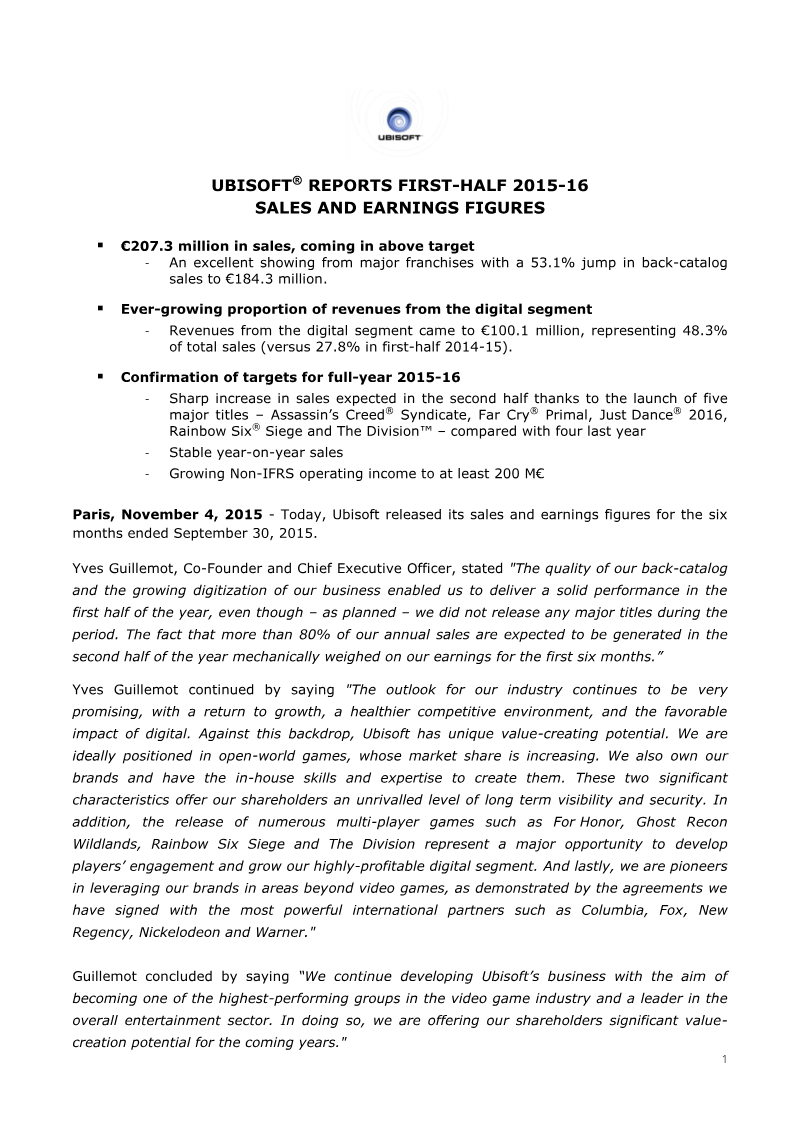
Ubisoft Reports First-Half 2015-16 Sales and Earnings Figures
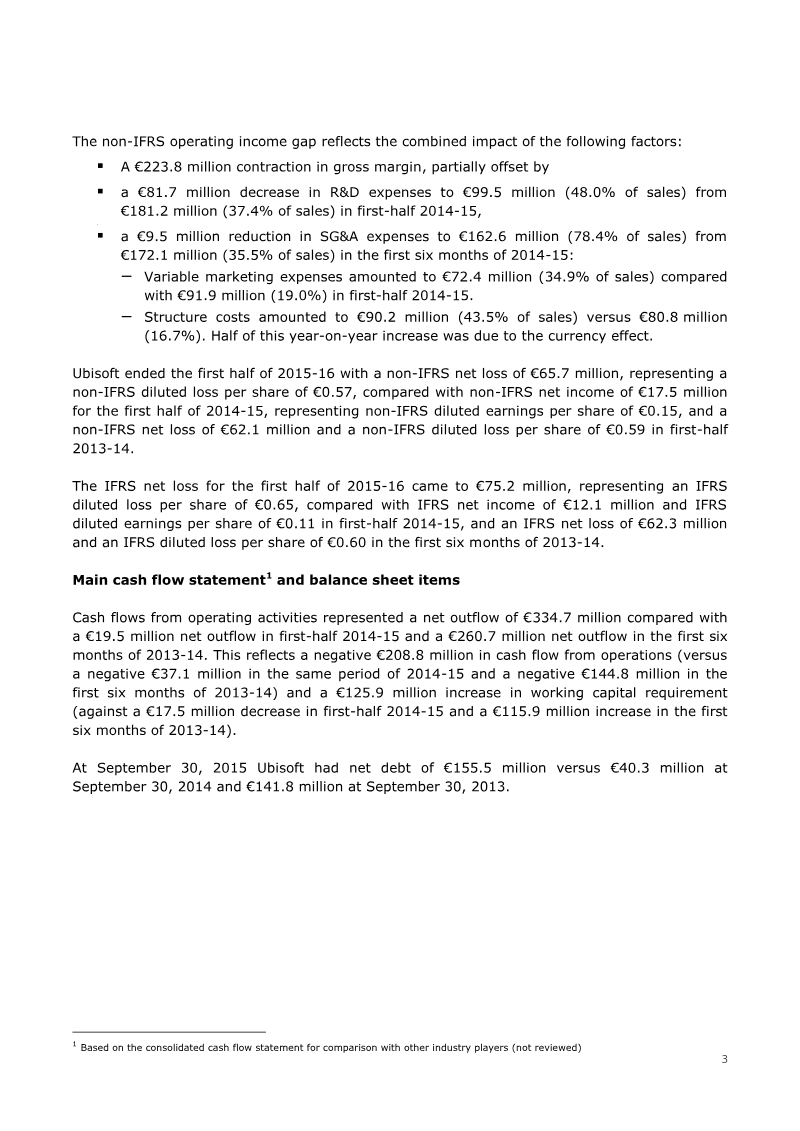
Ubisoft’s financial results for the first half of the 2015-16 fiscal year, ending September 30, 2015, demonstrate a period of planned transition characterized by a lack of major title releases.
- Ubisoft reported H1 2015-16 sales of €207.3 million, a 57.2% decline year-over-year due to a lack of major title releases in the period.
- Digital sales grew significantly to account for 48.3% of total revenue, up from 27.8% in the same period the previous year.
- Back-catalog sales increased by 53.1% to €184.3 million, driven by the sustained performance of franchises like Assassin’s Creed, Far Cry, and Just Dance.
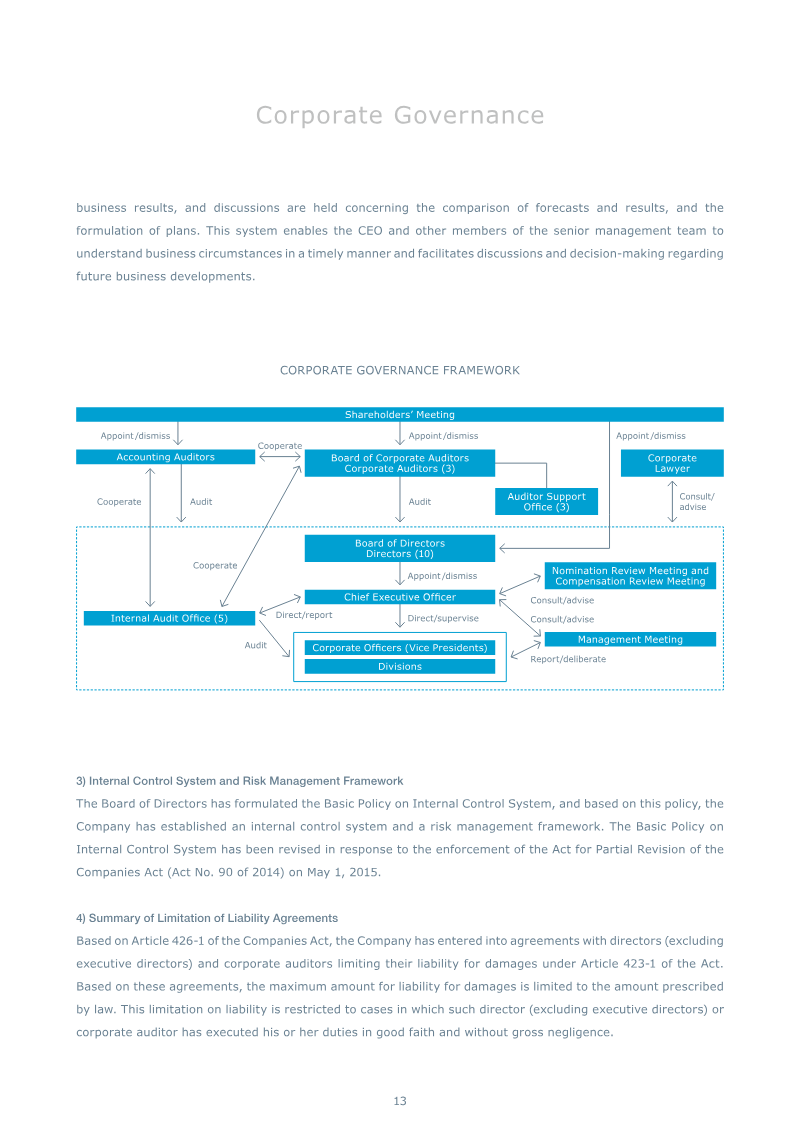
GREE Annual Report 2015
GREE’s fiscal 2015 performance reflects a period of significant structural transition and financial recalibration.
- GREE recorded a net loss of 10.3 billion yen in fiscal 2015, driven by a 26.4 percent decline in net sales to 92.5 billion yen and 35.16 billion yen in impairment losses on subsidiaries including Pokelabo and Funzio.
- Despite the net loss, the company maintains a stable financial position with 79.06 billion yen in cash and cash equivalents and an equity ratio of 80.7 percent.
- The core gaming business generates over 90 percent of total revenue, prompting a strategic pivot toward native game development with a pipeline of 15 new titles and a doubled internal staff.


Summary of Financial Results for Third Quarter of Fiscal Year Ending December 31, 2015 (Japanese GAAP) (Consolidated)
KLab Inc. reported consolidated financial results for the first nine months of the fiscal year ending December 31, 2015, demonstrating steady revenue growth and improved operating efficiency despite a decline in net income.
- KLab Inc. reported a 4.0% year-over-year revenue increase to 16.57 billion yen for the first nine months of 2015, driven almost entirely by its game business segment.
- Operating income grew by 20.1% to 2.27 billion yen, though net income declined 27.6% to 934 million yen due to foreign exchange losses and higher income taxes.
- The company's financial performance was anchored by the sustained popularity of 'Love Live! School Idol Festival' and the successful July 2015 launch of 'BLEACH Brave Souls,' which reached the top ten in App Store sales.


Consolidated Financial Results for the Six Months Ended September 30, 2015
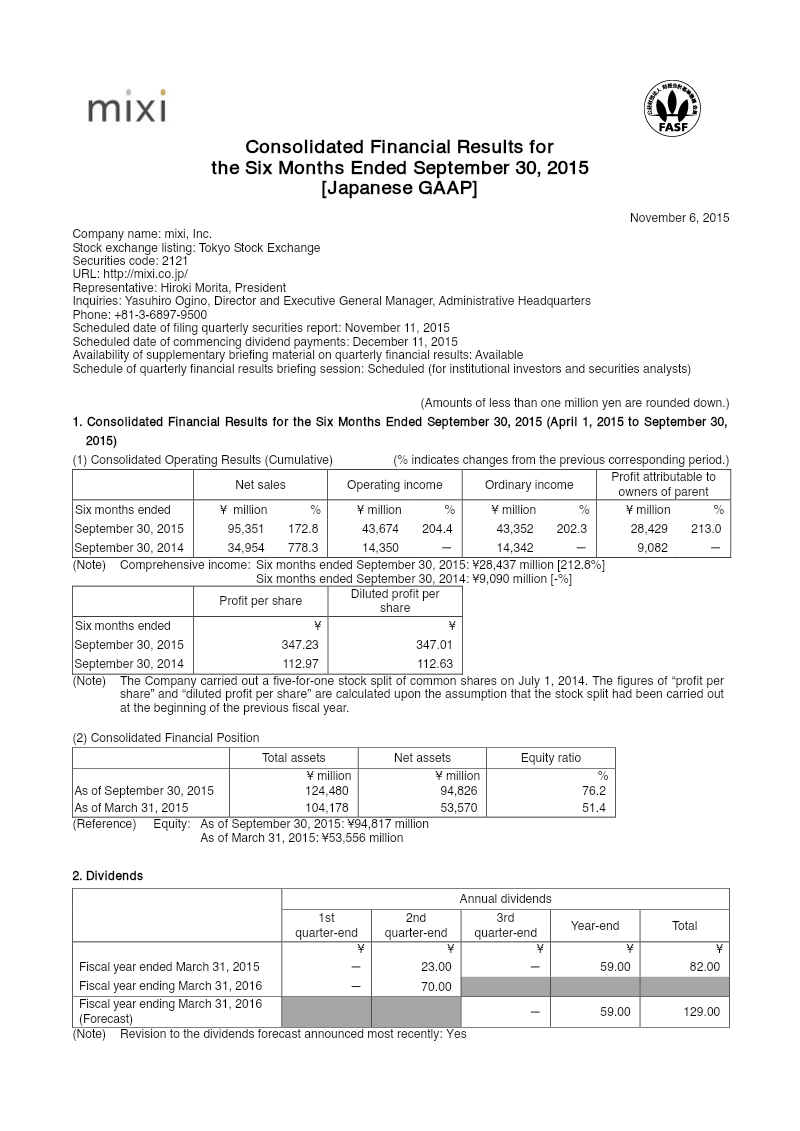
Mixi, Inc. reported significant growth in its consolidated financial results for the six months ended September 30, 2015.
- Mixi, Inc. experienced massive growth for the six months ending September 30, 2015, with net sales rising 172.8% to ¥95,351 million and operating income increasing 204.4% to ¥43,674 million.
- The Entertainment Business segment, anchored by the title Monster Strike, served as the primary revenue driver, accounting for ¥89,027 million of total net sales.
- Profit attributable to owners of the parent surged 213% to ¥28,429 million, supported by a strong financial position that saw total assets grow to ¥124,480 million and an equity ratio of 76.2%.

Aiming FY2015 Q3 Financial Results Presentation
Aiming’s fiscal year 2015 third-quarter financial results presentation outlines the company’s operational performance, strategic focus on long-term mobile game development, and financial trajectory.
- Aiming achieved strong year-over-year growth in Q3 2015, with revenue rising 59.0% to 2,998 million yen and operating profit reaching 599 million yen.
- The company has already met 101.3% of its annual operating profit target and 84.5% of its annual revenue target within the first nine months of 2015.
- Despite year-over-year gains, Q3 revenue and profit declined quarter-over-quarter due to the maturation of existing titles and a lack of promotional activity.
Aiming Q3 FY2015 Financial Results
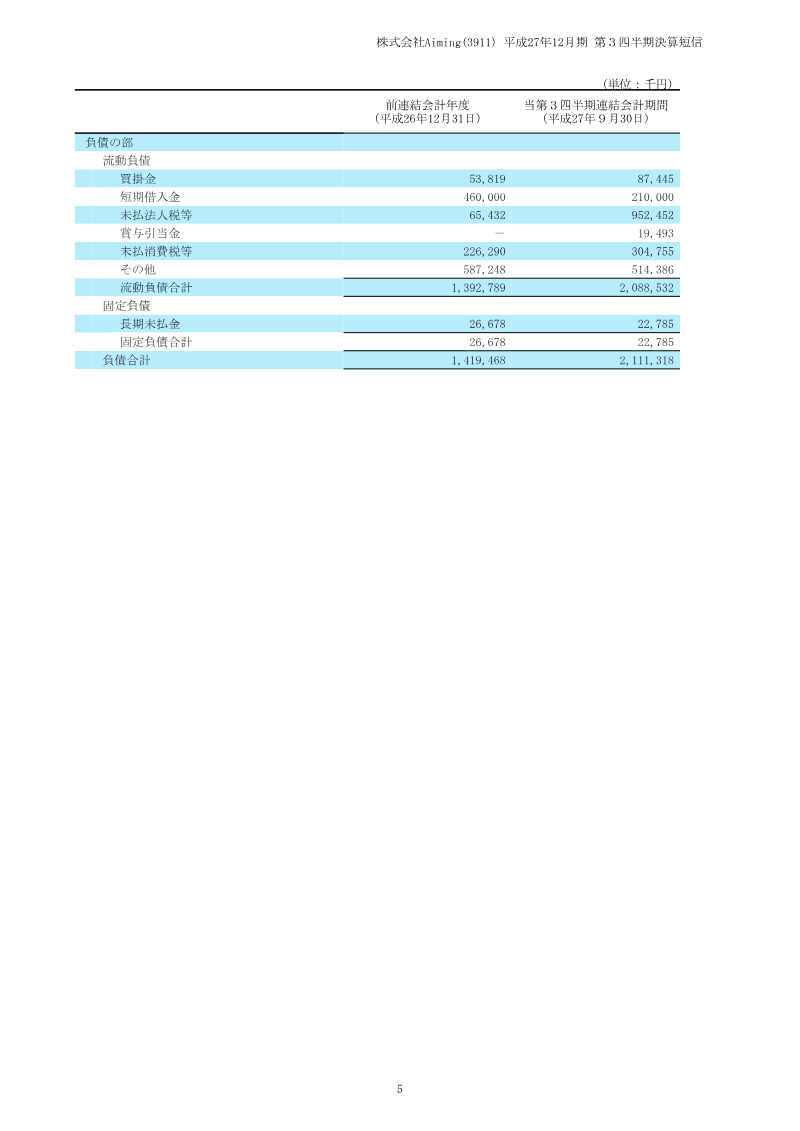
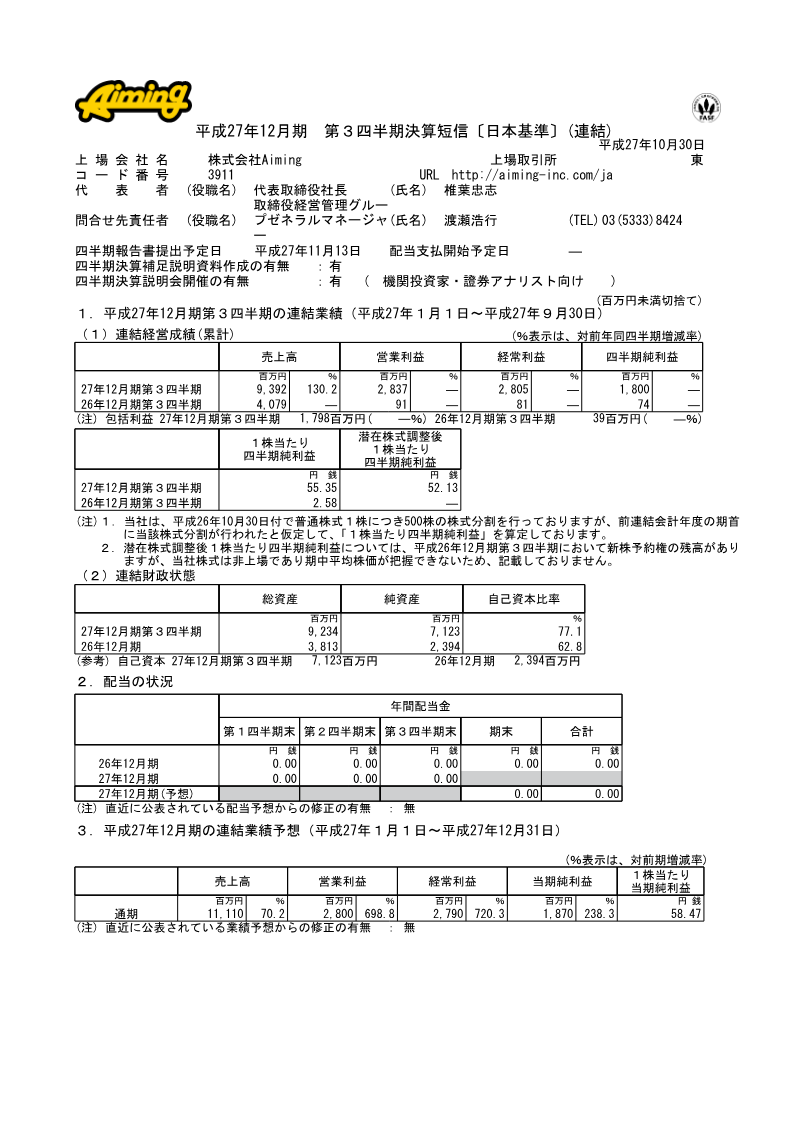
Aiming’s financial results for the third quarter of the fiscal year ending December 2015 demonstrate significant growth in both revenue and profitability compared to the same period in the previous year.
- Aiming reported significant growth in Q3 FY2015, with net sales increasing 130.2% to 9,392 million yen and operating profit rising substantially to 2,837 million yen from 91 million yen in the prior year.
- The mobile title "Logres of Swords and Sorcery: Goddess of Ancient" was the primary driver of Aiming's strong Q3 FY2015 financial performance due to its sustained user engagement and monetization.
- Aiming is expanding its portfolio by licensing and localizing international titles like "Himegami Emaki" and "Lost Regalia" to maintain competitiveness as the Japanese smartphone game market's growth decelerates.
Capcom Consolidated Financial Results: 6 Months of FY2015
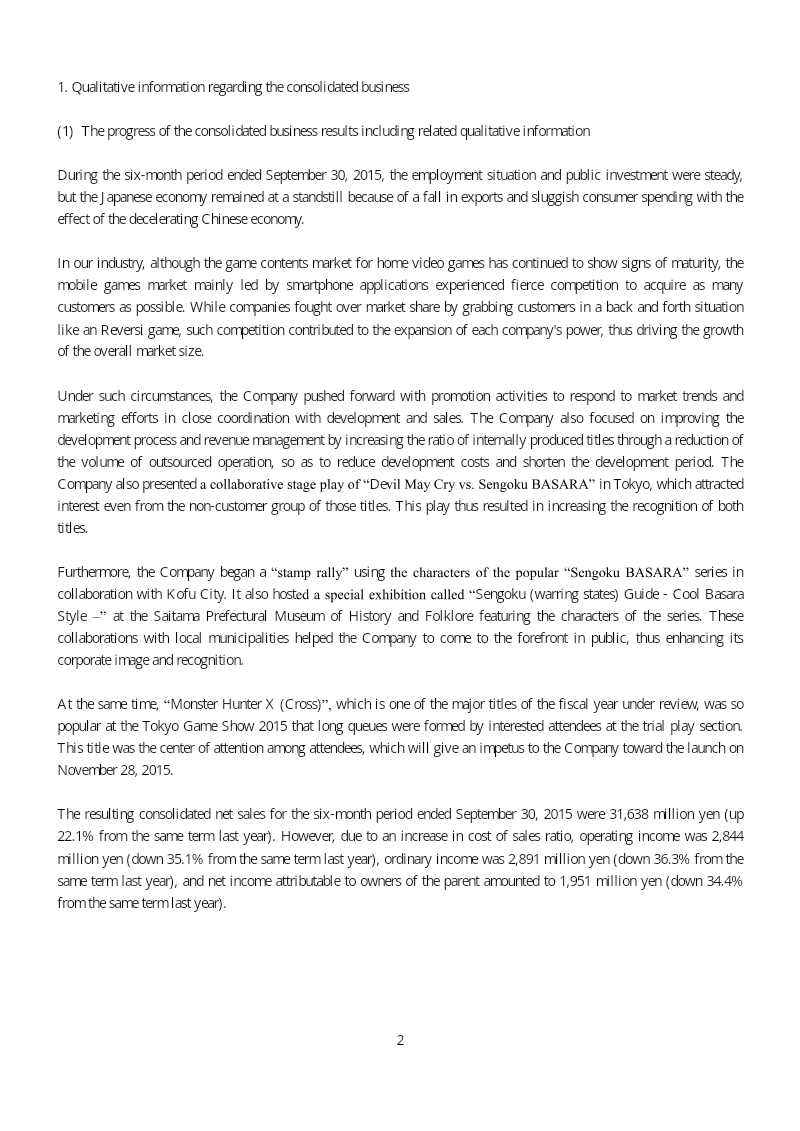
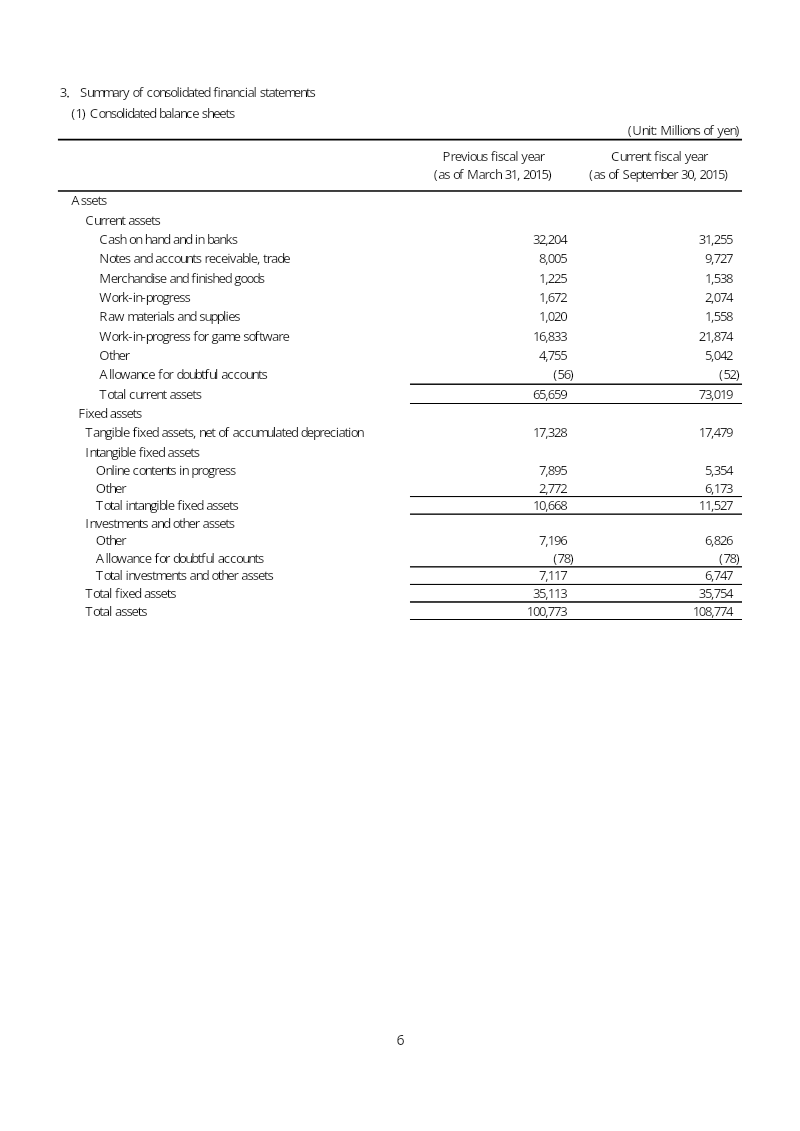
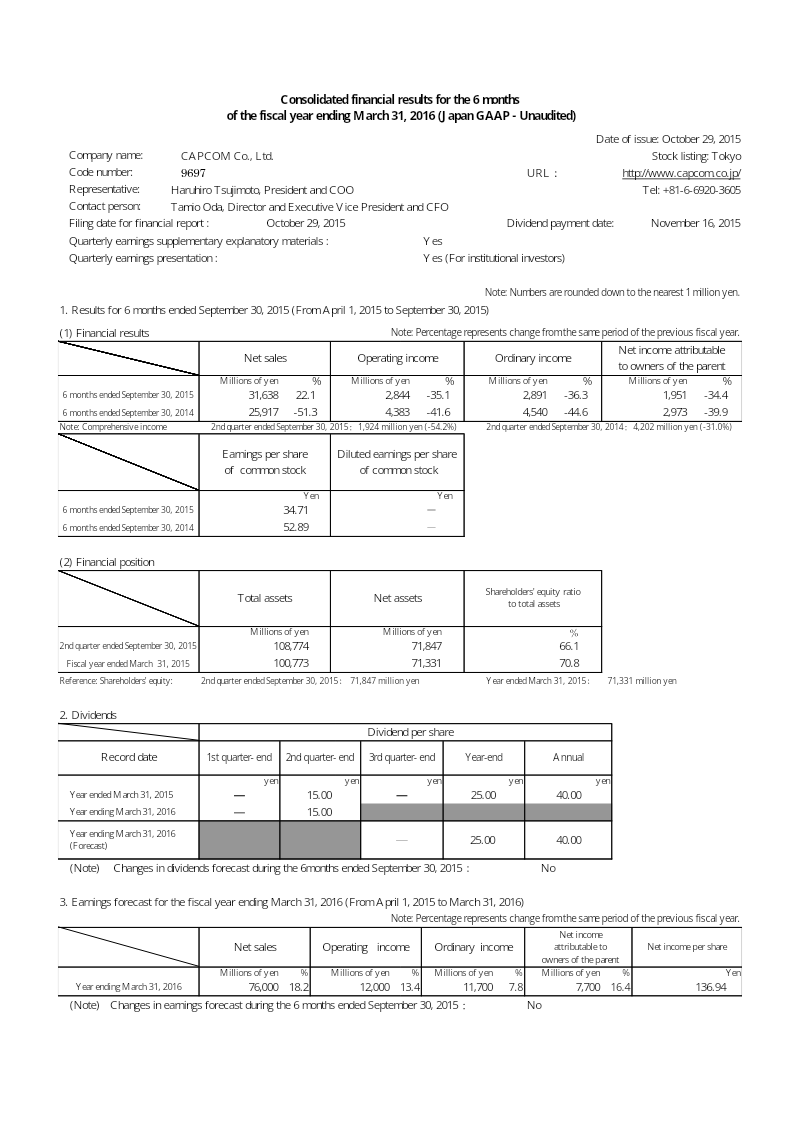
Capcom’s consolidated financial results for the six-month period ending September 30, 2015, reflect a period of revenue growth tempered by significant declines in profitability.
- Capcom reported a 22.1% increase in net sales to 31,638 million yen for the six months ending September 30, 2015, but net income fell 34.4% to 1,951 million yen due to a higher cost of sales ratio.
- The Amusement Equipments segment was the primary growth driver, with sales surging 76.3% to 12,132 million yen, largely fueled by the success of the Resident Evil 6 pachislo machine.
- Digital Contents, the company's core segment, saw a modest 6.2% sales increase but suffered a 28.7% decline in operating income.

GungHo Online Entertainment FY2015 Q3 Financial Results
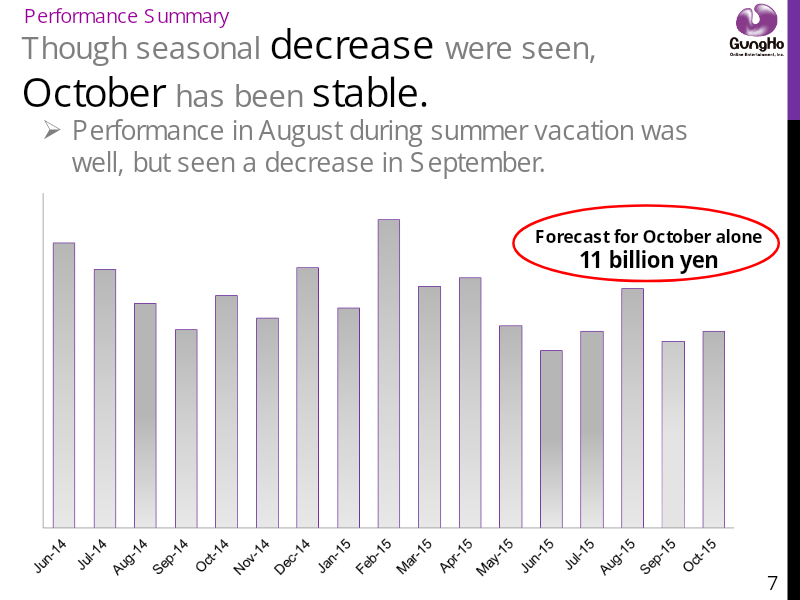
GungHo Online Entertainment’s financial results for the third quarter of 2015 reflect a stable performance despite operating within a saturated and maturing domestic Japanese market.
- GungHo Online Entertainment reported Q3 2015 sales of 36.878 billion yen and an operating profit of 17.394 billion yen.
- The company is entering the Taiwanese market through a joint venture with the Gamania Group, launching in November 2015 to access a region with over 16 million smartphone users.
- Flagship title Puzzle & Dragons maintains high monthly active user counts despite a maturing Japanese market and slowing new smartphone contract growth.


FY2016 First Quarter Financial Results
GREE’s financial results for the first quarter of fiscal year 2016 reflect a strategic shift toward profitability through rigorous cost management and the stabilization of its native game portfolio.
- GREE achieved an operating income of ¥4.4 billion in Q1 FY2016, marking quarter-on-quarter growth despite a decline in net sales to ¥19.3 billion.
- The company reduced total costs by ¥1.8 billion by cutting advertising spend, server leasing fees, and reducing headcount from 1,634 to 1,475 employees.
- GREE revised its first-half earnings forecast upward to ¥37.0 billion in net sales and ¥7.0 billion in operating income.
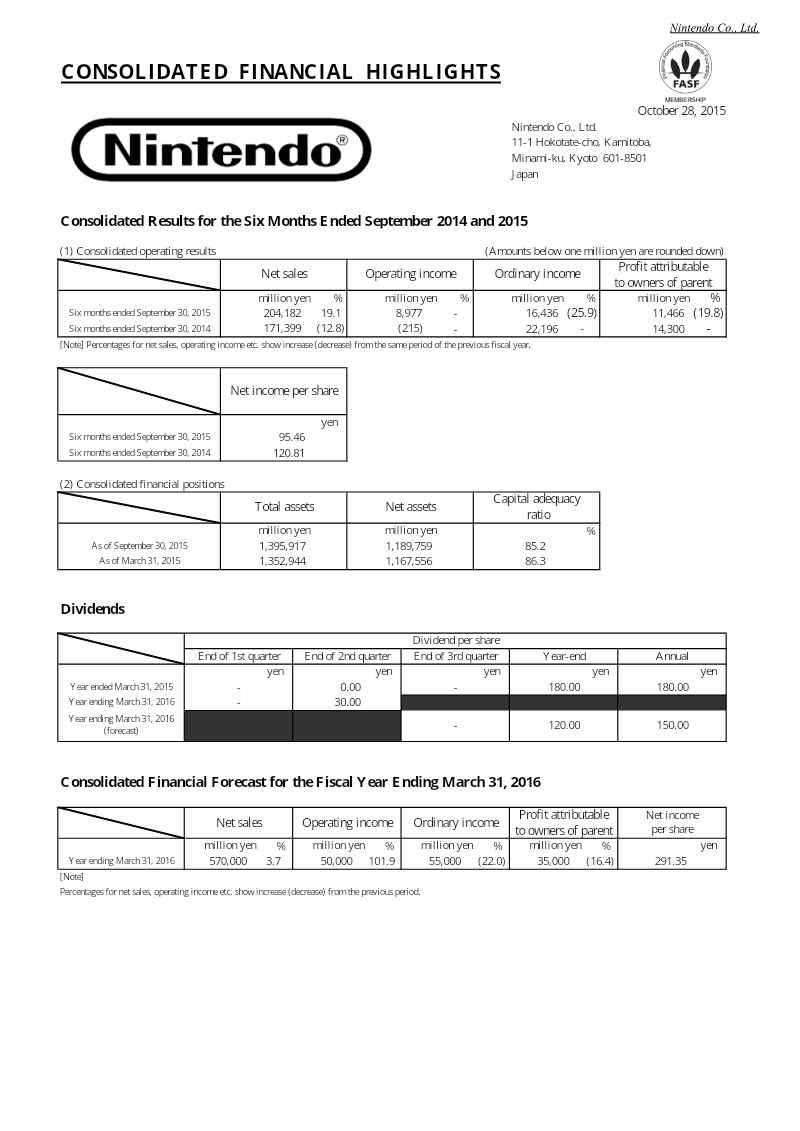
Consolidated Results for the Six Months Ended September 2014 and 2015
Nintendo Co., Ltd. reported its consolidated financial results for the six-month period ending September 30, 2015, demonstrating a recovery in operating performance compared to the same period in 2014.
- Nintendo returned to profitability for the six months ending September 30, 2015, reporting an operating income of 8.98 billion yen compared to an operating loss of 215 million yen in the same period of 2014.
- Net sales grew by 19.1% year-over-year to 204.18 billion yen, though profit attributable to owners of the parent fell 19.8% to 11.47 billion yen due to lower non-operating income.
- Overseas markets remain the primary revenue driver, accounting for 70.9% of total net sales, with the Americas serving as the largest single market at 43.3%.
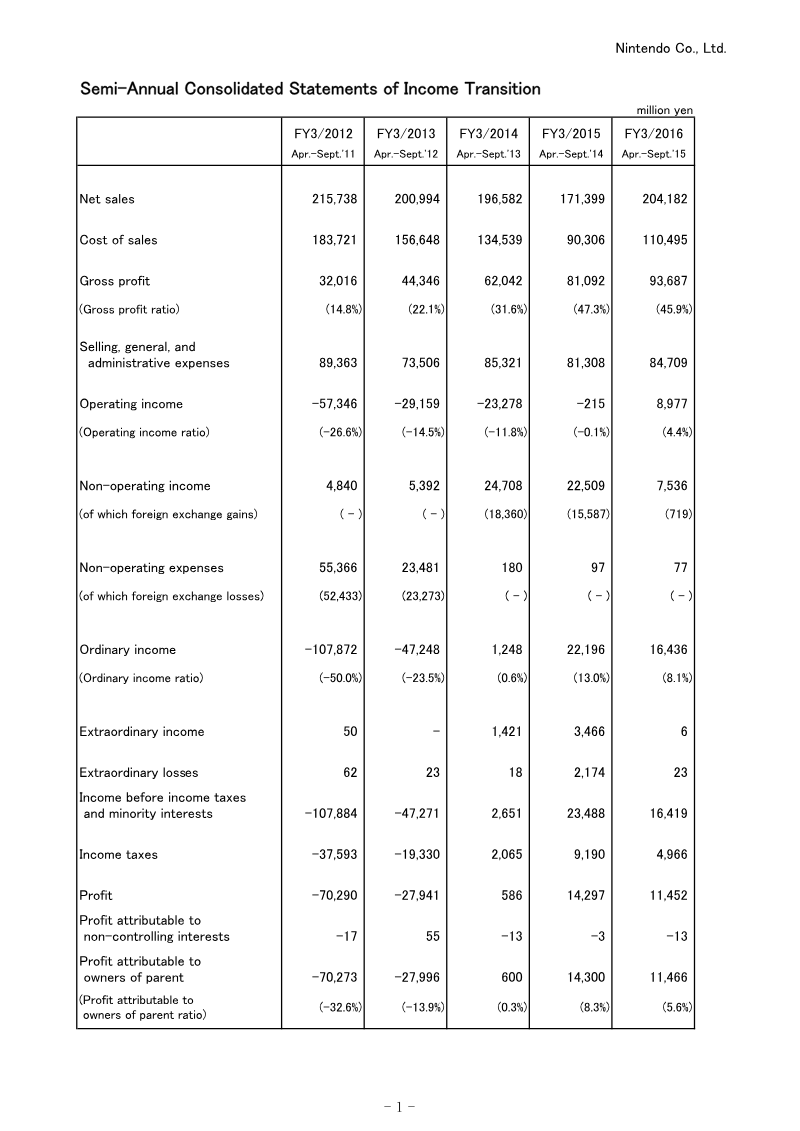
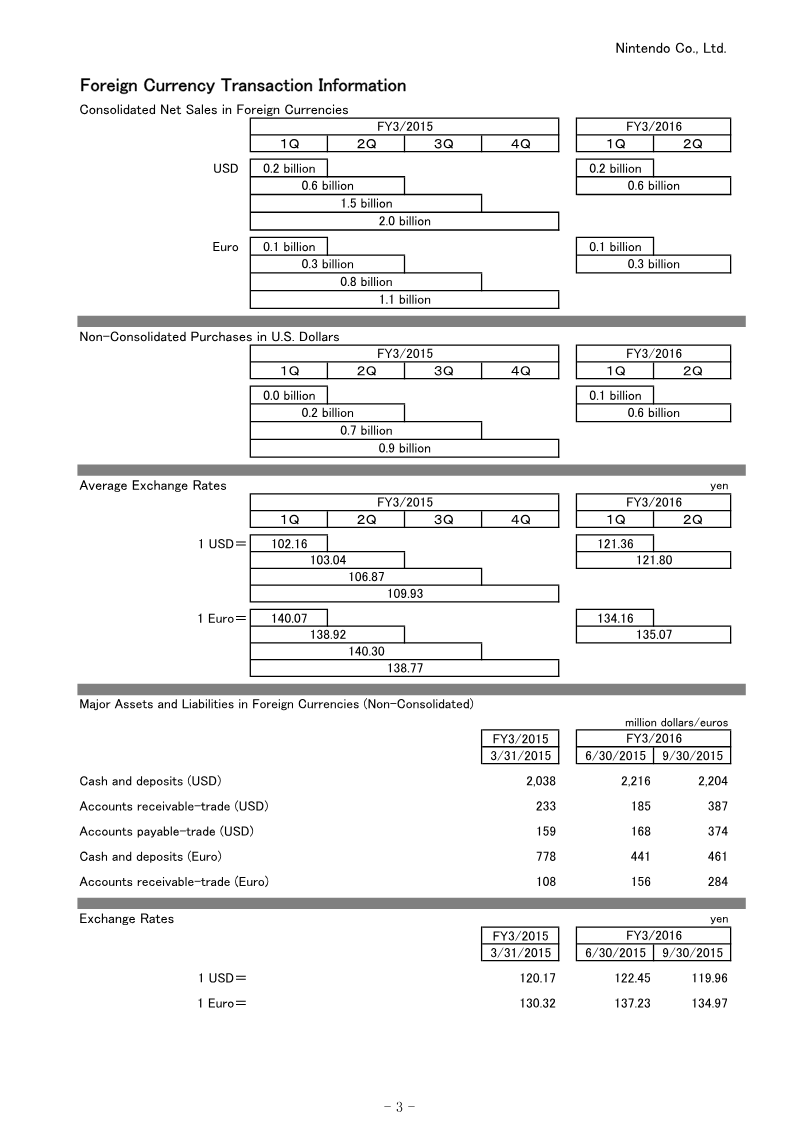
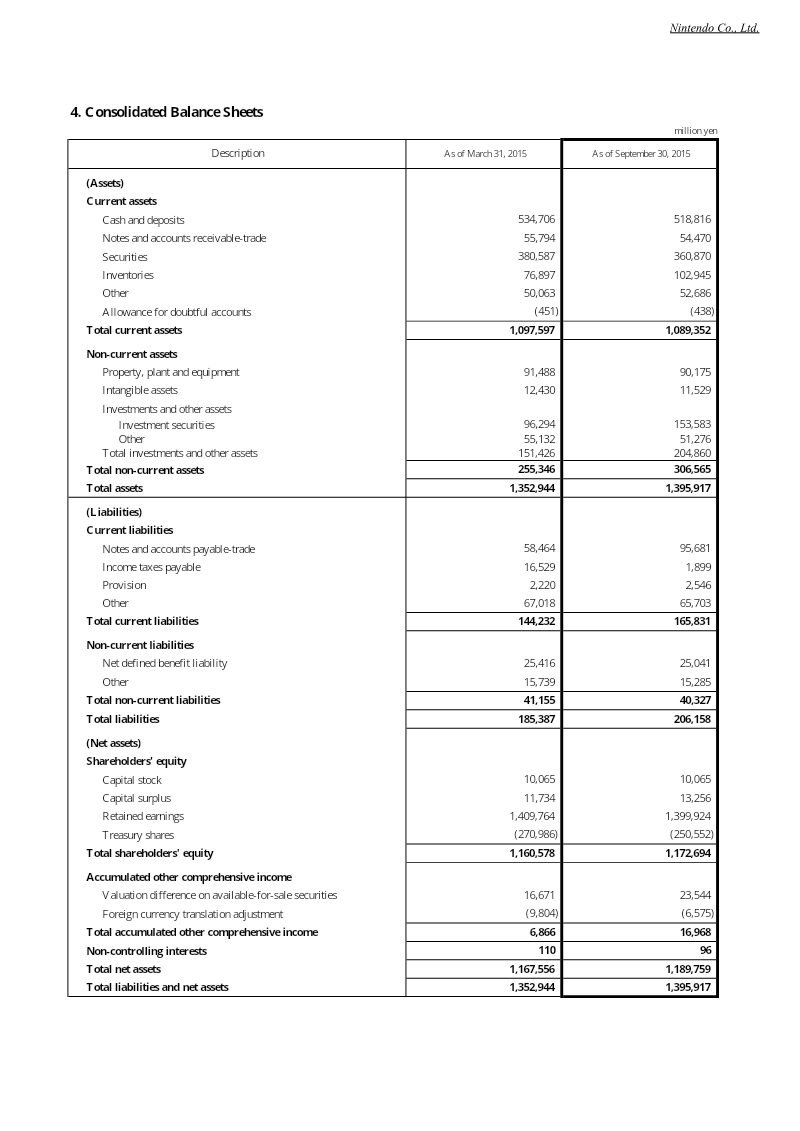
Nintendo Earnings Release: Supplementary Information (September 2015)
Nintendo’s financial results for the six-month period ending September 2015 demonstrate a return to profitability, marking a significant recovery compared to the same period in previous fiscal years.
- Nintendo returned to profitability for the six-month period ending September 2015, reporting an operating income of 8.98 billion yen compared to an operating loss of 215 million yen in the same period of 2014.
- The company achieved net sales of 204.18 billion yen and a profit attributable to owners of the parent of 11.47 billion yen.
- Gross profit reached 93.69 billion yen, maintaining a stable gross profit ratio of 45.9%.

Estimating Install Uplift from Featuring and Chart Placement
Mobile developers planning a launch often build models that assume specific install uplift from App Store or Google Play featuring and from reaching visible Top Downloaded chart positions such as rank 10 or 6.
- Estimating install uplift from featuring or chart placement based on historical data is unreliable because app launches are subject to uncontrollable exogenous factors like seasonality and competitive launch windows.
- App store ranking inflation creates a disconnect where the number of installs required to reach a top chart position is rising, while the actual install volume generated by that visibility is likely declining.
- Featuring and chart placements function as untargeted ad impressions, meaning their conversion efficacy is highly dependent on the specific appeal of the app rather than the placement itself.