2015
Company
Documents about 2015
Take-Two Interactive Form 10-Q: Q3 Fiscal Year 2015
Take-Two Interactive maintains a robust financial position as of the third quarter of fiscal year 2015, characterized by strong liquidity and a strategic pivot toward digital distribution.
- Net revenue for the nine months ended December 31, 2014, decreased by $1,372.5 million compared to the prior year, primarily driven by a $1,378.3 million decline in Grand Theft Auto franchise sales following the initial launch of Grand Theft Auto V on PS3 and Xbox 360 in the previous year.
- The revenue decline was partially offset by $134.8 million in net sales from the October 2014 releases of Borderlands: The Pre-Sequel and Sid Meier's Civilization: Beyond Earth, alongside growth in Grand Theft Auto Online revenue.
- Console platforms accounted for 79.3% of total net revenue for the nine months ended December 31, 2014, down from 92.6% in the prior year period, while PC and other sales grew to 20.7% of total revenue.
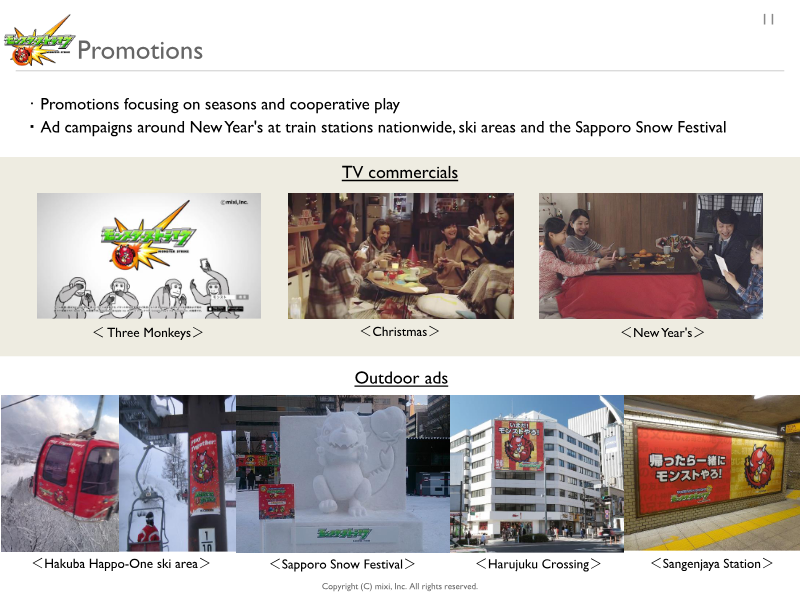
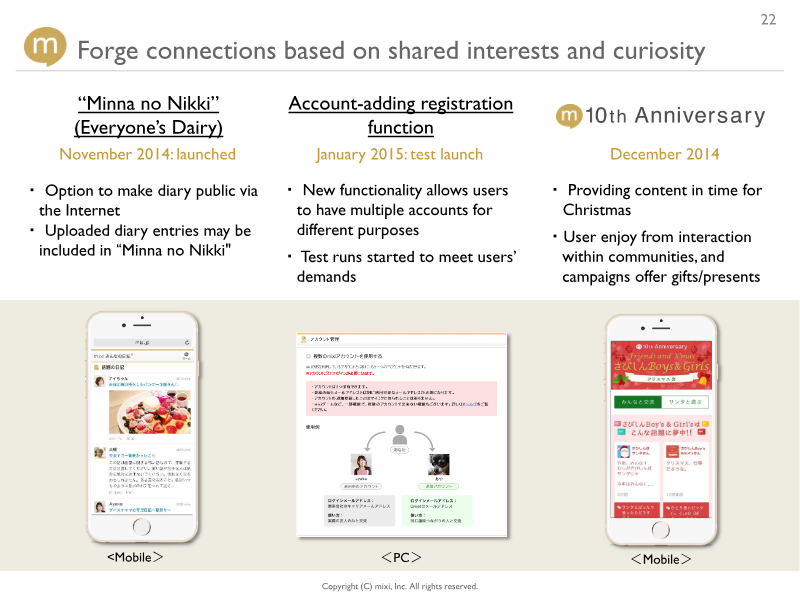
Mixi FY2014 Third-Quarter Earnings Results Briefing Session
Mixi, Inc. experienced significant financial growth during the third quarter of fiscal year 2014, driven primarily by the rapid expansion of its flagship smartphone game, Monster Strike.
- Mixi reported Q3 FY2014 sales of 33.3 billion yen, a 49.8% increase quarter-over-quarter, with operating profit rising 60.7% to 15.6 billion yen.
- The mobile game Monster Strike drove the majority of revenue, generating 30.5 billion yen in Q3 compared to 19.4 billion yen in Q2.
- Following the strong quarterly performance, Mixi upwardly revised its full-year earnings forecast, projecting content sales to exceed 40 billion yen and increasing the annual dividend to 79 yen per share.



FY2015 Second Quarter Financial Results
GREE’s financial performance for the second quarter of fiscal year 2015 reflects a company in the midst of a significant structural transition, characterized by a pivot toward native mobile applications and a diversification of its business portfolio.
- GREE reported a net loss of ¥7.7 billion for Q2 FY2015, driven by an ¥18.4 billion extraordinary impairment charge related to the acquisitions of OpenFeint and Pokelabo.
- Despite the net loss, the company achieved ¥24.1 billion in net sales and ¥4.7 billion in operating income, maintaining a full-year operating income forecast of ¥20.0 billion.
- The company is aggressively pivoting to native mobile applications, supported by a development pipeline of 17 new titles and a dedicated team of 550 developers.

Capcom Forecast Revisions for the Fiscal Year Ending March 31, 2015
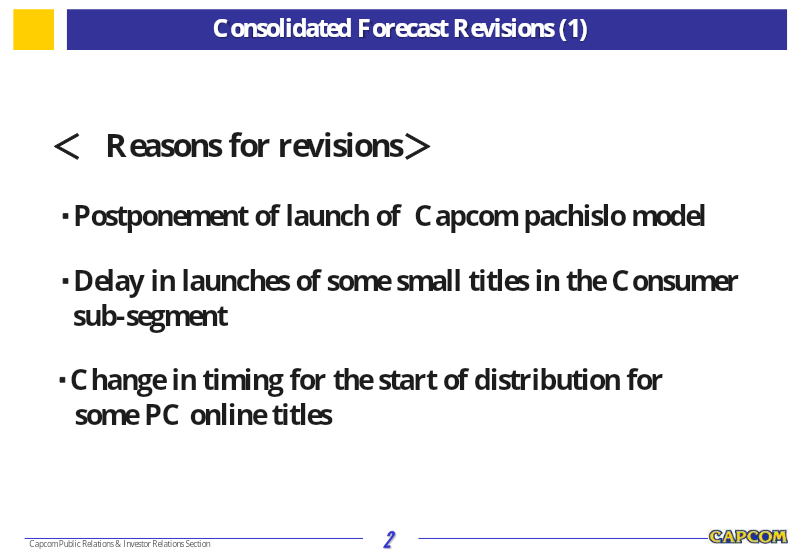
Capcom revised its financial outlook for the fiscal year ending March 31, 2015, citing operational delays across multiple business segments.
- Capcom lowered its fiscal year 2015 net sales forecast by 18.8%, dropping from 80 billion yen to 65 billion yen due to product launch delays.
- The revenue shortfall was driven by the postponement of a pachislo machine, delays in small-scale consumer titles, and the rescheduling of PC online game distributions.
- Despite the revenue decline, the operating income forecast remains stable at 10.5 billion yen, supported by high-margin digital sales and corporate cost-cutting measures.

Capcom 3rd Quarter Financial Results: Fiscal Year Ending March 31, 2015
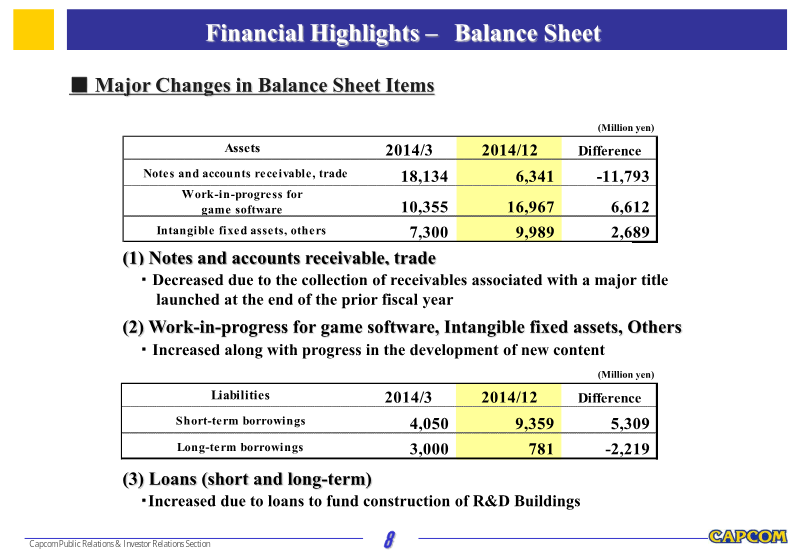
Capcom’s financial results for the third quarter of the fiscal year ending March 31, 2015, reflect a strategic shift toward improved profitability despite a decline in overall net sales.
- Capcom reported a significant decline in net sales to 47.8 billion yen for the nine months ending December 31, 2014, down from 75.2 billion yen in the same period the previous year.
- Operating income increased to 9.7 billion yen from 8.5 billion yen, driven by structural reforms that reduced the cost of sales by 6 billion yen.
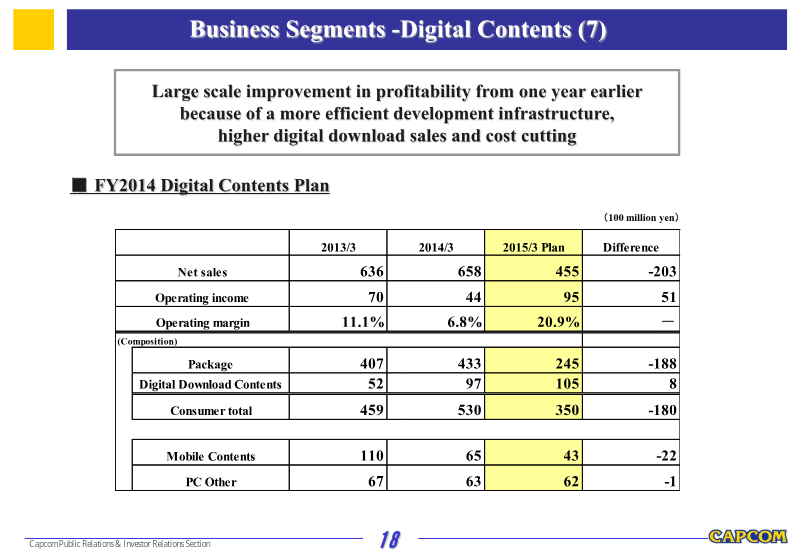
- The digital contents segment achieved an operating margin of 26.1%, bolstered by a higher ratio of digital download sales and more efficient internal development processes.
Capcom Consolidated Financial Results: 9 Months Ended March 31, 2015
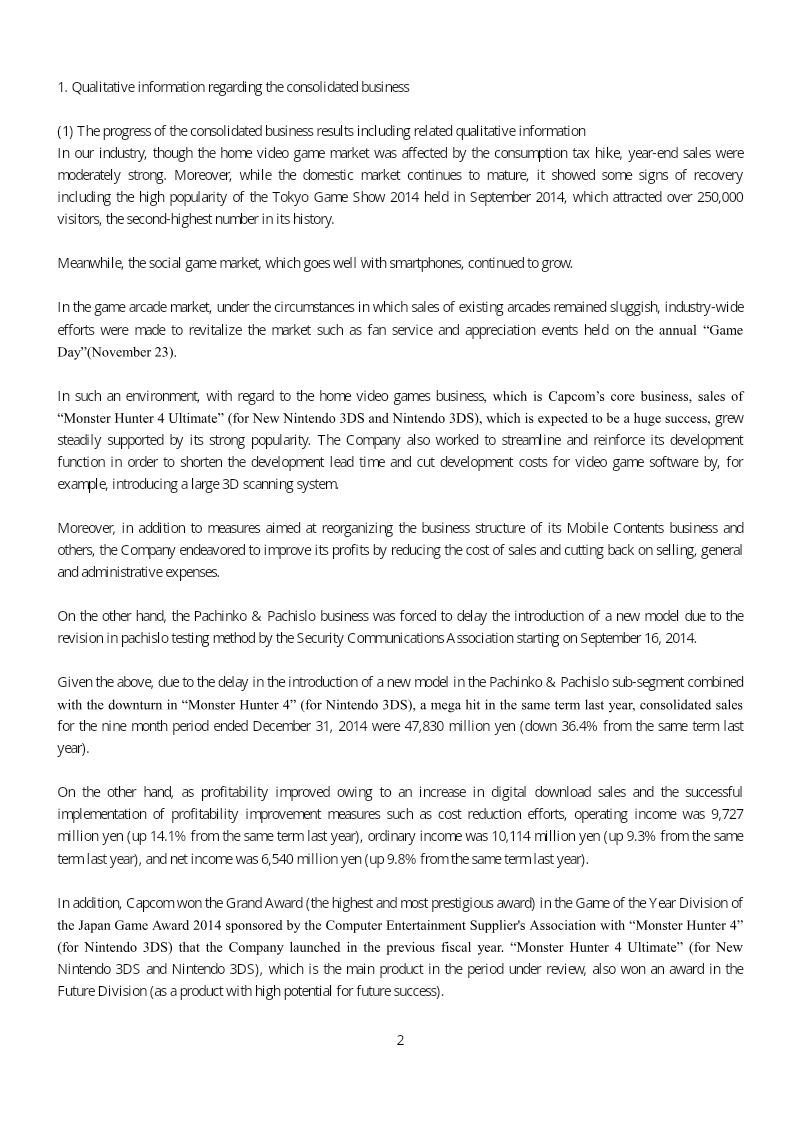
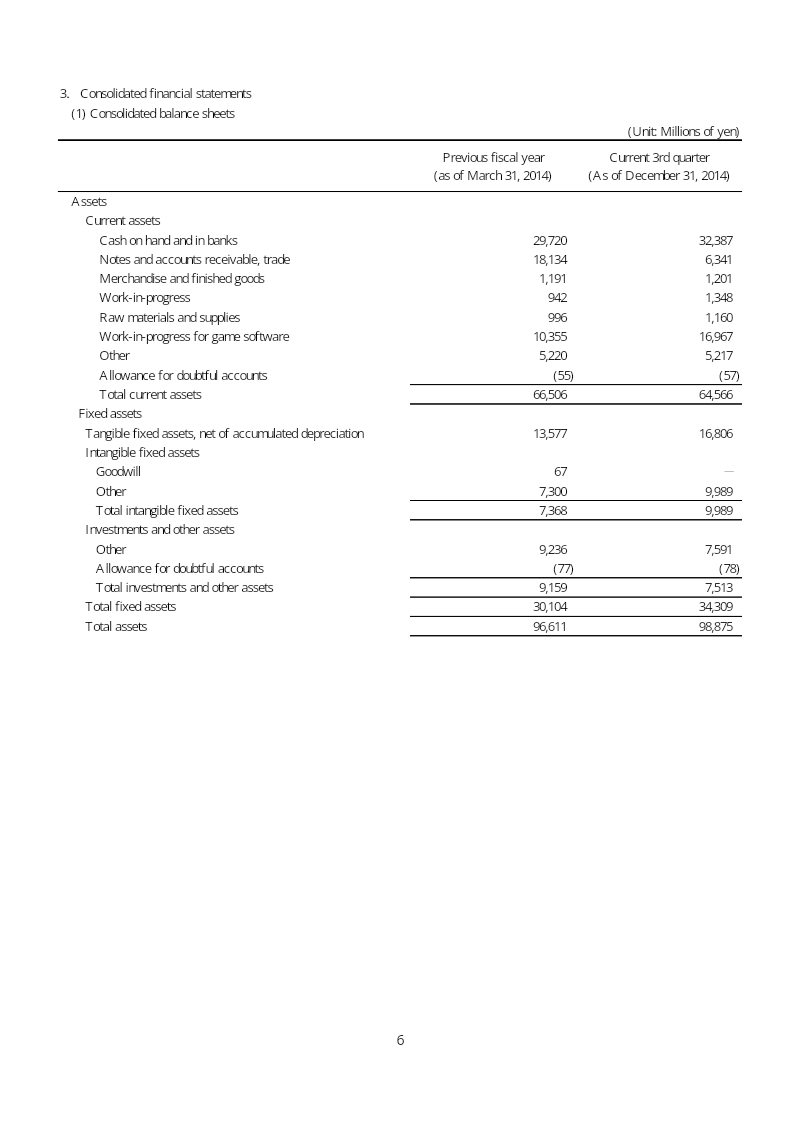
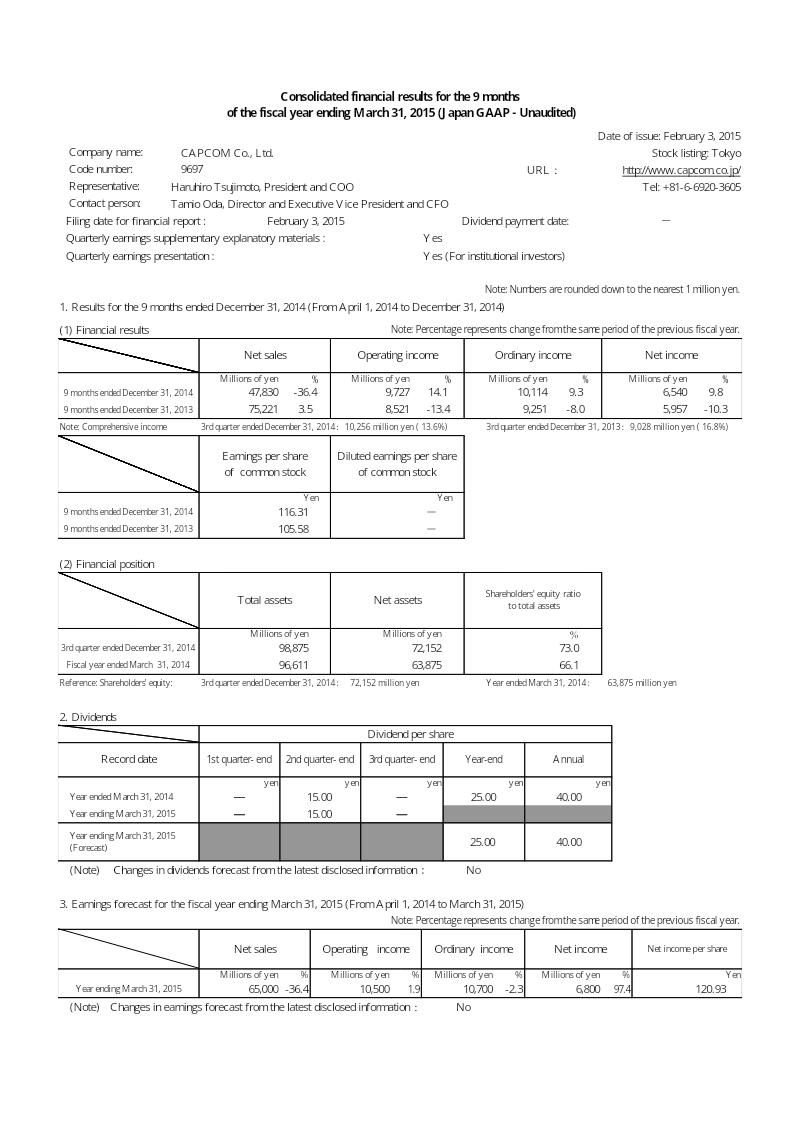
Capcom’s consolidated financial results for the nine-month period ending December 31, 2014, reflect a period of significant structural transition and profitability improvement despite a sharp decline in top-line revenue.
- Capcom experienced a 36.4% year-over-year decline in net sales to 47,830 million yen for the nine-month period ending December 31, 2014, primarily due to the absence of a major hit title and regulatory delays in the Pachinko & Pachislo segment.
- Despite the revenue contraction, operating income grew by 14.1% to 9,727 million yen and net income rose by 9.8% to 6,540 million yen, driven by cost-reduction initiatives and a focus on digital download sales.
- The Digital Contents business served as the primary revenue engine, generating 32,408 million yen in sales, bolstered by the performance of Monster Hunter 4 Ultimate and various overseas titles.

GungHo Online Entertainment FY2014 Financial Results Briefing Session
GungHo Online Entertainment’s fiscal year 2014 financial results demonstrate the sustained commercial success of its flagship mobile title, Puzzle & Dragons (P&D).
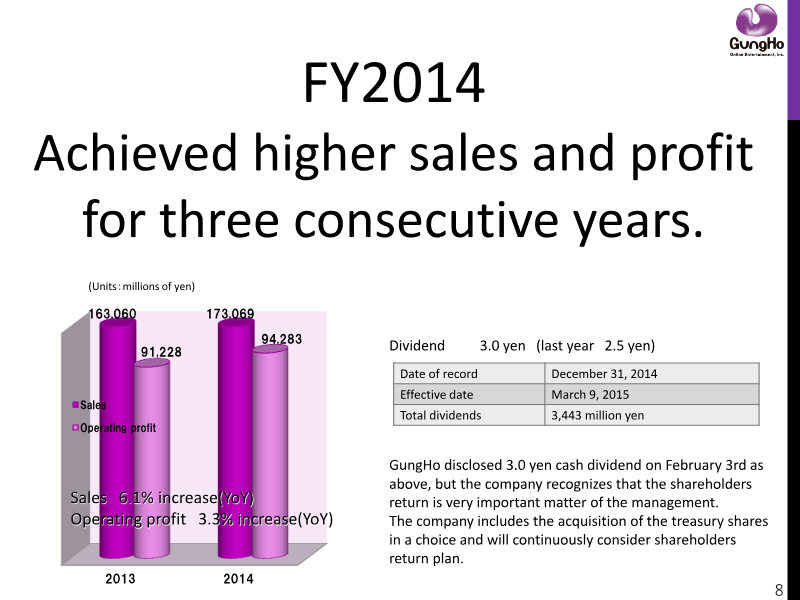
- GungHo Online Entertainment achieved its third consecutive year of growth in FY2014, reporting 173.07 billion yen in sales and 94.28 billion yen in operating profit, up 6.1% and 3.3% respectively.
- The flagship mobile title Puzzle & Dragons remains the company's primary revenue driver, reaching 33 million domestic downloads and 10 million international downloads by early 2015.
- The company is prioritizing international expansion for 2015, including a partnership with Tencent to launch Puzzle & Dragons in China and further pushes into U.S. and European markets.


Summary of Financial Results for Fiscal Year Ended December 31, 2014 (Japanese GAAP) (Consolidated)
KLab Inc. achieved a significant financial turnaround during the fiscal year ended December 31, 2014, transitioning from a substantial net loss of 2.56 billion yen in 2013 to a net income of 1.79 billion yen.
- KLab Inc. achieved a financial turnaround in 2014, moving from a 2.56 billion yen net loss in 2013 to a net income of 1.79 billion yen.
- Record-high revenue of 21.37 billion yen was driven by the success of 'Love Live! School Idol Festival' and a strategic pivot to mobile platforms.
- Apple and Google served as the primary revenue drivers, generating over 16.4 billion yen in combined sales.


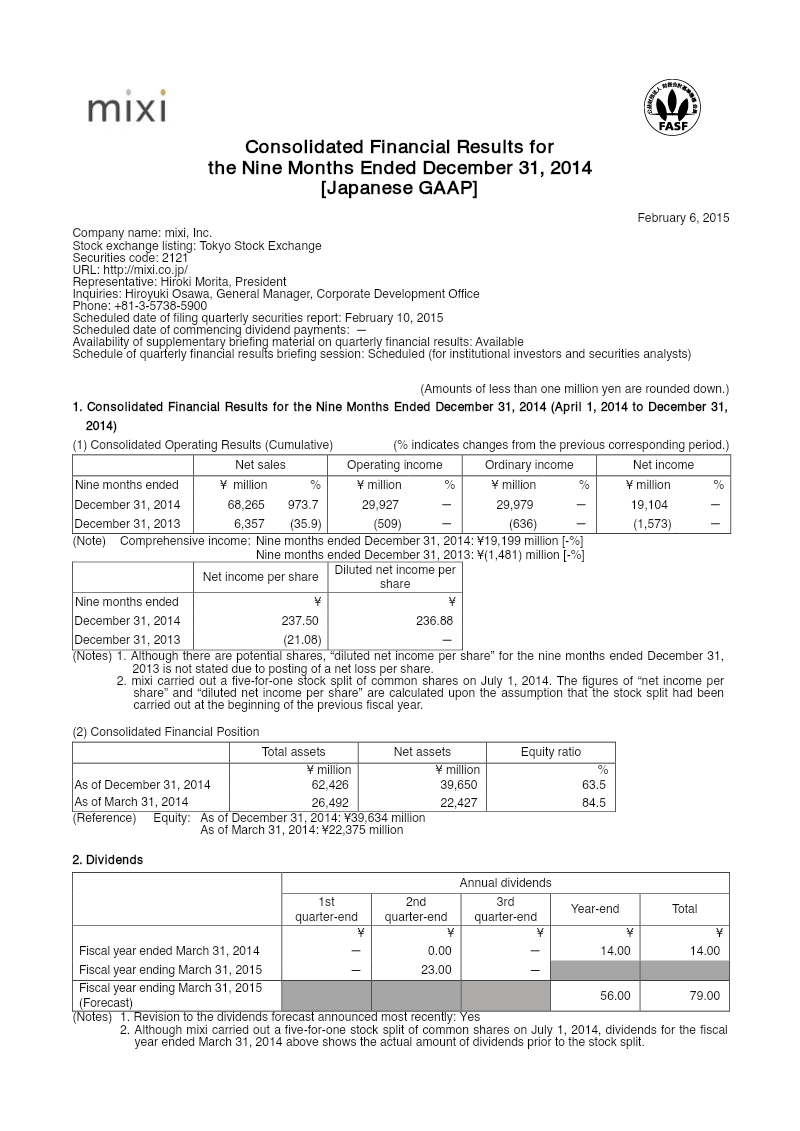
Consolidated Financial Results for the Nine Months Ended December 31, 2014
mixi, Inc. reported a dramatic surge in consolidated results for the nine months ended December 31, 2014 (April 1 to December 31, 2014) under Japanese GAAP.
- Mixi, Inc. experienced explosive growth in the first nine months of fiscal year 2015, with net sales surging 973.7% year-over-year to 68,265 million yen.
- The company achieved a significant profitability turnaround, moving from an operating loss of 509 million yen in 2013 to an operating income of 29,927 million yen by December 31, 2014.
- The Media & Content segment served as the primary growth engine, generating 63,658 million yen in sales and 31,198 million yen in segment income.
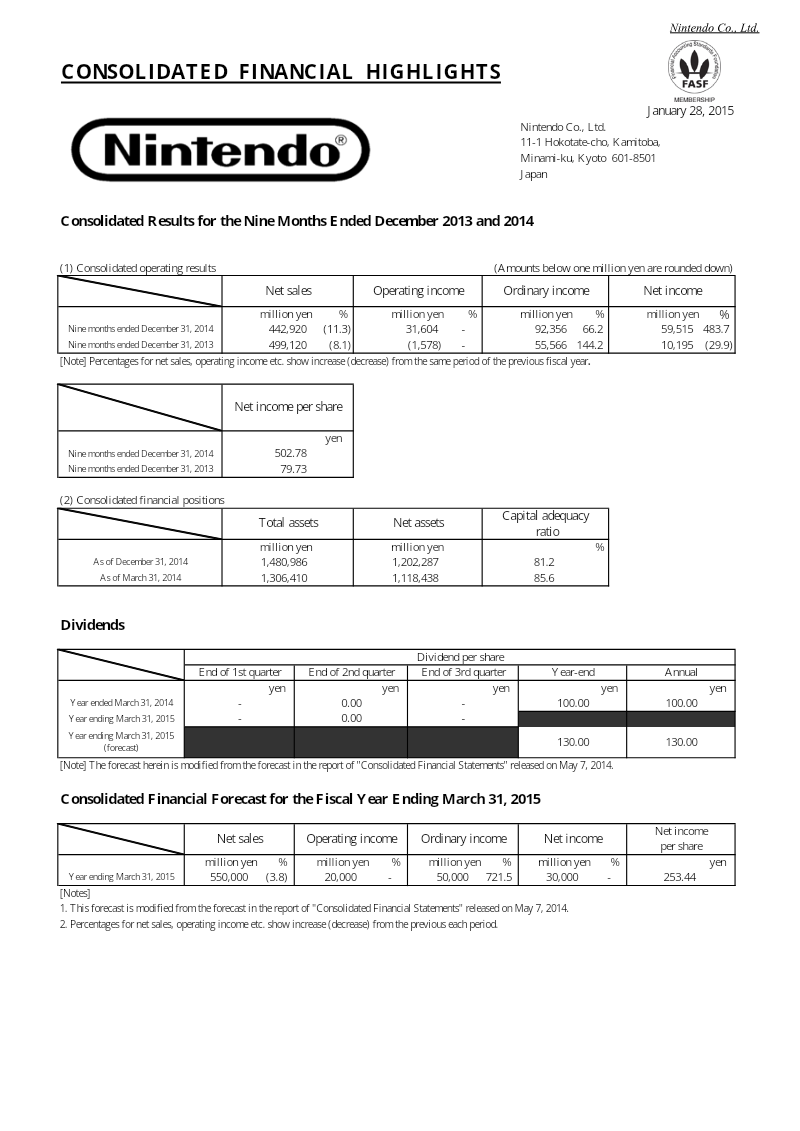
Consolidated Results for the Nine Months Ended December 2013 and 2014
Nintendo’s consolidated financial results for the nine-month period ending December 31, 2014, reflect a transition in hardware performance and a significant boost in profitability driven by favorable currency fluctuations.
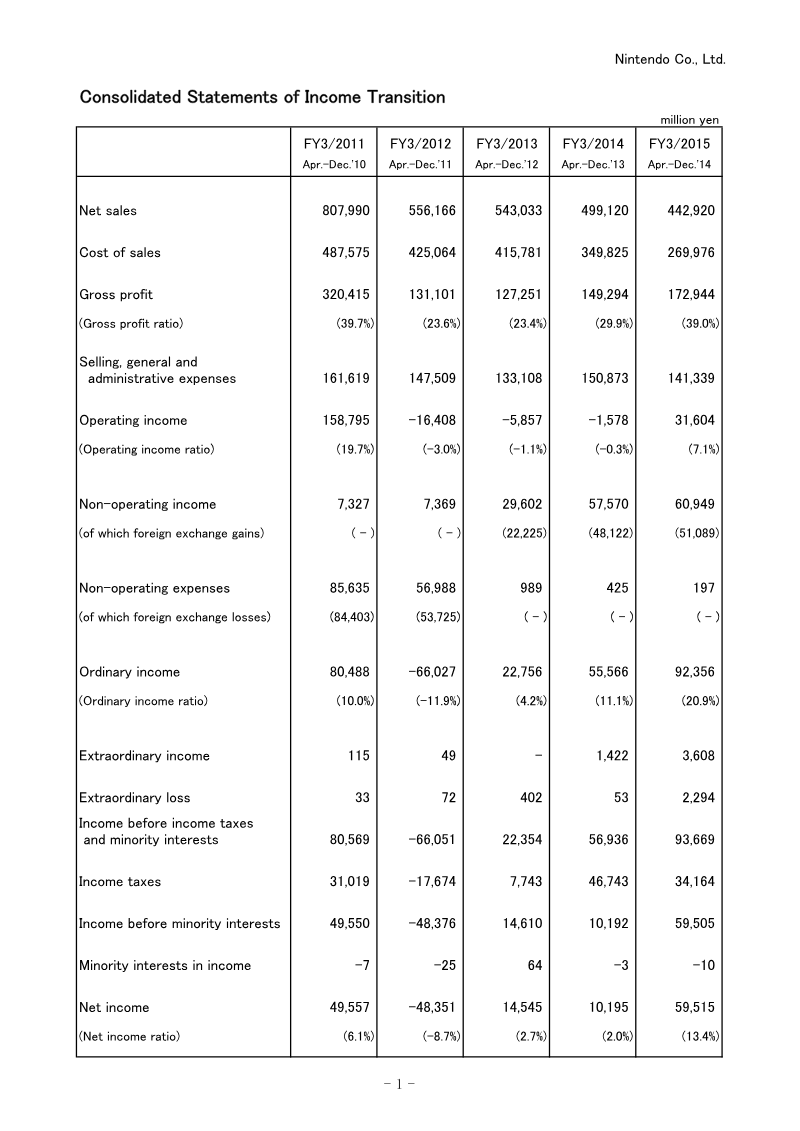
- Nintendo achieved a net income of 59.5 billion yen for the nine months ending December 2014, significantly bolstered by 51.0 billion yen in foreign exchange gains.
- Operating income recovered to 31.6 billion yen, a turnaround from the 1.6 billion yen operating loss recorded during the same period in 2013.
- Net sales declined by 11.3% year-over-year to 442.9 billion yen, with 73.0% of total revenue generated from overseas markets.
Earnings Release for the Nine-Month Period Ended December 2014: Supplementary Information
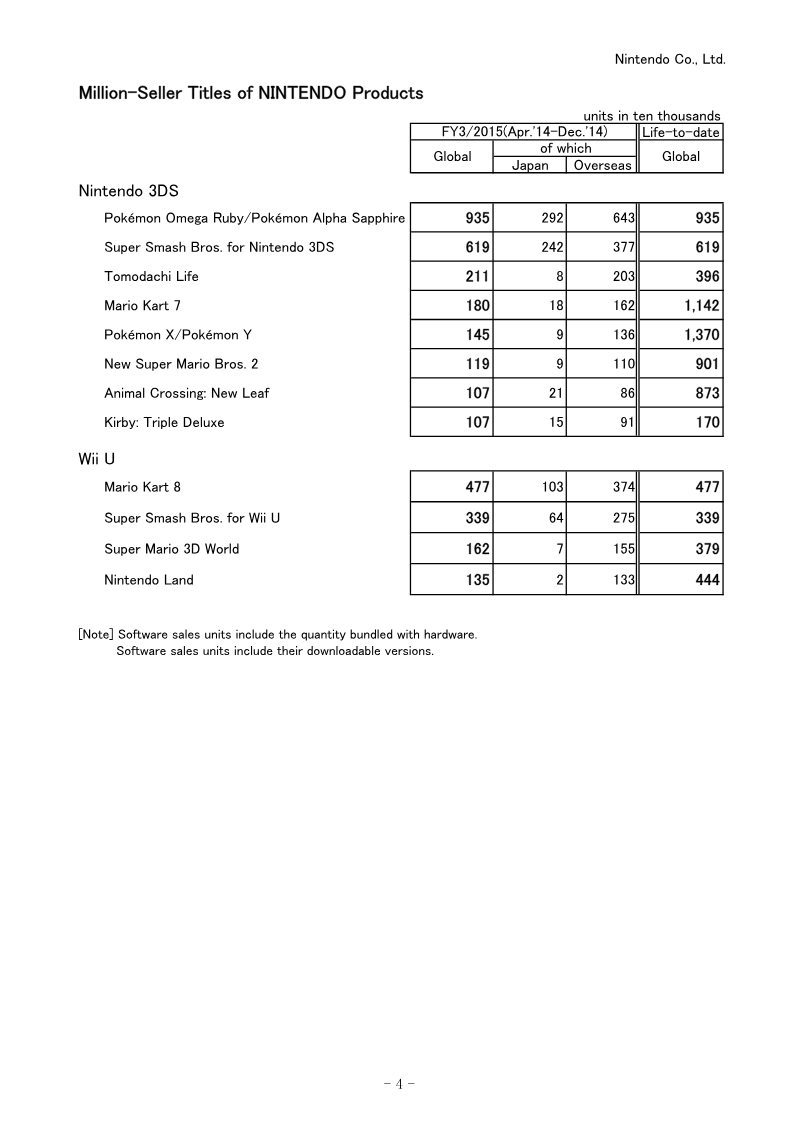
This supplementary information provides a detailed financial and operational overview of Nintendo Co., Ltd. for the nine-month period ending December 31, 2014.
- Nintendo's net sales for the nine months ended December 31, 2014 were 442.9 billion yen, with operating income of 31.6 billion yen, a return to operating profit from the prior year's operating loss.
- Net income rose to 59.5 billion yen, a 13.4% net income ratio, but substantial non-operating income, including 51.1 billion yen in foreign exchange gains, contributed heavily to this result.
- The gross profit margin was 39.0%, supporting the operating recovery alongside the reported income growth.
Microsoft Form 10-Q: Q2 FY2015
Microsoft’s financial performance for the second quarter of fiscal year 2015 reflects a pivotal transition toward a mobile-first, cloud-first strategy.
- Microsoft acquired Nokia’s Devices and Services business on April 25, 2014, for a total purchase price of $9.4 billion, consisting of $7.1 billion in cash and $2.1 billion in non-cash convertible note repurchases.
- As of December 31, 2014, Microsoft held $90.2 billion in cash, cash equivalents, and short-term investments, an increase from $85.7 billion at the end of the previous fiscal year on June 30, 2014.
- Commercial Cloud and server products drove a 7% revenue increase in the Commercial segment for the six months ended December 31, 2014, with server products revenue growing 11% during that period.