2015
Company
Documents about 2015

Marvelous First Half Results Briefing Materials: Fiscal Year Ending March 31, 2016
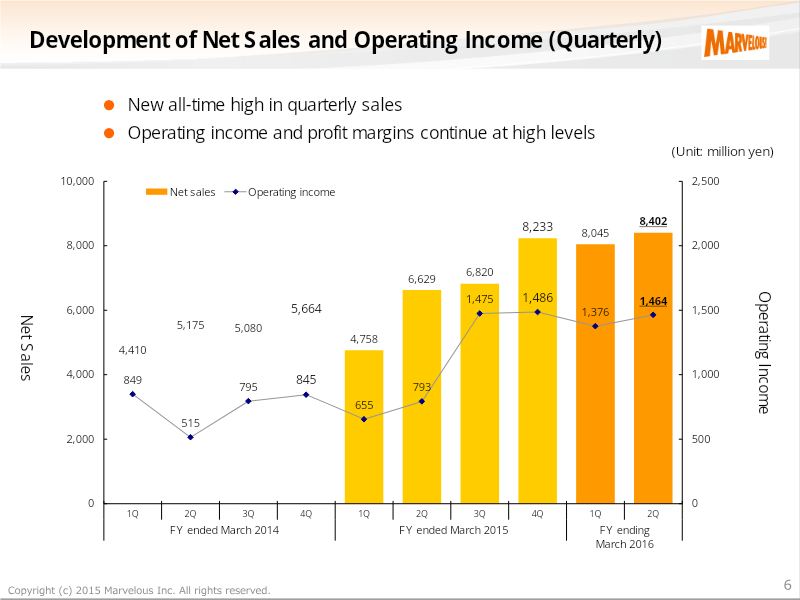
Marvelous Inc. reported strong financial growth for the first half of the fiscal year ending March 31, 2016, characterized by significant year-over-year increases in both net sales and operating income.
- Marvelous Inc. reported strong H1 FY2016 growth, with net sales reaching 16.4 billion yen (up 144.4% YoY) and operating income hitting 2.8 billion yen (up 196.0% YoY).
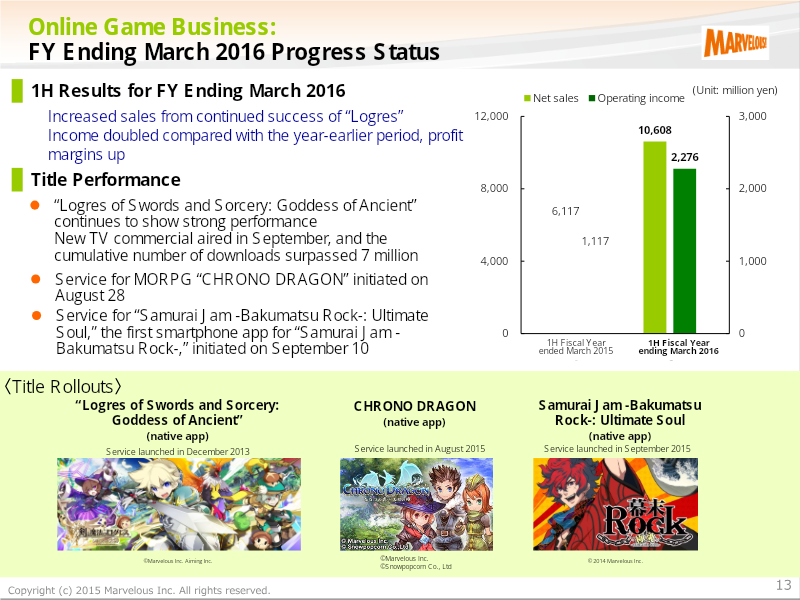
- The Online Game segment served as the primary growth driver, fueled by the success of 'Logres of Swords and Sorcery,' which surpassed 7 million cumulative downloads.
- The company maintains an optimistic full-year forecast of 35 billion yen in net sales and 6 billion yen in operating income.
Ubisoft Entertainment: Financial Half-Year Report 2015-16
Ubisoft’s financial performance for the first half of the 2015-16 fiscal year reflects a period of transition characterized by a significant revenue contraction.
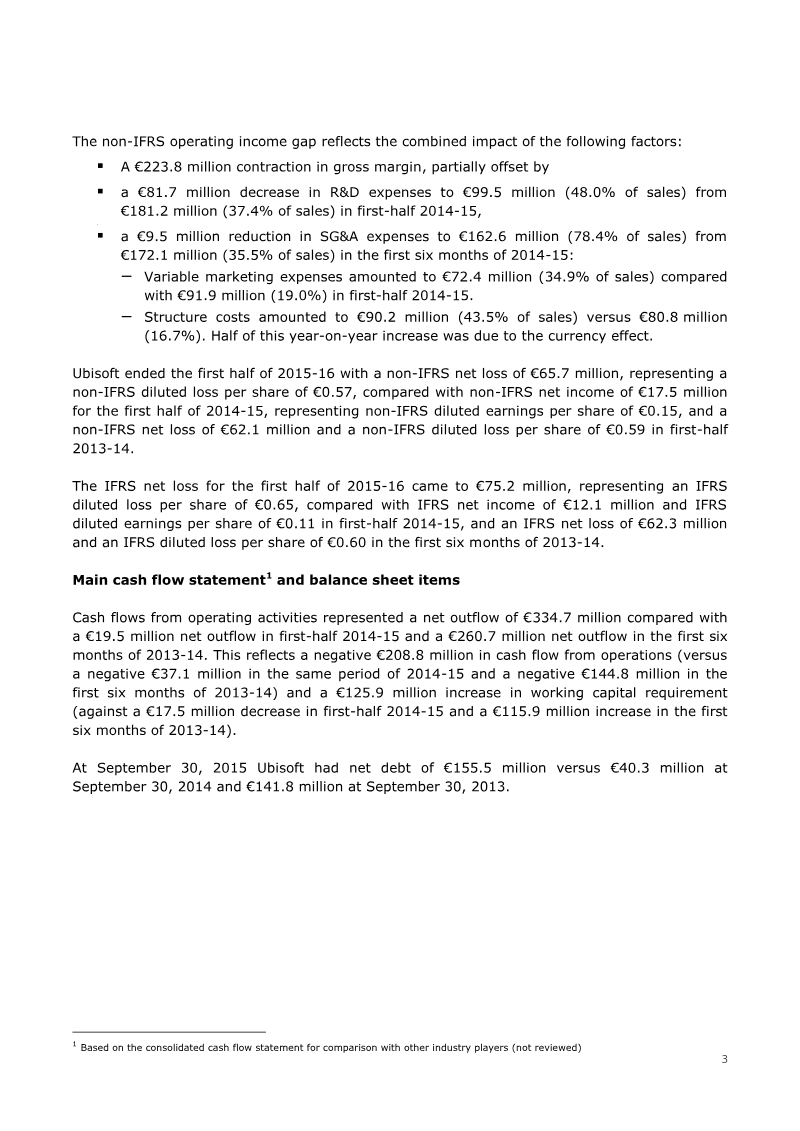
- Ubisoft's revenue fell 57.2% year-on-year to €207.3 million in the first half of 2015-16, largely because no blockbuster release matched the prior year's Watch Dogs launch.
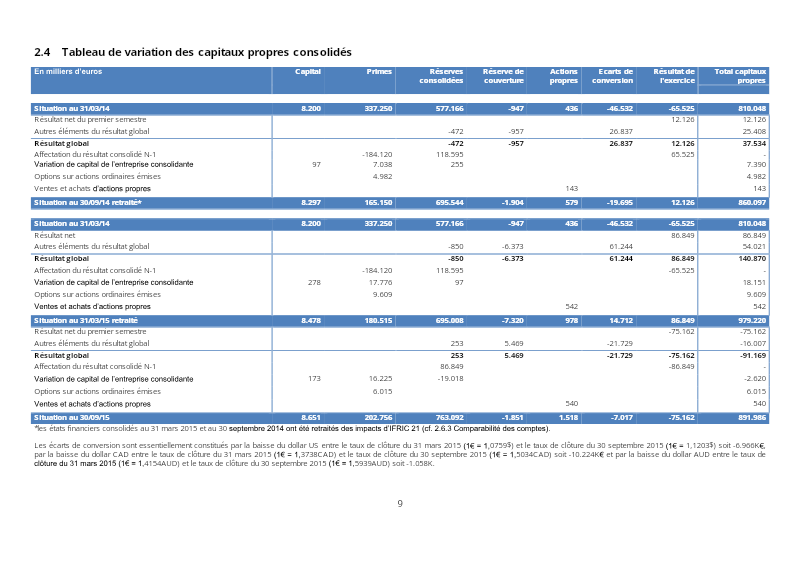
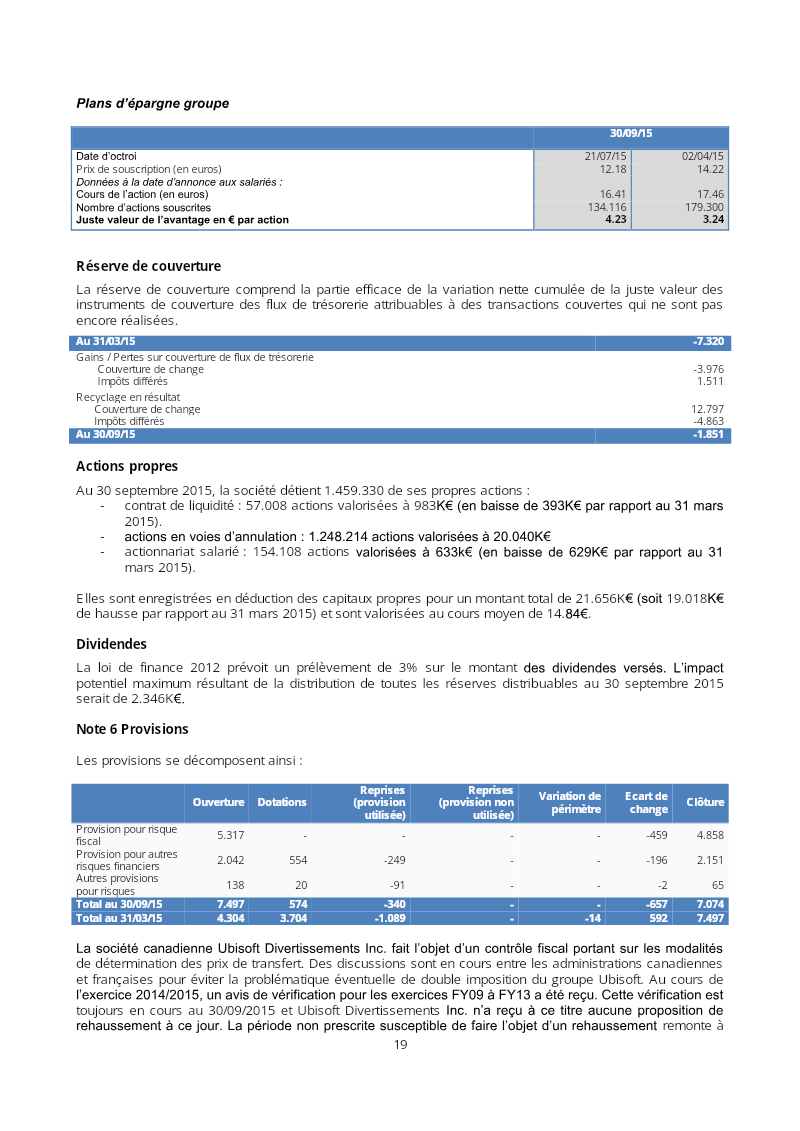
- The downturn produced a net loss of €75.2 million and a negative operating result of €113.9 million, worsened by higher operating expenses and ongoing tax audits across multiple jurisdictions.
- Back-catalogue sales rose 53.1%, and digital distribution now accounts for 48.3% of total turnover, signalling a strategic shift toward digital channels.

KLab Q3 2015 Financial Results
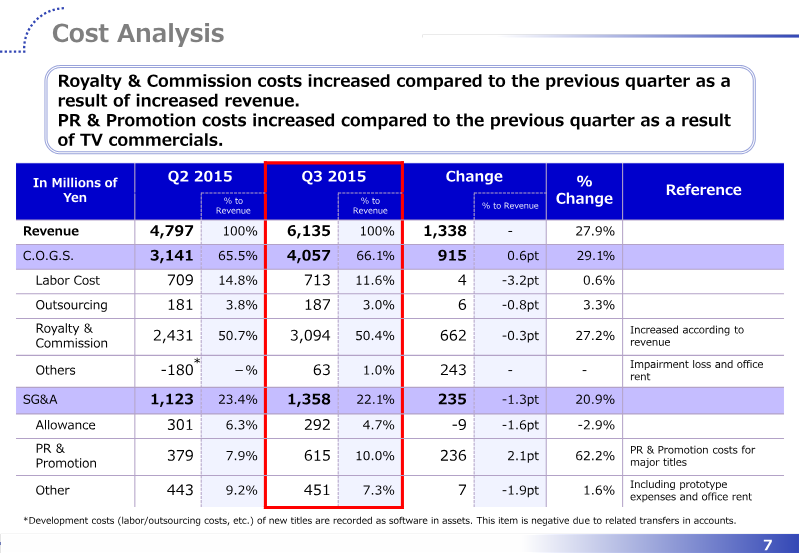
KLab’s financial results for the third quarter of 2015 reflect a period of growth compared to the previous quarter, though performance fell short of internal guidance.
- KLab reported Q3 2015 revenue of 6,135 million yen and an operating profit of 720 million yen, representing sequential growth of 27.9% and 35.3% respectively.
- Despite quarterly growth, the company missed its internal revenue guidance by 5.6% and its operating profit target by 28.0%, with ordinary income falling 15% due to foreign exchange losses.
- The company issued conservative Q4 guidance of 5,000 million yen in revenue and zero operating profit, citing anticipated declines in core titles and 600 million yen in planned promotional spending.
Turtle Beach Form 10-Q: Q3 2015
Turtle Beach faced a period of severe financial instability during the third quarter of 2015, characterized by significant net losses and persistent liquidity challenges.
- As of September 30, 2015, Turtle Beach held $55.35 million in total outstanding debt, consisting of revolving credit, term loans, and subordinated notes.
- Gross profit margin for the first nine months of 2015 declined to 20.6%, down from 26.5% in the same period of 2014, due to promotional credits, refurbishment costs, and legacy licensing royalties.
- The company is diversifying its business model by expanding into the hearing healthcare market with the upcoming launch of its HyperSound Clear technology.
Digital Turbine Quarterly Report: Q2 FY2016
Digital Turbine experienced a period of aggressive expansion during the first half of fiscal year 2016, characterized by a 257.8 percent surge in net revenue to $39.4 million.
- Digital Turbine reported a net loss of $8.3 million for the quarter ended September 30, 2015, compared to a $5.2 million loss in the same period of 2014, bringing the six-month net loss to $16.4 million.
- Consolidated net revenues grew significantly to $39.4 million for the six months ended September 30, 2015, up from $11.0 million in the prior year period.
- Advertising revenue saw massive growth, reaching $25.3 million for the six months ended September 30, 2015, compared to $1.1 million in the same period of 2014.
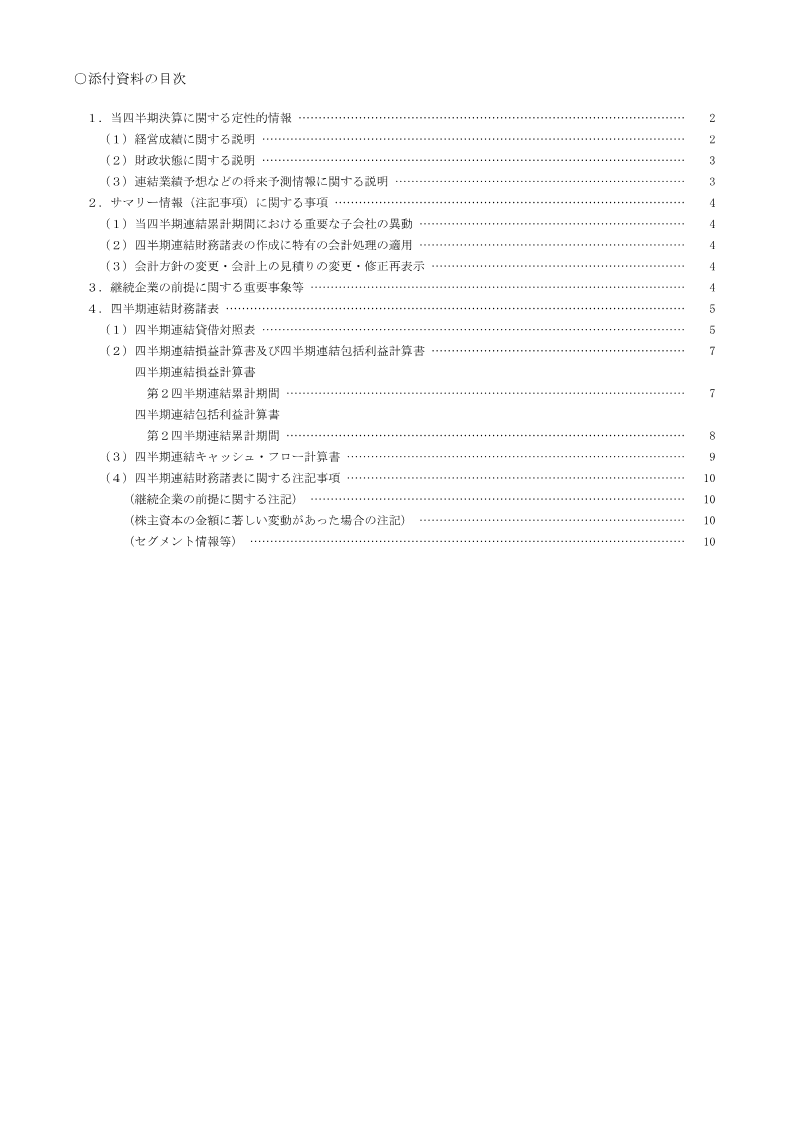
Nippon Ichi Software Q2 2016 Financial Results
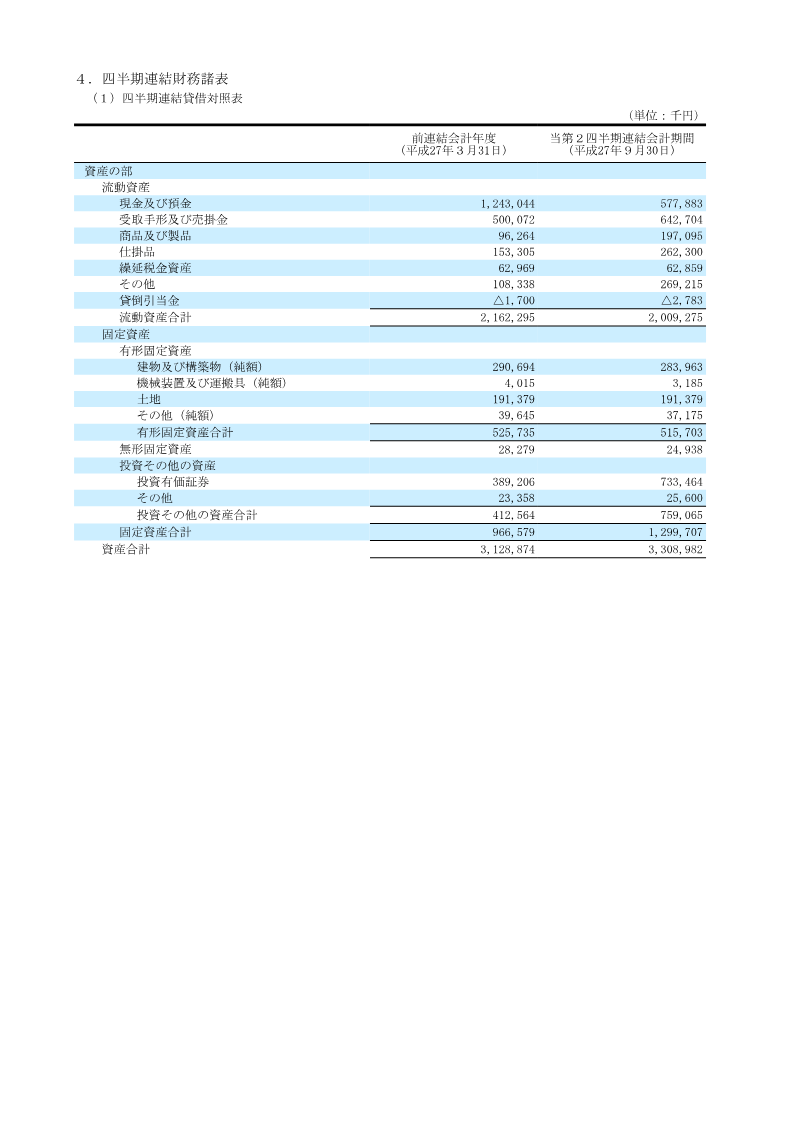
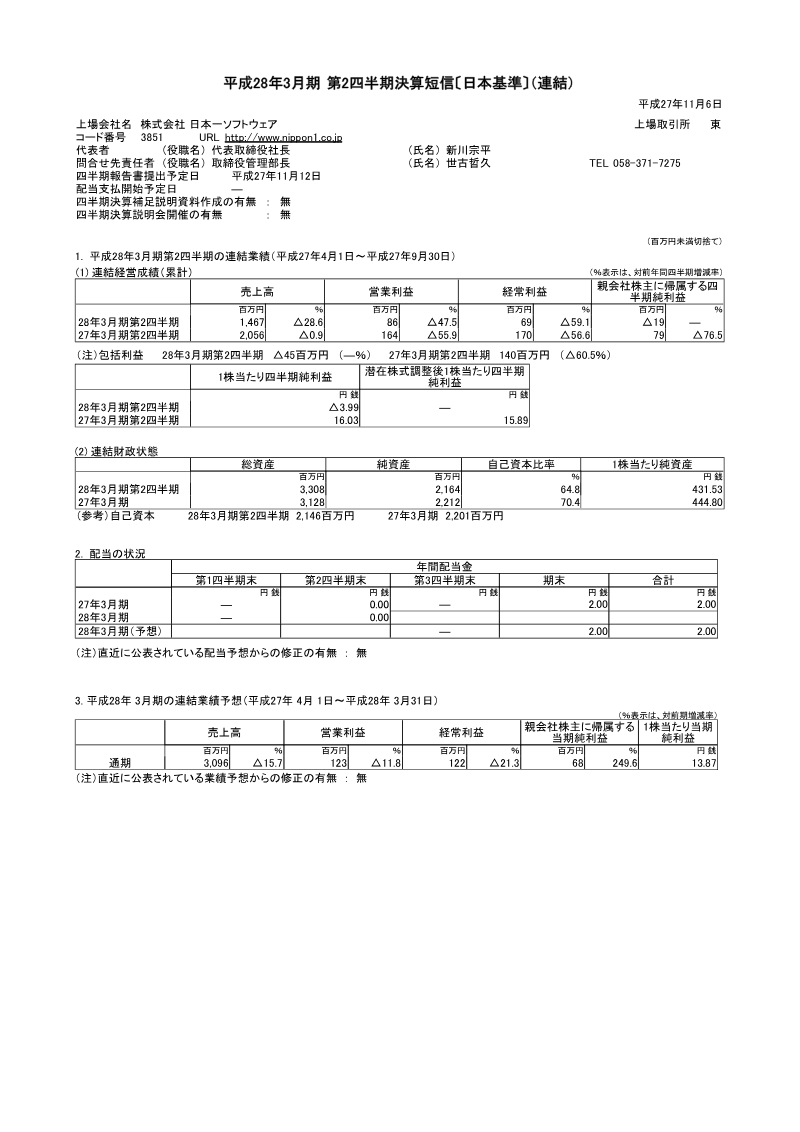
Nippon Ichi Software’s financial results for the second quarter of the fiscal year ending March 2016 reflect a period of contraction across key performance metrics.
- Nippon Ichi Software reported a net loss of 19 million yen for the six-month period ending September 30, 2015, a sharp decline from the 79 million yen profit recorded in the same period the previous year.
- Net sales fell 28.6% year-over-year to 1.467 billion yen, while operating profit dropped 47.5% to 86 million yen.
- The Package segment, which released nine titles, generated 979 million yen in sales, while the Online segment remained the most profitable division with 185 million yen in operating profit.
Square Enix Holdings Financial Results: Six-Month Period Ended September 30, 2015
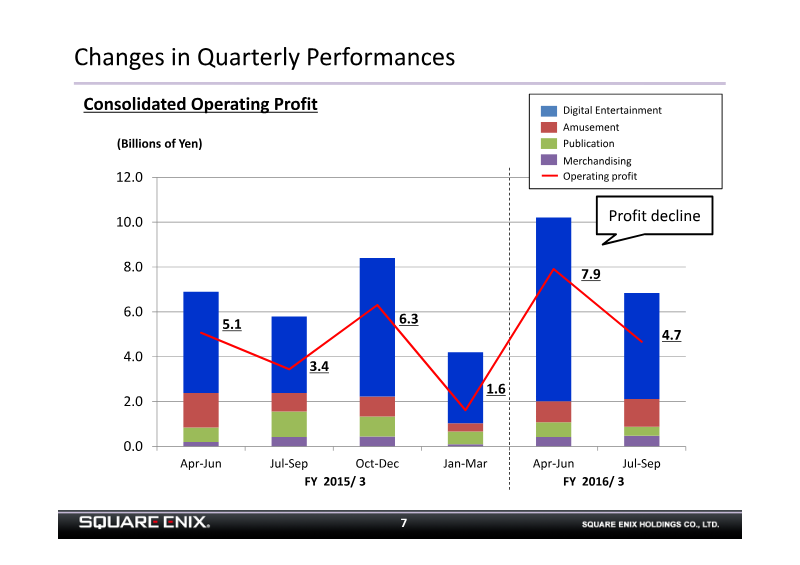
Square Enix Holdings reported strong financial growth for the six-month period ending September 30, 2015, driven primarily by the performance of its Digital Entertainment segment.
- Square Enix reported consolidated net sales of 86.4 billion yen and an operating income of 12.6 billion yen for the six-month period ended September 30, 2015, representing a year-over-year increase of 13.2 billion yen in sales and 4.1 billion yen in operating income.
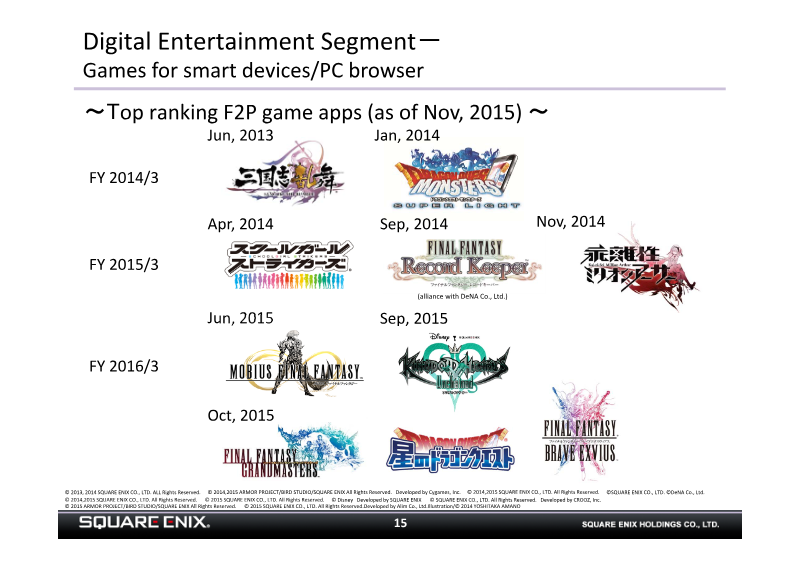
- The Digital Entertainment segment remains the primary revenue driver, contributing 60.2 billion yen in net sales and 12.9 billion yen in operating income, with an operating margin of 21.5%.
- Quarter-over-quarter operating profit declined due to a reactionary drop in MMO expansion disc sales, losses on the evaluation of smart device and PC browser game content, and increased advertising expenses for HD games.
Take-Two Interactive Form 10-Q: Q2 FY2016
Take-Two Interactive’s financial performance for the second quarter of fiscal year 2016 reflects a period of robust growth driven by the continued dominance of the Grand Theft Auto franchise and a strategic pivot toward digital distribution.
- Recurrent consumer spending—comprising add-on content, microtransactions, and online play—grew to 66.4% of digital online revenue for the quarter ended September 30, 2015, up from 54.3% in the same period the previous year.
- Digital online channels accounted for 58.3% of total net revenue for the quarter ended September 30, 2015, a decrease from 63.9% in the prior year due to the recognition of previously deferred revenue from physical console versions of Grand Theft Auto V.
- Gross profit margin for the six months ended September 30, 2015, declined to 44.3% from 57.8% in the prior year, primarily driven by higher internal royalties associated with the performance of the Grand Theft Auto franchise.

Mixi FY2015 Second-Quarter Earnings Result Briefing Session
Mixi, Inc. reported strong financial performance for the second quarter of fiscal year 2015, covering the period from July 1 to September 30, 2015.
- Mixi reported strong H1 FY2015 results with net sales of 95.35 billion yen and operating income of 43.67 billion yen, representing year-on-year growth of 172.8% and 204.4%, respectively.
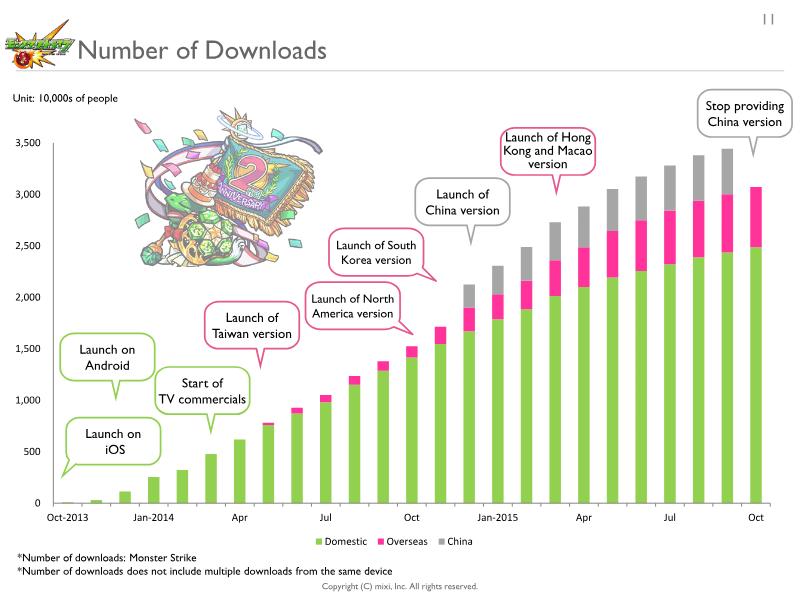
- The entertainment segment, driven primarily by the mobile game Monster Strike, generated 89.03 billion yen in net sales and remains the company's dominant revenue and profit source.
- Growth in the paying user base was bolstered by high engagement and the introduction of beginner packs within Monster Strike.
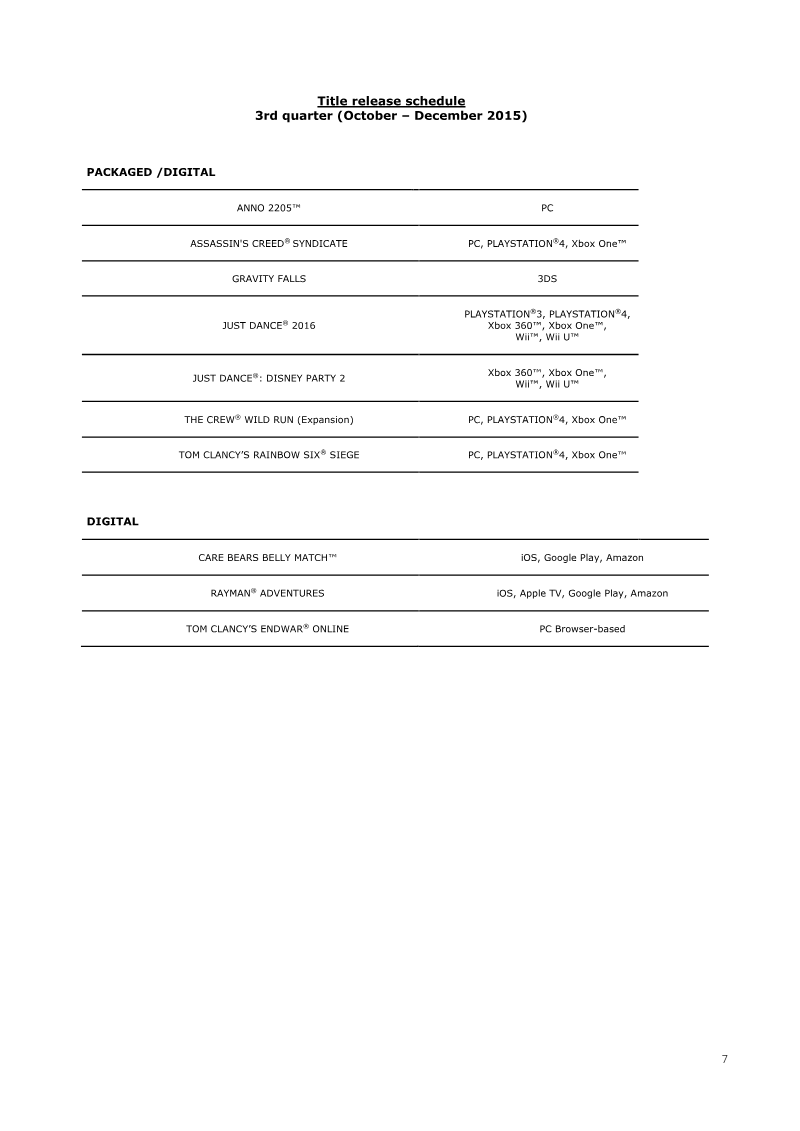
Ubisoft Reports First-Half 2015-16 Sales and Earnings Figures
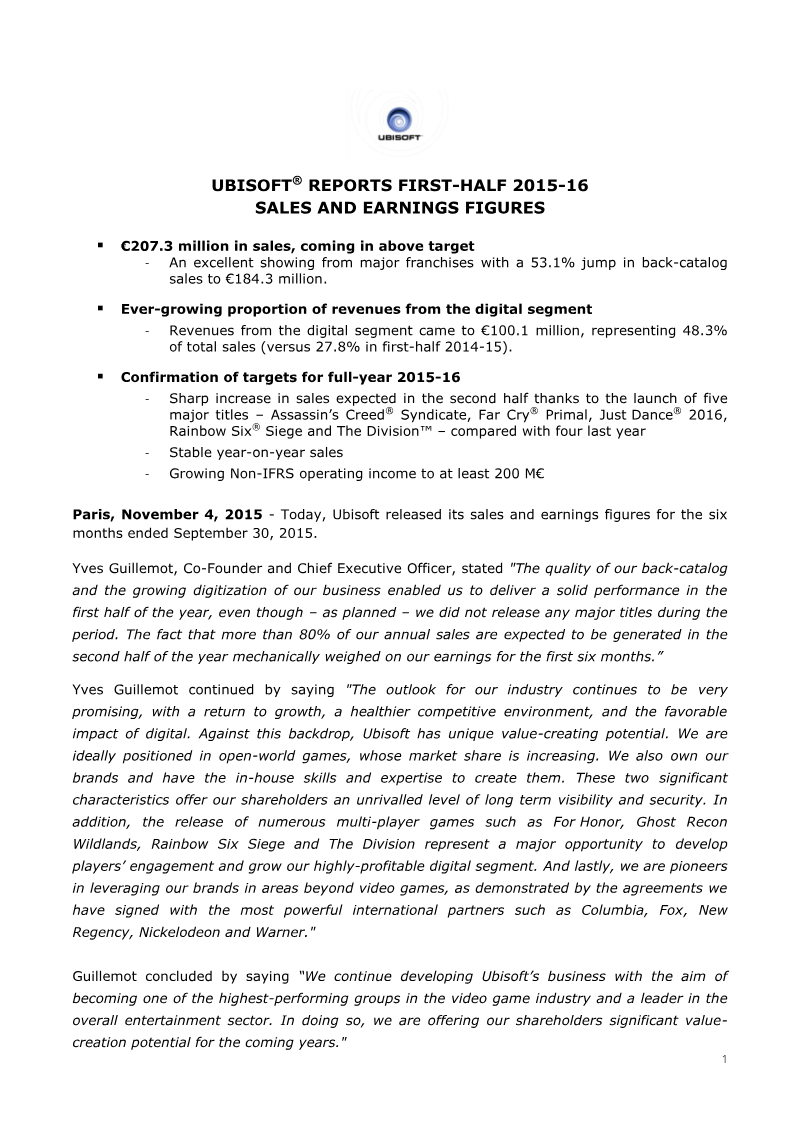
Ubisoft’s financial results for the first half of the 2015-16 fiscal year, ending September 30, 2015, demonstrate a period of planned transition characterized by a lack of major title releases.
- Ubisoft reported H1 2015-16 sales of €207.3 million, a 57.2% decline year-over-year due to a lack of major title releases in the period.
- Digital sales grew significantly to account for 48.3% of total revenue, up from 27.8% in the same period the previous year.
- Back-catalog sales increased by 53.1% to €184.3 million, driven by the sustained performance of franchises like Assassin’s Creed, Far Cry, and Just Dance.


Summary of Financial Results for Third Quarter of Fiscal Year Ending December 31, 2015 (Japanese GAAP) (Consolidated)
KLab Inc. reported consolidated financial results for the first nine months of the fiscal year ending December 31, 2015, demonstrating steady revenue growth and improved operating efficiency despite a decline in net income.
- KLab Inc. reported a 4.0% year-over-year revenue increase to 16.57 billion yen for the first nine months of 2015, driven almost entirely by its game business segment.
- Operating income grew by 20.1% to 2.27 billion yen, though net income declined 27.6% to 934 million yen due to foreign exchange losses and higher income taxes.
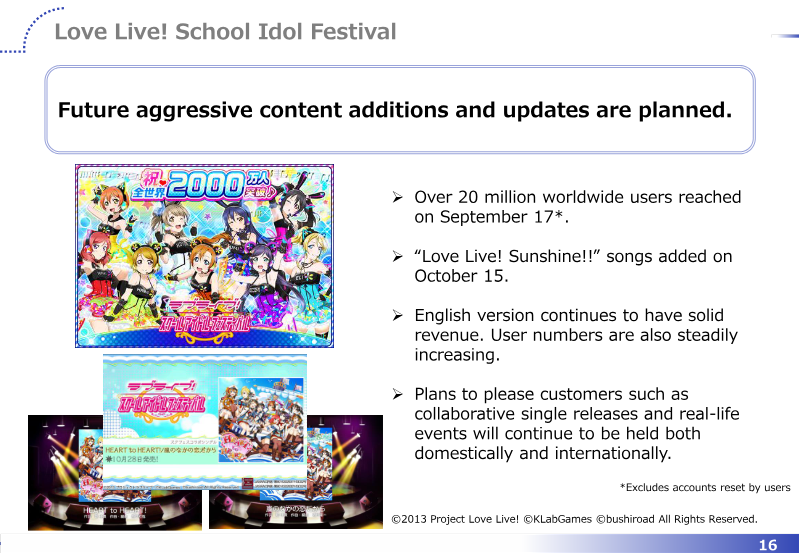
- The company's financial performance was anchored by the sustained popularity of 'Love Live! School Idol Festival' and the successful July 2015 launch of 'BLEACH Brave Souls,' which reached the top ten in App Store sales.


Consolidated Financial Results for the Six Months Ended September 30, 2015
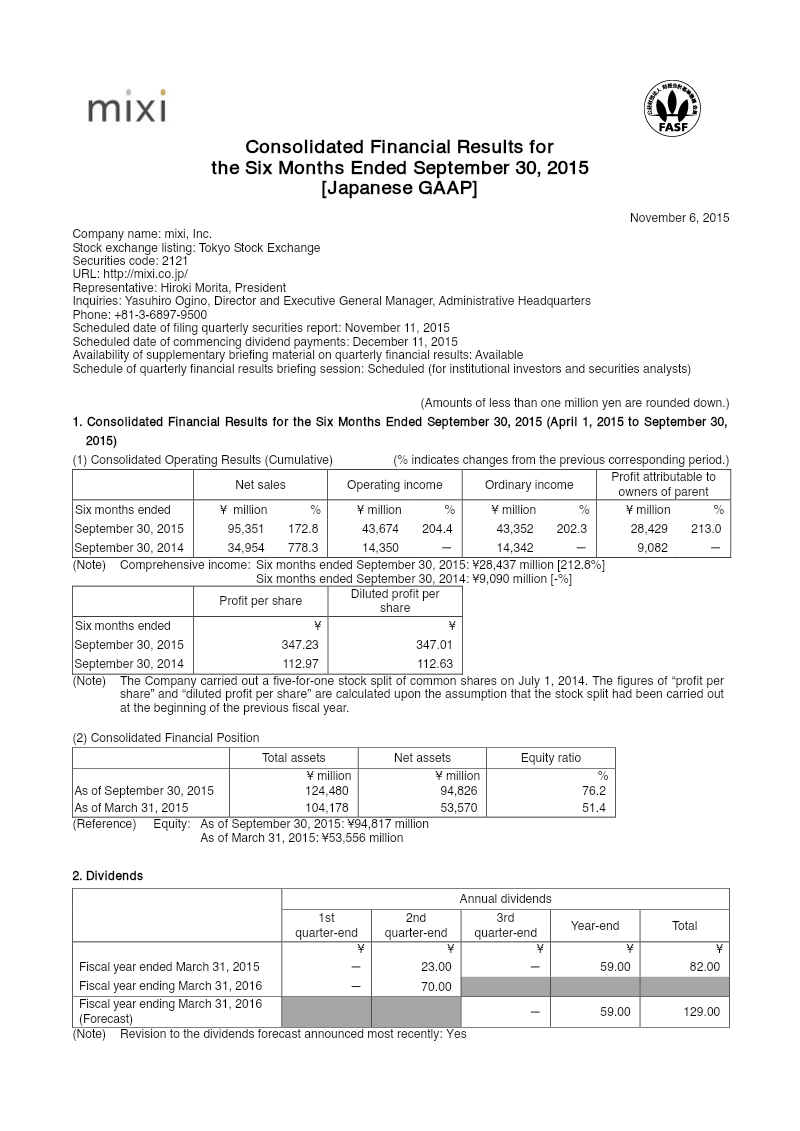
Mixi, Inc. reported significant growth in its consolidated financial results for the six months ended September 30, 2015.
- Mixi, Inc. experienced massive growth for the six months ending September 30, 2015, with net sales rising 172.8% to ¥95,351 million and operating income increasing 204.4% to ¥43,674 million.
- The Entertainment Business segment, anchored by the title Monster Strike, served as the primary revenue driver, accounting for ¥89,027 million of total net sales.
- Profit attributable to owners of the parent surged 213% to ¥28,429 million, supported by a strong financial position that saw total assets grow to ¥124,480 million and an equity ratio of 76.2%.