Market Analysis
Documents
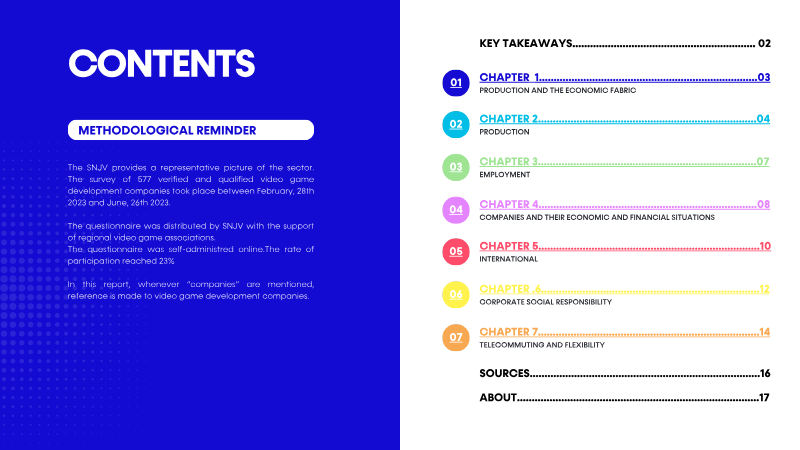
Annual Survey of Video Games in France 2022
The 2023 annual survey of the French video game industry provides a comprehensive analysis of the sector’s economic health, production trends, and workforce dynamics during 2022. Conducted by the Syndicat National du Jeu Vidéo (SNJV) between February and June 2023, the study relies on a self-administered online questionnaire sent to 577 qualified development companies, achieving a 23% participation rate. The scope covers approximately 1,000 companies across France, including 580 development studios, with a significant concentration of 44.6% located in the Île-de-France region.
Findings indicate a robust but maturing production landscape, with nearly 1,260 games in development and over 850 new intellectual properties created. While the number of games in production fell by 7% compared to 2020, the industry saw a rise in professionalization, with 62% of studios working with publishers. Financial growth is evident, as 27% of studios now generate over 1 million euros in revenue, a 9-point increase from 2020. However, the sector remains dominated by smaller entities, with 55% of companies earning less than 300,000 euros annually. Despite this growth, optimism has tempered; only 28.6% of respondents expect revenue growth in the coming year, compared to 66% in 2020.
Employment remains stable with 76% of staff on permanent contracts, though gender diversity shows slow progress, with women making up 24% of the workforce. The industry is also navigating structural shifts in work culture, as 33% of companies have adopted full-time remote work. Corporate Social Responsibility is emerging as a priority, with 65.5% of companies implementing gender equality actions and nearly half planning carbon footprint assessments. France remains highly attractive to 85% of studios, primarily due to tax incentives and the quality of specialized training.
- The French video game industry is maturing financially, with 27% of studios generating over 1 million euros in revenue, a 9-point increase since 2020.
- Despite revenue gains, industry optimism has declined significantly, with only 28.6% of studios expecting growth compared to 66% in 2020.
- The production landscape remains highly concentrated in the Île-de-France region, which hosts 44.6% of the nation's development studios.
- While the industry is professionalizing—evidenced by 62% of studios working with publishers—the total volume of games in development fell by 7% compared to 2020.
- The sector is dominated by small-scale operations, as 55% of companies continue to generate less than 300,000 euros in annual revenue.
Game Developer Index: Sweden 2022
The Swedish games industry underwent a period of rapid expansion in 2021, characterized by a 22% increase in domestic revenue to €2.7 billion and a 43% surge in global revenue to €5.8 billion. This growth was fueled by a record-breaking year of international acquisitions, with 81 public transactions led by major groups such as Embracer and Stillfront. By late 2022, Swedish-owned entities operated 197 studios across 49 countries, employing approximately 28,000 people worldwide. This international footprint is reflected in consumer reach, as an estimated one in four players globally has engaged with a Swedish-developed title, and Swedish-associated games accounted for 6% of all Twitch watchtime in 2021.
The domestic workforce grew by 17% to nearly 8,000 employees, with women representing 22.1% of the total staff and 26% of new hires. While gender diversity is improving—evidenced by 29 companies achieving at least 50% female representation—the industry continues to struggle with a severe domestic skills shortage. This talent gap has forced Swedish firms to expand their foreign subsidiaries aggressively, with over 11,000 staff members now based abroad. Although regional hubs in Stockholm and Skåne remain dominant, growth is increasingly supported by specialized educational clusters and post-secondary programs designed to cultivate local talent.
Despite its commercial success and cultural influence, the sector faces structural hurdles that could impact future scalability. Critical challenges include complex work permit processes for international recruits and a lack of early-stage financing compared to other global markets. Methodological shifts in industry tracking now prioritize national group turnover to ensure better comparability with other sectors, revealing a robust ecosystem of 785 active companies. While the industry remains a powerhouse of the Swedish economy, its long-term sustainability depends on addressing recruitment barriers and maintaining the momentum of its global acquisition strategy.
- The Swedish games industry experienced significant financial growth in 2021, with domestic revenue rising 22% to €2.7 billion and global revenue surging 43% to €5.8 billion.
- Driven by 81 international acquisitions led by groups like Embracer and Stillfront, Swedish-owned entities now operate 197 studios across 49 countries, employing approximately 28,000 people globally.
- Swedish-developed titles maintain a massive international reach, with an estimated one in four global players engaging with these games and Swedish-associated content accounting for 6% of all Twitch watchtime in 2021.
- The domestic workforce grew by 17% to nearly 8,000 employees, though the industry faces a severe skills shortage that has forced firms to employ over 11,000 staff members through foreign subsidiaries.
- Gender diversity is gradually improving, with women representing 22.1% of the total workforce and 26% of new hires, while 29 companies have achieved at least 50% female representation.

Gaming in Europe: Key Facts 2022
The European video game industry demonstrated significant economic resilience and social expansion in 2022, generating €24.5 billion in revenue and achieving a 5% year-on-year growth rate. This sector now engages approximately 126.5 million people, representing 53% of the population aged 6 to 64. Demographic shifts indicate a maturing and diversifying market, as women now comprise nearly 47% of the player base and the 45-64 age group has emerged as the largest playing demographic. While engagement has stabilized at an average of 8.8 hours of weekly playtime, the industry’s economic footprint is bolstered by a workforce of over 110,000 employees, which saw a 12% increase in staffing levels.
Despite this robust growth, the industry faces a critical talent shortage that threatens future expansion. Projections suggest a widening digital skills gap, exemplified by Sweden’s anticipated deficit of 25,000 developers by 2031. To sustain its trajectory, the sector is increasingly focusing on workforce diversity—where women currently hold 23.7% of roles—and the implementation of comprehensive social responsibility frameworks. These include the expansion of the PEGI rating system and the deployment of advanced parental control tools to ensure a safe environment for the evolving player base.
Environmental sustainability has also become a central pillar of the European gaming landscape. Through collaborative efforts like the Games Consoles Voluntary Agreement, the industry achieved a reduction of 54TWh in energy consumption across previous console generations. Major publishers and trade associations across 18 countries are now prioritizing carbon neutrality, with sector-wide initiatives successfully offsetting significant carbon footprints. These combined economic, social, and environmental strategies reflect a maturing industry that is balancing rapid commercial growth with long-term ecological and demographic responsibilities.
- The European gaming industry generated €24.5 billion in revenue in 2022, marking a 5% year-on-year growth rate and supporting a workforce of over 110,000 employees.
- The player base has reached 126.5 million people, with the 45-64 age group now representing the largest demographic and women accounting for 47% of all players.
- A critical talent shortage threatens future expansion, highlighted by a projected deficit of 25,000 developers in Sweden alone by 2031.
- Industry staffing levels grew by 12% in 2022, though women remain underrepresented in the workforce, currently holding only 23.7% of roles.
- Environmental initiatives, such as the Games Consoles Voluntary Agreement, have successfully reduced energy consumption by 54TWh across previous console generations.
Brazil Games Industry Report 2022
Brazil has established itself as the preeminent games market in Latin America and the 12th largest globally, generating approximately USD 2.3 billion in 2021. The ecosystem is defined by rapid professionalization and internationalization, evidenced by a 102% increase in active studios since 2018. With over 1,000 companies and a workforce exceeding 12,000 professionals, the industry has transitioned from a historical period of informality to a sophisticated hub for original intellectual property and high-quality external development services. While the Southeast and South regions remain the primary geographic hubs, the sector’s reach is global, with over half of local companies serving international markets, particularly in the United States and Europe.
The industry demonstrates increasing maturity through longer studio lifespans and a shift toward diverse platforms. While mobile and PC development remain dominant, console production grew significantly to 17% of the market by 2021. Beyond entertainment, Brazilian studios maintain a strong presence in educational and corporate gamification. Despite this growth, structural challenges persist, including a lack of formal inclusion policies for underrepresented groups and a "wage war" for senior talent driven by the rise of remote work for foreign firms. Furthermore, the workforce is navigating a transition where 93% of companies now focus on proprietary IP, moving away from a pure service-provider model.
Economic and regulatory hurdles continue to shape the landscape. Federal funding has reached historic lows, forcing a reliance on founder capital and state-level initiatives. Developers face significant "legal insecurity" due to the absence of a specific regulatory category for games and a tax system that treats development hardware as luxury entertainment rather than capital goods. Nevertheless, the resilience of the sector is underscored by a 336% revenue increase in USD since 2015 and the emergence of "unicorns" like Wildlife. The industry remains a vital component of the global value chain, increasingly recognized for its technical proficiency in engines like Unity and its expanding role in emerging technologies such as blockchain and the metaverse.
- Brazil is the 12th largest games market globally and the leader in Latin America, generating approximately USD 2.3 billion in 2021.
- The industry has experienced rapid expansion, with a 102% increase in active studios since 2018 and a 336% revenue increase in USD since 2015.
- The sector is shifting toward original intellectual property, with 93% of companies now focusing on proprietary IP rather than a pure service-provider model.
- The ecosystem comprises over 1,000 companies and 12,000 professionals, with more than half of these businesses exporting services to international markets, primarily in the U.S. and Europe.
- Console production has grown to represent 17% of the market, diversifying a landscape previously dominated by mobile and PC development.
State of Anime Gaming 2022
The analysis evaluates the global mobile market for games that employ an anime art style, focusing on performance metrics from 2018 through 2021. By applying data.ai’s Game IQ feature‑tag system to isolate titles with anime aesthetics across all genres, the study aggregates download and consumer‑spend data from iOS and Google Play (iOS‑only for China) and presents a comprehensive view of audience behavior, revenue trends, and regional dynamics.
Anime‑themed titles generated one‑fifth of all mobile‑game spend in 2021 while capturing only about one percent of overall usage, highlighting a highly engaged but niche user base. Worldwide downloads rose 15 % year‑over‑year in 2021 and 50 % since 2018, with South Korea leading growth (170 % increase in downloads, 85 % rise in spend), followed by the United Kingdom (30 % downloads, 75 % spend) and the United States (40 % downloads, 70 % spend). Japan remained the largest market, accounting for 55 % of anime‑game spend in 2021, though its share fell by nine percentage points from 2018. RPG, simulation and action subgenres dominate both downloads and revenue, while breakout titles such as Genshin Impact (top global spender) and Pokémon GO (top downloader in the US and UK) illustrate cross‑regional appeal.
Demographic profiling shows a strong Gen‑Z skew, with anime gamers on U.S. iPhones 217 % more likely to use Discord and 52 % more likely to use Snapchat than the average mobile gamer; similar patterns appear in Japan and other markets. Gender preferences vary by subgenre, and certain genres—particularly idol‑training simulations and open‑world RPGs—recorded double‑digit year‑over‑year revenue growth (e.g., Uma Musume Pretty Derby +117 %, Genshin Impact +233
- Anime-themed mobile games generated 20% of total global mobile game consumer spend in 2021 despite accounting for only 1% of total usage.
- Japan remains the dominant market, representing 55% of global anime-game spend in 2021, though its market share has declined by nine percentage points since 2018.
- Global downloads for anime-style games grew 50% between 2018 and 2021, with South Korea emerging as a top growth market showing a 170% increase in downloads and 85% increase in spend.
- RPG, simulation, and action subgenres drive the majority of revenue and downloads, with high-performing titles like Genshin Impact and Pokémon GO demonstrating significant cross-regional appeal.
- Specific subgenres are seeing massive revenue acceleration, led by titles like Genshin Impact (+233% year-over-year) and Uma Musume Pretty Derby (+117% year-over-year).
Store Intelligence Data Digest: Q2 2022
The global mobile application market experienced a pivotal transition in the second quarter of 2022, characterized by a 2.5% year-over-year decline in total downloads to 35 billion. While Google Play maintained the largest volume with 27.2 billion installs, the most significant development occurred within the United States, where consumer spending on non-gaming applications surpassed gaming revenue on the App Store for the first time. This shift was fueled by a 40% compound annual growth rate in subscriptions, with non-game subscription revenue soaring 129% above 2019 levels. This trend underscores a fundamental change in consumer behavior as 400 non-game titles generated over $1 million in quarterly revenue, signaling a maturation of the subscription economy.
The gaming landscape remained highly competitive, led by the resurgence of Subway Surfers, which achieved its best performance since 2014 with over 80 million downloads. While Garena Free Fire continued its dominance on Google Play, particularly in Asia, the quarter was defined by the successful entry of mid-core titles like Apex Legends Mobile and Diablo Immortal. Regional growth was most pronounced in Indonesia, which surpassed 2 billion quarterly downloads for the first time, while the U.S. market saw a resurgence in travel and ticketing sectors as consumers returned to pre-pandemic activities.
Publisher dynamics remained concentrated among established giants, with Meta and Google maintaining their global leadership. Meta saw an 11% year-over-year increase in downloads, driven by its ownership of four of the top five most-installed apps worldwide. The industry also witnessed significant consolidation and strategic shifts, notably Take-Two Interactive’s rise to the top of the U.S. gaming market following its acquisition of Zynga, and Miniclip’s acquisition of the Subway Surfers franchise. These movements, combined with the rising influence of domestic publishers in China and the U.S., illustrate a market balancing global scale with localized dominance.
- In a historic shift for the U.S. App Store, consumer spending on non-gaming applications surpassed gaming revenue for the first time, driven by a 129% increase in non-game subscription revenue compared to 2019 levels.
- The global mobile market saw a 2.5% year-over-year decline in total downloads to 35 billion in Q2 2022, though Google Play retained the largest share with 27.2 billion installs.
- Meta solidified its market dominance by owning four of the top five most-installed apps globally, contributing to an 11% year-over-year increase in the company's total downloads.
- Take-Two Interactive became the top U.S. gaming publisher following its acquisition of Zynga, while Miniclip expanded its portfolio by acquiring the Subway Surfers franchise.
- Subway Surfers experienced a major resurgence, recording over 80 million downloads—its strongest performance since 2014—while new mid-core titles like Apex Legends Mobile and Diablo Immortal successfully entered the market.
Japan Mobile App Trends 2022
The Japanese mobile app market experienced a period of significant expansion between 2020 and 2022, characterized by a 19% surge in total installs and a dominant 52% growth rate within the gaming sector. While the pandemic-driven peak of 2021 led to a stabilization of gaming sessions in 2022, the market remains robust across multiple verticals. Hyper-casual and RPG titles continue to lead in volume, though simulation games have emerged as highly efficient options for developers, offering lower acquisition costs and superior return on ad spend compared to puzzle games.
Beyond gaming, the fintech and e-commerce sectors have demonstrated remarkable resilience and growth. Fintech sessions increased by 13% year-over-year in the first half of 2022, while e-commerce activity reached record highs during the same period. The dating app category also saw a 13% uptick in engagement, with notable discrepancies in user acquisition costs between platforms; Android registrations proved more cost-effective at $8.47 compared to $10.20 for iOS. These trends indicate a maturing digital economy where user engagement is diversifying across utility and lifestyle applications.
A pivotal shift in the Japanese advertising landscape is the rapid rise of Connected TV (CTV), which is projected to reach 23.2% user penetration and ¥58.8 billion in ad spend by 2024. This emerging frontier is reshaping user acquisition strategies, necessitating sophisticated cross-device measurement and multi-touch attribution to link large-screen impressions to mobile conversions. As local broadcasters and analytics platforms form deeper integrations, CTV is transitioning from an experimental channel to a permanent, data-driven fixture of the Japanese mobile marketing ecosystem.
- The Japanese mobile market saw a 19% surge in total installs between 2020 and 2022, with the gaming sector experiencing a dominant 52% growth rate.
- Connected TV (CTV) is a critical emerging channel in Japan, projected to reach 23.2% user penetration and ¥58.8 billion in ad spend by 2024.
- Simulation games have become highly efficient for developers, offering lower acquisition costs and superior return on ad spend compared to traditional puzzle games.
- Fintech sessions grew by 13% year-over-year in the first half of 2022, while e-commerce activity reached record highs during the same period.
- Dating app engagement increased by 13%, with Android user acquisition costs ($8.47) proving more cost-effective than iOS ($10.20).
State of Mobile 2022 – Indonesia
Indonesia emerged as one of the world’s most mobile-centric markets in 2021, with users averaging 5.4 hours daily on mobile devices, representing a 38% increase since 2019. This engagement translates to roughly one-third of total waking hours, fueling 7.31 billion new app downloads and $532 million in consumer spending. While social, communication, and video applications captured 70% of total time spent, the gaming sector remained the primary economic driver, accounting for 42% of all downloads and 61% of total consumer expenditure. Titles such as Mobile Legends: Bang Bang and Free Fire led the market in both engagement and monetization, while Hypercasual games dominated the download charts.
Beyond entertainment, the Indonesian mobile landscape experienced transformative growth in utility and commerce sectors. Finance app downloads surged by 82% year-over-year, and time spent in shopping applications reached 5.5 billion hours, a 52% increase. The Food and Drink category saw the most explosive growth, with sessions increasing by over 480% due to the rise of quick-service restaurant brands and delivery services. Additionally, the video streaming market nearly doubled its engagement levels since 2019, driven by a shift toward mobile-first content and the continued dominance of platforms like YouTube and TikTok, the latter of which saw 75% year-over-year growth.
Niche sectors also demonstrated significant momentum as the market matured. Consumer spending on dating apps rose 188% since 2018, while Health and Fitness engagement remained 56% higher than pre-pandemic levels. Business and utility apps like BukuWarung and PLN Mobile emerged as breakout leaders, signaling a deeper integration of mobile solutions into daily professional and civic life. As travel restrictions eased in late 2021, the recovery of travel and sports applications further solidified the mobile device as the central hub for the Indonesian consumer's digital and physical interactions.
- Gaming remains the primary economic driver in Indonesia, accounting for 42% of all app downloads and 61% of total consumer expenditure, with titles like Mobile Legends: Bang Bang and Free Fire leading the market.
- Indonesian mobile users averaged 5.4 hours of daily screen time in 2021, a 38% increase since 2019, totaling 7.31 billion downloads and $532 million in consumer spending.
- The Food and Drink category experienced the most explosive growth, with session counts increasing by over 480% due to the rise of delivery services and quick-service restaurant brands.
- Finance app downloads surged by 82% year-over-year, while time spent in shopping applications reached 5.5 billion hours, reflecting a 52% increase.
- TikTok saw 75% year-over-year growth in engagement, contributing to a near-doubling of the total video streaming market since 2019.
Casual Gaming Apps Report 2022
The mobile gaming landscape entered a period of transition in early 2022, marked by the first year-over-year decline in global spending during the first quarter. Despite this contraction, mobile gaming remains the dominant force in the industry, commanding over 60% of the total market share. Analysis of performance metrics from May 2021 to May 2022 reveals an average cost per install (CPI) of $1.10 and a Day 30 return on ad spend (ROAS) of 17.81%. Lifestyle games emerged as a particularly lucrative segment, generating the highest returns for developers despite carrying higher-than-average acquisition costs.
Platform and regional disparities significantly influence user acquisition strategies. Android remains the more cost-effective platform with an average CPI of $0.75, which is less than half of the $2.27 required on iOS. Notably, both platforms maintain comparable ROAS at the Day 7 and Day 30 marks, suggesting that Android offers superior efficiency for many casual titles. Geographically, North America represents the most expensive market with a CPI of $3.32, while the LATAM and APAC regions provide the most affordable entry points. However, lower acquisition costs in LATAM are often offset by lower overall returns compared to more established markets.
To maintain long-term player investment and monetization, top-grossing casual games increasingly utilize hybrid mechanics. By blending core puzzle or rhythm gameplay with secondary layers like interior design or social competition, developers are successfully extending player lifecycles. These findings, derived from an extensive dataset of 76.1 billion impressions and 58.5 million installs, underscore a shift toward sophisticated, multi-layered game design as a primary driver for growth in an increasingly competitive and price-sensitive mobile environment.
- Mobile gaming maintains over 60% of the total industry market share despite experiencing its first year-over-year global spending decline in Q1 2022.
- Android is significantly more cost-effective for user acquisition than iOS, with an average CPI of $0.75 compared to $2.27, while both platforms deliver comparable Day 30 ROAS.
- Lifestyle games are the most lucrative segment for developers, yielding the highest returns despite carrying higher-than-average acquisition costs.
- North America is the most expensive market for user acquisition with a $3.32 CPI, whereas LATAM and APAC offer lower entry costs but typically provide lower overall returns.
- Top-grossing casual titles are increasingly utilizing hybrid mechanics—blending core gameplay with secondary layers like interior design or social competition—to extend player lifecycles.
State of Mobile: Brazil 2022
Brazil solidified its position as a global leader in mobile engagement throughout 2021, with users averaging 5.4 hours daily on their devices. This record-breaking activity drove 10.3 billion app downloads and a 22% year-over-year increase in consumer spending, which reached $1.13 billion. While social, communication, and video streaming apps captured 70% of total mobile minutes, the gaming sector emerged as the primary engine for monetization, accounting for more than half of all consumer expenditures. Hypercasual titles led in volume, while 4X Strategy games dominated revenue generation.
The market underwent a profound digital transformation across the finance and retail sectors. Finance app downloads surged by 91% over a two-year period, fueled by a large underbanked population gravitating toward neobanks like Nubank and PicPay. Similarly, shopping app engagement rose 45%, though domestic players faced increasing competition as international publishers secured a 52% share of the local market. This shift toward digital-first services extended to the "rapid delivery" and food sectors, where sessions reached 4.5 billion, and the business category, where users increasingly utilized apps to secure alternative income through gig economy platforms.
Post-pandemic recovery and lifestyle shifts further diversified the mobile landscape. Travel and sports apps saw significant rebounds in downloads and time spent, while the dating sector reached $47 million in consumer spend, marking a 62% increase since 2018. Health and fitness apps also maintained momentum with a 30% growth in downloads compared to pre-pandemic levels. Emerging trends, such as the 45% surge in TikTok usage and the rise of avatar-based social metaverses, indicate a maturing market where short-form video and interactive digital environments are becoming central to the Brazilian mobile experience.
- Brazilian mobile users averaged 5.4 hours of daily device usage in 2021, driving 10.3 billion app downloads and $1.13 billion in consumer spending.
- Gaming is the primary monetization engine in Brazil, accounting for over 50% of total consumer spend, with hypercasual titles leading in volume and 4X Strategy games dominating revenue.
- Finance app downloads surged 91% over two years, driven by a large underbanked population adopting neobanks such as Nubank and PicPay.
- Shopping app engagement grew 45%, though international publishers now control 52% of the local market share.
- The dating sector reached $47 million in consumer spend in 2021, representing a 62% increase since 2018.
Mobile App Trends 2022
The mobile app industry experienced a period of robust expansion throughout 2021, characterized by $170 billion in consumer spending and $288 billion in advertising expenditures. Despite the implementation of Apple’s App Tracking Transparency framework, the sector demonstrated unexpected resilience as global opt-in rates reached 25%, significantly outperforming initial industry forecasts. This growth was distributed across several key verticals, with fintech and gaming leading the surge in installs at 35% and 32% respectively, while e-commerce maintained steady upward momentum with a 12% increase in downloads.
Fintech emerged as a primary driver of engagement, particularly within the asset management and cryptocurrency subverticals. While traditional banking and payment apps maintained the highest share of installs, crypto apps achieved record session lengths exceeding 15 minutes. This heightened engagement occurred alongside a sharp rise in acquisition costs, with effective cost-per-install (eCPI) for fintech apps more than tripling. Consequently, developers are increasingly pivoting toward subscription-based models to ensure long-term profitability and offset the rising price of user acquisition.
The e-commerce and gaming sectors mirrored this trend of higher costs paired with increased user value. Although e-commerce retention rates saw a slight decline, total in-app revenue jumped by 46%, driven by longer session durations in marketplace apps. Similarly, the gaming industry saw hyper-casual titles dominate download volumes while adventure and strategy games secured deeper engagement. Across all sectors, the transition toward higher-quality user bases is evident; while it is becoming more expensive to acquire users, those who remain are spending more time and money within apps, making retention and lifetime value the critical metrics for sustained success in a maturing mobile market.
- The mobile industry generated $170 billion in consumer spending and $288 billion in advertising expenditures during 2021.
- Apple’s App Tracking Transparency framework saw a 25% global opt-in rate, exceeding initial industry expectations for resilience.
- Fintech and gaming led installation growth at 35% and 32% respectively, while e-commerce downloads increased by 12%.
- Fintech apps experienced a tripling of effective cost-per-install (eCPI), prompting a strategic shift toward subscription-based revenue models.
- E-commerce in-app revenue rose by 46% despite a slight decline in retention rates, driven by longer session durations in marketplace apps.
State of Mobile 2022 India
The Indian mobile ecosystem is undergoing rapid transformation, driven by a convergence of gaming, financial services, and entertainment applications. Hyper‑casual titles, primarily action‑puzzle games, have surpassed five billion downloads worldwide, while 4X march‑battle strategy games commanded the highest consumer spend in 2021, generating roughly ten billion dollars. This surge in gaming activity coincides with a 28 percent year‑over‑year increase in finance‑app usage, pushing total downloads beyond one billion and reaching 1.2 billion installations. Cryptocurrency platforms such as Binance, WazirX and CoinDCX recorded the strongest gains in sessions per user, signalling a growing appetite for digital‑asset services. Retail and video‑streaming applications also expanded markedly, with shopping apps alone accounting for 7.57 billion hours of user engagement.
The market in 2021 was dominated by a blend of global and domestic firms. Google, Meta, Reliance, the Times Group, ShareChat and Bharti Airtel led both download and spend rankings across categories. In the gaming segment, Chinese and U.S. publishers—including Tencent, Jinke Culture (Outfit7), Voodoo, ironSource and Supercell—held top positions, with popular titles such as Carrom Pool and My Talking Tom Friends driving user acquisition. This competitive landscape underscores the importance of cross‑border content while highlighting the rising influence of Indian platforms.
Overall, the data illustrate a diversified mobile market in India where high‑growth sectors—hyper‑casual gaming, strategic spend‑heavy titles, and fintech services—are reshaping user behavior and revenue streams. The coexistence of strong domestic players with leading international publishers suggests a dynamic environment poised for continued expansion throughout the coming years.
- The Indian mobile market is defined by high-growth sectors in gaming, fintech, and retail, with 4X march-battle strategy games generating approximately $10 billion in global consumer spend during 2021.
- Finance application usage in India grew by 28% year-over-year in 2021, resulting in over 1.2 billion total installations.
- Hyper-casual action-puzzle games have achieved significant scale, surpassing five billion downloads worldwide.
- Cryptocurrency platforms including Binance, WazirX, and CoinDCX experienced the strongest growth in sessions per user, reflecting a rising demand for digital-asset services.
- Retail applications saw massive user engagement, with shopping apps accounting for 7.57 billion hours of total usage in 2021.