Market Analysis
Documents
Gaming Deals Activity 2021
The video games industry experienced a record-breaking financial year in 2021, with the total value of closed transactions reaching $71.3 billion across 937 deals. This represents a 2.1x growth in value and a 1.4x increase in deal volume compared to the previous year. When including announced but not yet closed transactions, the total market activity reached $80.4 billion. The industry saw significant expansion across all primary segments, including gaming titles, platform and technology, and esports, driven by a surge in high-value "mega-deals" and a massive influx of capital into emerging sectors.
Mergers and acquisitions served as the primary engine for growth, accounting for $34.5 billion in closed deal value. Mobile gaming remained the most targeted sub-segment for acquisitions, representing 49% of M&A value, followed by PC and console gaming at 34%. Private investments also doubled to $12 billion, with late-stage transactions making up the majority of this capital. Notably, blockchain gaming emerged as a breakthrough sector, with investment value skyrocketing 68x year-over-year to $3.1 billion. Public offerings, including IPOs and SPACs, contributed $24.8 billion to the annual total, despite a slight decrease in the overall number of transactions.
The competitive landscape for strategic investors shifted as Embracer Group surpassed Tencent for the top ranking by closing 26 deals valued at $6.7 billion. In the venture capital space, BITKRAFT Ventures, Andreessen Horowitz, and Makers Fund led activity, collectively participating in hundreds of deals. Geographically, Turkey emerged as a significant global hub for early-stage gaming startups. Data for these findings was compiled through the tracking of closed transactions using public media, business partnerships, and S&P Capital IQ, excluding pure gambling and betting entities. The analysis concludes that the aggressive consolidation and investment trends observed in 2021 are positioned to continue into 2022.
- The gaming industry saw record financial activity in 2021, with closed transactions totaling $71.3 billion across 937 deals, representing a 2.1x increase in value and 1.4x increase in volume over the previous year.
- Mergers and acquisitions were the primary growth driver at $34.5 billion, with mobile gaming capturing 49% of that value, followed by 34% for PC and console gaming.
- Public offerings, including IPOs and SPACs, generated $24.8 billion in value, while private investments doubled to $12 billion, primarily driven by late-stage funding.
- Blockchain gaming emerged as a major growth sector, with investment value surging 68x year-over-year to reach $3.1 billion.
- Embracer Group became the most active strategic investor in 2021, closing 26 deals worth $6.7 billion and surpassing Tencent in deal volume.
Newzoo Trends to Watch 2022: Games, Esports, Live Streaming, Cloud and the Metaverse
The analysis projects that 2022 will be defined by a cautious expansion of emerging monetisation models and a deepening investment in immersive technologies. While non‑fungible tokens and crypto‑based revenue streams continue to provoke player backlash, platform bans and regulatory scrutiny, publishers are expected to experiment with “NFT‑like” features under less contentious branding. Concurrently, legal pressure on Apple and Google is likely to ease app‑store steering rules, creating alternative payment pathways that could reshape distribution economics.
Metaverse and virtual‑reality narratives are driving substantial capital inflows, with major hardware releases from Meta, Sony and Apple building on the strong sales of the Quest 2 in 2021. High‑profile titles such as Horizon Forbidden West illustrate the market’s appetite for immersive experiences. A parallel “brand gold rush” in virtual real‑estate is accelerating, exemplified by multi‑million‑dollar acquisitions in Decentraland’s Fashion District and The Sandbox, where corporations are establishing branded malls and interactive spaces.
Globally, the games industry generated $175.9 billion in 2021, anchored by the Asia‑Pacific region’s $88.2 billion contribution and an 8.7 percent compound annual growth rate. North America remains a significant market, while esports and cloud‑based services continue to expand the ecosystem’s reach and monetisation potential. The convergence of these trends suggests a year of strategic experimentation, heightened investment in immersive platforms, and evolving regulatory landscapes shaping the future of interactive entertainment.
- The global games industry generated $175.9 billion in 2021, with the Asia-Pacific region contributing $88.2 billion and maintaining an 8.7 percent compound annual growth rate.
- Publishers are shifting away from explicit NFT branding due to player backlash and regulatory scrutiny, opting instead to experiment with 'NFT-like' features under alternative labels.
- Legal pressure on Apple and Google is expected to force a relaxation of app-store steering rules, potentially creating new payment pathways that will alter distribution economics.
- Major hardware releases from Meta, Sony, and Apple are building on the momentum of the Quest 2 to drive capital into immersive technologies and virtual reality.
- A 'brand gold rush' is occurring in virtual real estate, with corporations spending millions to acquire space in platforms like Decentraland and The Sandbox for branded malls and interactive experiences.
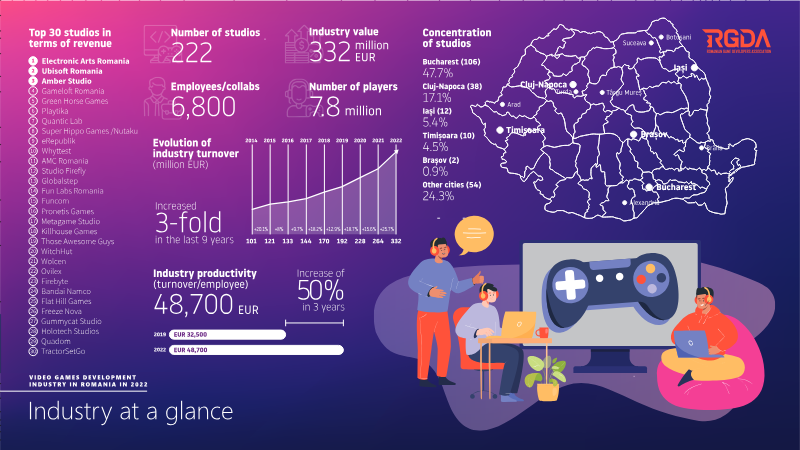
Video Games Development Industry in Romania – 2022 (Summary & Key Insights)
Video Games Development Industry in Romania – 2022 (Summary & Key Insights)
1. Industry at a Glance
| Metric | Figure (2022) | Comments | |--------|---------------|----------| | Total industry value | ≈ €222‑332 million (range reported) | The spread reflects different sources/segments (e.g., studio revenue, B2B services). | | Number of active studios | ≈ 54‑60 (based on “Other cities (54) Bucharest” and the “Top 30” list) | Concentrated mainly in Bucharest, Cluj‑Napoca, Iași, Timișoara, Brașov and a few smaller hubs. | | Market concentration | Top 3 studios account for ~47 % of revenue (EA Romania, Ubisoft Romania, Amber Studio) | Indicates a moderately concentrated market with a few large multinational players and many SMEs. | | Growth trend (2021‑2022) | +15 % – +25 % for several mid‑size studios (e.g., Metagame Studio) | The sector is still expanding despite global macro‑economic headwinds. | | Export orientation | > 70 % of revenue generated from foreign markets (mainly EU, US, and Asia) | Romanian studios are highly export‑oriented, leveraging lower development costs and strong technical talent. |
2. Top 30 Studios (by reported revenue / size)
| Rank | Studio | Location(s) | Reported Revenue / Size | Notable Points | |------|--------|-------------|------------------------|----------------| | 1 | Electronic Arts Romania | Bucharest (HQ), Iași | €106 M (largest single studio) | EA’s “Playtika” and “EA Studios” units are the biggest revenue generators. | | 2 | Ubisoft Romania | Bucharest, Cluj‑Napoca, Iași | 47.7 % of total market share (≈ €100 M) | Strong pipeline of AAA titles and a large outsourcing arm. | | 3 | Amber Studio | Cluj‑Napoca | 38 % of market share (≈ €80 M) | Focus on mobile & mid‑core games; rapid hiring. | | 4 | Gameloft Romania | Turda, Târgu Mureș | €6.8 M (6,800 k) | Mobile‑first, strong presence in EU & LATAM. | | 5 | Green Horse Games | Arad | €? (data missing) | Indie‑focused, growing export sales. | | 6 | Playtika | Iași | €12 M (approx.) | Social
- The Romanian video game industry generated between €222 million and €332 million in 2022, driven by a highly export-oriented model where over 70% of revenue comes from foreign markets.
- Market concentration is high, with the top three players—Electronic Arts Romania, Ubisoft Romania, and Amber Studio—accounting for approximately 47% of total industry revenue.
- Electronic Arts Romania is the largest single entity in the sector, reporting €106 million in revenue, followed by Ubisoft Romania and Amber Studio, which represent significant market shares of 47.7% and 38% respectively.
- Despite global economic headwinds, the sector maintained a growth trend of 15% to 25% for several mid-size studios during the 2021–2022 period.
- The industry comprises approximately 54 to 60 active studios, with operations primarily clustered in major hubs including Bucharest, Cluj-Napoca, Iași, Timișoara, and Brașov.

Llibre Blanc de la Indústria Catalana del Videojoc 2022
The 2022 white paper evaluates the state of Catalonia’s video‑game sector, arguing that while the region has become an increasingly attractive hub for development, persistent structural constraints—particularly in talent supply and financing—limit its growth potential. By mapping the ecosystem’s performance against recent trends, the analysis highlights the urgent need for coordinated policy action to sustain the momentum generated by recent investment inflows.
A striking 59 % of Catalan studios report difficulty recruiting qualified personnel, a proportion that, although lower than in 2019‑2020, remains markedly high. Financing emerges as the foremost ongoing obstacle, closely followed by challenges in attracting and retaining skilled staff and the absence of competitive fiscal incentives. Despite these constraints, foreign direct investment surged, with five new projects injecting €39.5 million into the local economy and creating 377 jobs, representing a 32 % year‑on‑year increase in employment opportunities within the sector.
The findings suggest that reinforcing fiscal support mechanisms, expanding specialised training programmes, and fostering stronger links between academia and industry are essential to convert Catalonia’s investment appeal into durable, high‑value growth. Strengthening these levers would not only alleviate the talent bottleneck but also enhance the region’s capacity to attract further capital, positioning Catalonia as a leading European centre for video‑game development in the medium term.
- Catalonia's video-game sector faces a significant talent bottleneck, with 59% of studios reporting ongoing difficulties in recruiting qualified personnel.
- Foreign direct investment in the region saw a major surge, with five new projects injecting €39.5 million into the local economy.
- Employment opportunities within the Catalan video-game industry grew by 32% year-on-year, resulting in 377 new jobs.
- Financing remains the primary obstacle to industry growth, followed closely by the challenge of retaining skilled staff and a lack of competitive fiscal incentives.
- To sustain current momentum, the report identifies the expansion of specialized training and stronger academia-industry links as essential requirements for long-term growth.
Construyendo un Sector del Videojuego en Igualdad
The Spanish video‑game market now serves more than 18 million players, with women representing 48 % of the audience, yet women occupy only about 20 % of development roles across Europe’s roughly 90 000‑person sector. This persistent gender gap, amplified by the COVID‑19 pandemic and Brexit‑related uncertainties, motivates a coordinated push for equality that links industry associations, NGOs such as Women in Games, and policy makers. The central thesis is that genuine gender parity requires systemic change across recruitment, workplace culture, product design, and community moderation, supported by transparent data and legally anchored standards.
Key findings show that inclusive branding, gender‑neutral job ads, transparent salary bands and multi‑reviewer hiring processes can increase women’s entry and retention, while mentorship programmes, employee‑representative groups, regular engagement surveys and equitable parental‑leave schemes produce measurable improvements in pay‑gap closure and promotion rates. Companies that have instituted unconscious‑bias training, “inclusion nudges,” and data‑driven KPIs—such as Wooga—report higher retention and greater representation of women in senior positions. Community‑level interventions, including robust codes of conduct, verified‑identity requirements and AI‑enhanced chat filters, have already cut toxic messages by 5 % in pilot environments, demonstrating the effectiveness of proactive moderation.
The analysis covers the European context, drawing on data up to 2022 from Spain,
- Women comprise 48% of the 18 million players in the Spanish market, yet they hold only 20% of development roles within the 90,000-person European industry.
- Systemic hiring reforms—including gender-neutral job advertisements, transparent salary bands, and multi-reviewer processes—are essential to increasing the entry and retention of women in development roles.
- Companies such as Wooga have achieved higher retention and increased female representation in senior leadership by utilizing unconscious-bias training, inclusion nudges, and data-driven KPIs.
- Proactive community moderation, including verified-identity requirements and AI-enhanced chat filters, has successfully reduced toxic messaging by 5% in pilot environments.
- Internal workplace initiatives like mentorship programs, employee-representative groups, and equitable parental-leave schemes are proven to improve pay-gap closure and promotion rates for women.
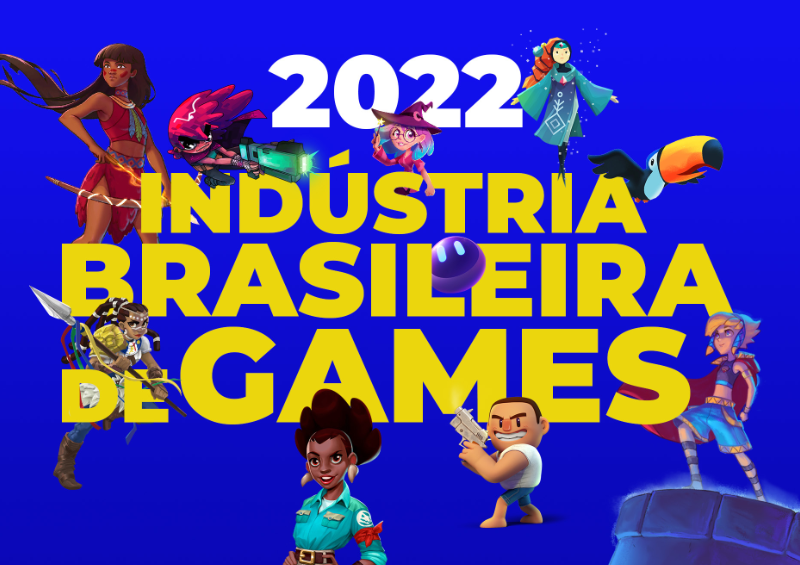
Pesquisa da Indústria Brasileira de Games 2022
The 2022 Brazilian Games Industry Survey demonstrates that Brazil’s gaming sector has entered a phase of rapid expansion and increasing global relevance. Between 2018 and 2022 the number of domestic development studios more than doubled, rising from 375 to 1,009, while domestic digital‑game sales reached over US $2.3 billion in 2021, accounting for roughly three‑quarters of the market’s total revenue. This growth reflects a maturing ecosystem that now includes a full spectrum of domestic and foreign participants, from independent creators to multinational publishers.
The analysis highlights a dual‑track outlook in which private investment is expected to intensify, driving higher levels of international publishing, scaling of emerging opportunities, and greater promotion of Brazilian events abroad. Concurrently, public agencies such as Abragames, Brazil Games and ApexBrasil are projected to expand quantitative support through export missions, business‑matching initiatives and promotional campaigns, reinforcing the sector’s export potential. A broad portfolio of recent Brazilian titles illustrates the country’s expanding talent pool and creative versatility, positioning Brazil as a competitive player on the world stage.
Overall, the findings underscore a robust, export‑oriented trajectory for Brazil’s gaming industry, driven by a surge in studio formation, strong domestic sales, and coordinated public‑private efforts aimed at amplifying international visibility and market access. The survey’s scope encompasses the national market from 2018 through 2022, covering studio demographics, revenue figures, and the institutional framework supporting the sector’s growth.
- The number of domestic game development studios in Brazil more than doubled between 2018 and 2022, growing from 375 to 1,009.
- Domestic digital game sales in Brazil reached over US $2.3 billion in 2021, representing approximately 75% of the total market revenue.
- The Brazilian gaming sector is shifting toward an export-oriented model supported by coordinated efforts from public agencies including Abragames, Brazil Games, and ApexBrasil.
- Public-private initiatives are prioritizing international market access through export missions, business-matching programs, and promotional campaigns.
- Private investment is expected to increase, focusing on scaling emerging opportunities and expanding the international publishing of Brazilian titles.
Rapport Annuel 2022 de l'ALD: Canada
The Association canadienne du logiciel de divertissement (ALD) presents an overview of its 2022 activities, emphasizing the organization’s mandate to champion the Canadian video‑game sector through policy advocacy, industry research and public‑relations initiatives. Central to the narrative is the 2021 economic study conducted with Nordicity, which quantifies the sector’s contribution to the national economy and underscores its resilience amid pandemic‑induced disruptions.
The study reveals that the industry expanded from fewer than 700 active studios in 2019 to nearly 1 000 in 2021, employing more than 32 000 full‑time workers and supporting an additional 23 000 indirect jobs. Direct output now adds $5.5 billion to Canada’s gross domestic product, the highest level recorded to date. Survey participation reached a record 160‑plus responses, representing over 150 studios that supplied employment and financial data. Diversity and inclusion policies are in place at more than 80 % of studios with 100 or more employees, indicating a sector‑wide commitment to balanced talent pipelines.
Complementary efforts include a bilingual “#MyWhy” vaccination campaign that mobilized seven influencers to produce eight videos, and a newly funded guide outlining electronic‑waste recycling obligations for members. Media outreach, coordinated with Hill & Knowlton Strategies, generated roughly 39 million impressions, 66 000 Twitter impressions, 11 000 Instagram impressions and 42 000 YouTube views, translating into over 1 200 hours of video consumption. Virtual engagements with federal officials covered economic impact, immigration, skills development and cultural funding, while plans are under way for an in‑person “Games on the Hill” event in November 2022.
Overall, the report demonstrates that despite pandemic constraints, the Canadian video‑game industry has continued to grow, diversify and increase its cultural and economic influence, positioning Canada as
- The Canadian video-game industry contributed $5.5 billion to the national GDP in 2021, marking the highest economic output recorded to date.
- The sector experienced significant growth between 2019 and 2021, with the number of active studios increasing from fewer than 700 to nearly 1,000.
- The industry currently supports 32,000 full-time direct employees and an additional 23,000 indirect jobs.
- Over 80% of studios with 100 or more employees have implemented formal diversity and inclusion policies to support talent development.
- Media outreach initiatives generated approximately 39 million impressions across various platforms, including 42,000 YouTube views totaling over 1,200 hours of consumption.
Campo da Gioco Equo
The guide argues that gender equity is both a commercial necessity and a social responsibility for the European video‑game sector, which employs roughly 90 000 people while women constitute only about 20 % of developers despite half of Europe’s population being gamers. It frames equitable hiring, compensation, and workplace culture as strategic imperatives that can unlock talent, improve product relevance, and enhance profitability across development, publishing, and community‑management functions.
Key findings reveal a persistent 14.1 % gender‑pay gap within the EU and a pronounced promotion disparity linked to biased “potential” assessments. Transparent salary bands, gender‑bias‑checked job descriptions, and data‑driven monitoring are shown to narrow these gaps, as illustrated by Outplay’s partnership with InGAME, which produced a policy kit aligning compensation, career growth, and flexible work with equity goals. Hybrid‑flexible work models, mental‑health support, and targeted health initiatives—such as menopause pledges—further sustain inclusion, with Wooga’s five‑year parity programme cited as a successful example.
The document outlines concrete actions for building inclusive cultures: senior‑leadership commitment, merit‑based hiring, regular employee surveys, and zero‑tolerance harassment policies. Effective employee‑resource groups, exemplified by Take‑Two’s “Women in Gaming” ERG, amplify under‑represented voices and drive mentorship, innovation, and retention. Community‑safety measures, including AI‑enhanced moderation and diversified moderator teams, reduced toxic chat by 5 % in a pilot, demonstrating the impact of proactive, data‑driven interventions.
Education and pipeline initiatives span Europe, from the AWS GetIT programme that has reached over 23 000 students to national diversity pledges in France, Germany, Spain, Sweden, and the UK. These efforts aim to address the projected need for 500 000 software engineers and double girls’ interest in technical careers through early exposure and role‑model visibility. The guide stresses that measurable KPIs, positive‑action hiring practices, and compliance with EU legal frameworks are essential for tracking progress and ensuring lasting gender‑parity across the games industry.
- Women currently represent only 20% of the 90,000-person European video-game workforce, despite comprising half of the continent's gaming population.
- A persistent 14.1% gender-pay gap exists within the EU gaming sector, exacerbated by promotion disparities rooted in biased assessments of employee potential.
- Proactive, data-driven interventions—such as AI-enhanced moderation and diversified teams—successfully reduced toxic in-game chat by 5% in pilot programs.
- Industry-wide pipeline initiatives, such as the AWS GetIT programme, have reached over 23,000 students to address a projected demand for 500,000 software engineers.
- Companies like Outplay and Wooga have demonstrated that formalizing salary transparency, flexible work models, and long-term parity programmes effectively narrows gender gaps and improves retention.
The State of Mobile Game and App Markets: Global Report on App Marketing for H1 2022
Document Title: The State of Mobile Game and App Markets: H1 2022
Executive Overview
Market Contraction, but Not Uniform: Overall mobile‑app and game ecosystem shrank – 6.2 % YoY drop in the number of advertisers and a 27 % decline in total creatives. The contraction was regional: Europe, North America, and Oceania bore the brunt, while Tier‑2/3 markets (especially Hong Kong, Macau, and Taiwan) surged – advertiser counts rose 37 % YoY.
Creative Strategy Shift: Marketers moved away from “quantity‑over‑quality” to higher‑quality, user‑generated‑content (UGC)‑style creatives. This pivot drove a 27.8 % YoY reduction in total mobile‑game creatives (down to 15.8 M), while the advertiser base remained relatively stable (≈ 45.1 K).
Performance‑Driven Campaigns: Adoption of cost‑per‑play (CPP) and in‑app‑purchase‑return‑on‑ad‑spend (IAP‑ROAS) optimization grew sharply. Machine‑learning‑powered tools—predictive analytics, automated bidding, and the new SKAdNetwork 4.0 attribution framework for iOS—helped offset rising cost‑per‑install (CPI) pressures and improve early‑stage ROI measurement.
App‑Store Search Dominance: 64.7 % of all app installs in H1 2022 originated from App Store search. Consequently, publishers and marketers doubled‑down on App Store Optimization (ASO) and Apple Search Ads, treating search visibility as a primary acquisition channel.
Growth Outlook: Future expansion is expected to be driven by emerging markets (Tier‑2/3 regions) and increased reliance on AI/ML‑based campaign automation. Continued investment in high‑impact, UGC‑styled creatives and search‑centric acquisition will be critical to sustain performance as CPI trends upward.
Section‑by‑Section Highlights
| Section | Core Findings | |---------|----------------| | 1 – Market Landscape | • 6.2 % YoY decline in advertisers; 27 % drop in creatives.<br>• Steepest losses in Europe, NA, Oceania.<br>• 37 % YoY advertiser surge in Hong Kong, Macau, Taiwan (Tier‑2/3).<br>• Shift to higher‑quality, UGC‑style creatives and predictive‑analytics‑driven campaigns (incl. SKAdNetwork 4.0). | | 2 – Creative & Optimization Trends | • 27.8 % YoY reduction in total mobile‑game creatives → 15.8 M.<br>• Advertiser count stable at ~45.1 K.<br>• Widespread adoption of CPP and I
- App Store search accounted for 64.7% of all mobile app installs in H1 2022, cementing search visibility and ASO as the primary acquisition drivers.
- The mobile ecosystem experienced a contraction in mature regions, evidenced by a 6.2% year-over-year decline in advertisers and a 27% drop in total creatives.
- Tier-2/3 markets, specifically Hong Kong, Macau, and Taiwan, bucked the global trend with a 37% year-over-year increase in advertiser counts.
- Marketers pivoted from high-volume creative strategies to high-quality, UGC-style content, resulting in a 27.8% year-over-year reduction in total mobile game creatives to 15.8 million.
- Publishers increasingly adopted machine-learning-powered tools, including predictive analytics and the SKAdNetwork 4.0 framework, to mitigate rising CPI and improve IAP-ROAS measurement.

2022 Global White Paper on Mobile Advertising & Marketing Game
The global mobile market in the first half of 2022 underwent a significant transition, characterized by a contraction in total advertising volume alongside a strategic pivot toward high-quality, video-centric content. While the total number of advertisers and ad creatives declined year-over-year, emerging markets in the Middle East, South America, and Southeast Asia experienced robust growth. This period saw a sharp rise in advertising costs, with the average CPM reaching $19.31 and the United States and South Korea emerging as the most expensive regions for user acquisition.
Casual and puzzle games dominated the advertising landscape by volume, yet RPGs and strategy titles commanded the highest revenue and advertising spend. A notable trend involved mid-core developers utilizing "lightweight" or drama-based video creatives to lower entry barriers for broader audiences. Video formats now constitute over 86% of all creatives, with interactive AR filters and short-form content on platforms like Snapchat and TikTok challenging the traditional dominance of Meta. In the non-gaming sector, shopping and finance apps led in advertiser activity, while reading apps produced the highest volume of individual creatives.
The industry faced headwinds from Apple’s IDFA privacy changes, prompting a shift toward "motivation-based" creative strategies and localized global launches, particularly by Chinese firms seeking relief from domestic regulatory pressures. Despite rising costs and a 27% drop in creative volume, the market remains dynamic, driven by the expansion of esports, cross-platform play, and a growing consumer interest in the metaverse. Success is increasingly defined by down-funnel conversion optimization and the use of immersive, emotionally resonant storytelling to engage diverse global demographics.
- The global mobile advertising market saw a 27% decline in creative volume during the first half of 2022, accompanied by rising costs that pushed the average CPM to $19.31.
- Video content now dominates the advertising landscape, accounting for over 86% of all creatives as developers shift toward high-quality, drama-based storytelling to lower entry barriers.
- While the total number of advertisers decreased, emerging markets in the Middle East, South America, and Southeast Asia showed robust growth, contrasting with the high-cost user acquisition environments of the United States and South Korea.
- Apple’s IDFA privacy changes forced a strategic pivot toward motivation-based creative strategies and localized global launches, particularly among Chinese firms facing domestic regulatory constraints.
- Casual and puzzle games led in total advertising volume, but RPG and strategy titles commanded the highest advertising spend and revenue generation.

Modern Mobile Consumer 2022: App Discovery Report
The Modern Mobile Consumer 2022: App Discovery Report examines the evolving journey of mobile users from initial app discovery to daily usage and long-term engagement. The primary thesis suggests that the traditional distinction between gamers and non-gamers is increasingly obsolete, as consumer behaviors and attitudes toward advertising are remarkably consistent across different app categories. Findings indicate that mobile gaming has become a universal hobby, with 60% of non-gaming app users playing mobile games daily, tying with social media for the top usage category.
Data highlights the dominance of in-app advertising as a discovery tool, with 70% of gaming audiences and 78% of a control group reporting they have downloaded apps after seeing mobile advertisements. While most users maintain over 20 apps on their devices, the majority only engage with five to ten apps daily. To break into this limited rotation, the research suggests that video ads, app store promotions, and interactive formats are the most effective. Furthermore, rewarded ads—traditionally associated with gaming—show broad appeal, with 33% of non-gaming audiences paying more attention to ads that offer in-app incentives.
The research methodology involved a large-scale survey of 30,457 respondents conducted in April and May 2022. The sample included 18,894 consumers from gaming apps and 11,563 from non-gaming apps within the ironSource network, supplemented by a 500-person third-party control group to eliminate bias. All participants were verified adults aged 18 or older. The geographic scope is global, focusing on the broader mobile app economy. Conclusions emphasize that successful user acquisition strategies must prioritize interest-based relevance, humor, and rewarded engagement to capture the attention of the modern mobile consumer.
- Mobile gaming has become a universal behavior, with 60% of non-gaming app users playing mobile games daily, matching social media as the top usage category.
- In-app advertising is a primary driver for app discovery, leading to downloads for 70% of gaming audiences and 78% of non-gaming control group users.
- While users typically maintain over 20 apps on their devices, the majority limit their daily engagement to only five to ten apps.
- Rewarded ads have broad appeal beyond gaming, with 33% of non-gaming audiences reporting they pay more attention to advertisements that offer in-app incentives.
- To successfully acquire users in a crowded market, developers should prioritize interest-based relevance, humor, and interactive ad formats.
Ad Intelligence: An Overview 2022
Analysis of mobile advertising intelligence from 2022 reveals a rapidly expanding market, with the number of advertisers doubling since 2019 to exceed 120,000. Data collected from 35 countries across the Apptica platform indicates a significant platform disparity, as Android accounts for 71% of advertisers and over 80% of the 14.6 million total creatives tracked during the period. While Android publishers outnumber those on iOS by a factor of two, the gaming sector remains the dominant force on both platforms, capturing 69.02% of advertising traffic on the App Store and 55.58% on Google Play.
The gaming landscape is primarily led by the Casual and Puzzle genres. Casual games represent the largest traffic share on iOS at 23.8%, while Puzzles lead on Android at 25.4%. Beyond gaming, the Shopping and Social categories emerge as the other primary drivers of high-volume traffic. Top individual advertisers by traffic share include Meta Platforms, Playrix, and TikTok, while NewsBreak and ITI Inc. lead in the sheer volume of unique creatives.
Methodological findings highlight distinct creative strategies between operating systems. On iOS, video is the preferred format, accounting for 59.9% of creatives. Conversely, Android relies more heavily on static images, which make up 58.8% of its ad inventory. Interactive or playable ads remain a niche but consistent segment, representing less than 3% of the total share on both platforms. The data suggests that publishers are significantly more aggressive with creative testing on Android, often running between 2 and 124 times more creative variations than they do on iOS. Playrix, Easybrain, and Tripledot Studios are identified as the most consistent market leaders, appearing in the top ten for buying share across both ecosystems.
- The mobile advertising market has doubled since 2019, with over 120,000 active advertisers identified across 35 countries in 2022.
- Android dominates the advertising landscape, accounting for 71% of advertisers and over 80% of the 14.6 million creatives tracked.
- Gaming remains the primary advertising sector, capturing 69.02% of traffic on the App Store and 55.58% on Google Play, with Casual and Puzzle genres leading their respective platforms.
- Creative strategies differ by platform: iOS favors video (59.9% of creatives), while Android relies heavily on static images (58.8% of creatives).
- Android publishers are significantly more aggressive in testing, running between 2 and 124 times more creative variations than their iOS counterparts.