Market Analysis
Documents
The State of Mobile Game and App Markets
The analysis demonstrates that mobile app and game advertising in the first half of 2022 experienced a notable contraction, with a 6.24 % year‑over‑year decline in app advertisers and a 27.83 % drop in creative volume, yet the sector is pivoting toward higher‑quality, data‑driven campaigns. Predictive analytics and Apple’s SKAdNetwork 4.0 are emerging as essential tools for optimizing cost‑per‑install, in‑app purchase return on ad spend, and overall campaign effectiveness.
Advertisers are concentrating on impactful creative mechanics and event‑based optimisations, particularly within casual gaming, fitness, and finance verticals. The number of game creatives fell 27.8 % while the advertiser base remained flat at roughly 45,000, indicating a shift from quantity to quality. Major networks such as Unity Ads and AppLovin are leading the charge, with experimentation on offerwall formats that demand precise attribution windows. Meta continues to dominate paid‑social traffic outside the gaming sphere, underscoring its broader reach.
Geographically, tier‑1 markets—US, Australia, Germany, South Korea, UK, and France—dominate spend and revenue, with CPMs peaking in the United States at approximately $27. Lower‑cost regions such as Turkey and India present attractive lifetime value opportunities, especially during seasonal CPM spikes in fall and winter holidays. Android creatives have gained prominence post‑IDFA, while incentive‑based offerwalls are becoming more prevalent.
Publishers increasingly rely on search‑driven installs and coordinated ASO/paid‑social strategies, with Apple Search Ads projected to reach $20 billion by 2025. The focus on higher‑quality ad creatives, blended event optimisation (trial plus subscription), and rising subscription prices—driven by A/B testing and post‑iOS‑14.5 user acquisition costs—highlights a tightening competitive landscape, particularly in Android and tier‑2/3 markets.
- Mobile advertising experienced a significant contraction in H1 2022, marked by a 6.24% year-over-year decline in app advertisers and a 27.83% drop in creative volume.
- The industry is shifting from high-volume output to quality-focused, data-driven campaigns, evidenced by a flat advertiser base of 45,000 despite the sharp reduction in creative assets.
- Apple Search Ads are projected to reach $20 billion in revenue by 2025 as publishers increasingly prioritize search-driven installs and integrated ASO strategies.
- Tier-1 markets, led by the US with peak CPMs of approximately $27, remain the primary drivers of spend and revenue, while Turkey and India offer high lifetime value opportunities during seasonal CPM spikes.
- Predictive analytics and SKAdNetwork 4.0 have become essential for optimizing campaign effectiveness, return on ad spend, and cost-per-install metrics.
Blockchain Industry Report
The report examines the blockchain ecosystem during a prolonged bear market, highlighting how macroeconomic pressures—high U.S. inflation, rising interest rates, and a recessionary environment—have driven investors to withdraw capital from both equity and cryptocurrency markets. This withdrawal has intensified selling pressure, reducing medium‑term trading volume and pushing dapp activity to its lowest point of 2022, with 1.68 million daily unique active wallets (UAW) in July, a 4 % month‑over‑month decline yet still 20 % above July 2021 levels.
DeFi remains the most affected segment, with UAW falling below 500 k for the first time since April 2021—a 22 % MoM drop and a 31 % YoY decline. Total value locked (TVL) has begun to recover, rising 22 % from July 1 to July 31 to $82.3 bn, driven by gains across Ethereum, BNB Chain, and Polygon. Polygon’s network upgrades and migration of Terra projects have contributed to a 17 % TVL increase, while the launch of a web3 smartphone partnership signals continued innovation.
NFT trading volume contracted 25 % MoM, falling below $1 bn for the first time since June 2021. Market concentration intensified, with Yuga Labs’ collections accounting for over 20 % of July’s volume. OpenSea’s dominance has eroded from 84 % to 58.6 %, as new marketplaces such as GameStop and Nickelodeon capture niche segments.
Gaming defied the downturn, achieving 1 million daily UAW and $857 m in transactions, with its share of overall usage rising from 52 % to 57.4 %. The report concludes that while the crypto winter has triggered significant market recalibration, resilient projects—particularly in DeFi and gaming—are positioned to drive a future bull run.
- Blockchain gaming remains the industry's most resilient sector, accounting for 57.4% of total daily unique active wallet (UAW) activity with 1 million daily UAW and $857 million in transactions.
- Total Value Locked (TVL) in DeFi showed signs of recovery in July, increasing 22% to $82.3 billion across major networks like Ethereum, BNB Chain, and Polygon.
- NFT trading volume dropped 25% month-over-month to below $1 billion, while OpenSea’s market share eroded significantly from 84% to 58.6% due to competition from new entrants like GameStop and Nickelodeon.
- Macroeconomic pressures, including high inflation and rising interest rates, caused overall dapp activity to hit its lowest point of 2022 in July with 1.68 million daily UAW.
- The DeFi sector experienced a sharp contraction, with UAW falling 22% month-over-month to below 500,000, marking its lowest level since April 2021.

Data Digest Q2 2022
Global mobile app activity in Q2 2022 showed a modest 2.5 % year‑over‑year decline in total downloads, falling to 35 billion worldwide. TikTok remained the undisputed leader on both Apple’s App Store and Google Play, while Meta’s suite of apps—Instagram, WhatsApp, Messenger—dominated the top‑10 rankings globally. In the United States consumer spending shifted away from games toward non‑game categories, and Meta’s share slipped to fourth place on Google Play. Europe and Asia mirrored TikTok’s dominance, yet regional leaders varied: Google Maps surged in Europe, and VooV Meeting experienced a 47 % jump amid China’s lockdowns.
On Google Play, Asia was the most dynamic market. Instagram captured 22 % of all Meta installs and outpaced Facebook, Snapchat, and WhatsApp. India accounted for 70 % of TikTok’s downloads, while Meesho and WhatsApp Business each exceeded 30 % of their regional installs. Meta’s overall Google Play installs in Asia grew 22 % YoY, whereas competitors showed mixed performance. Worldwide, Meta pulled more than 550 million downloads on Google Play—well ahead of Google’s 320 million—and expanded its lead over the rival.
Google Play downloads totaled 7 billion in Q2 2022, a 26 % YoY increase but still 9.7 % below pre‑pandemic Q2 2019 levels. India remained the largest market with 6 billion downloads, despite a ~10 % YoY decline, while Indonesia’s 8.5 % QoQ growth to 6 billion positioned it to potentially overtake Brazil’s 7.26 billion downloads. Other markets, including the U.S. and Mexico, saw modest changes, underscoring India’s continued dominance and Indonesia’s rapid expansion.
In gaming, Miniclip’s acquisition of Sybo and the inclusion of Subway Surfers propelled it to sixth place in worldwide mobile game downloads, achieving 472 million installs and $194 million in consumer spending, with a May spike. Travel‑app downloads rebounded to over 100 million in the U.S. and 28 million in the U.K., while ticket‑app installs surged, with the top five apps exceeding 10 million U.S. downloads—an increase of more than 70 % from pre‑pandemic levels—highlighting robust growth potential in both gaming and travel/event segments as consumer activity returns to pre‑COVID norms.
- Global mobile app downloads declined 2.5% year-over-year to 35 billion in Q2 2022, while Google Play downloads reached 7 billion, a 26% year-over-year increase that remains 9.7% below pre-pandemic Q2 2019 levels.
- Meta continues to dominate the global app market, securing over 550 million Google Play downloads compared to Google’s 320 million, with Instagram leading Meta’s growth in Asia at 22% of all its regional installs.
- TikTok remains the top-ranked app globally, with India accounting for 70% of its total downloads during the quarter.
- India remains the largest Google Play market with 6 billion downloads, while Indonesia’s 8.5% quarter-over-quarter growth positions it to challenge Brazil’s 7.26 billion download volume.
- Miniclip reached sixth place in worldwide game downloads with 472 million installs and $194 million in consumer spending, largely driven by its acquisition of Sybo and the Subway Surfers title.
The UK's New Immigration System
The UK’s new immigration system, effective since January 2021, represents a fundamental shift in how the video games industry manages international talent following the end of free movement between the UK and the European Union. The primary purpose of this framework is to transition to a points-based system that prioritizes specific skill levels, salary thresholds, and job offers, while encouraging domestic investment in training and workforce development.
Under the current rules, applicants must secure 70 points to qualify for a Skilled Worker visa, with mandatory requirements including a job offer from an approved sponsor, an appropriate skill level, and English language proficiency. Additional points are available for salary levels, roles in shortage occupations, and relevant academic qualifications, such as PhDs in STEM subjects. Beyond the standard Skilled Worker route, the system incorporates various specialized pathways, including the Global Talent visa for exceptional individuals, the Graduate visa for international students, and specific routes for innovators and intra-company transfers.
Businesses operating within the UK video games sector must navigate the complexities of becoming licensed sponsors to hire international staff, including EU citizens who arrived after December 2020. This process involves administrative oversight, potential immigration skills charges based on company size and contract duration, and adherence to evolving government roadmaps aimed at streamlining sponsorship management. Furthermore, the system introduces new regulations for business travel to the EU, EEA, and Switzerland, where visa-free travel is generally limited to 90 days within a 180-day period for meetings, with more stringent requirements for specific professional services. The government continues to refine these processes, with planned reforms for 2022 and 2023 intended to simplify license management and sponsor applications.
- Since January 2021, the UK video games industry must operate under a points-based immigration system that requires international hires to secure 70 points based on job offers, skill levels, and English proficiency.
- UK game studios must become licensed sponsors to hire international staff, including EU citizens who arrived after December 2020, which involves administrative oversight and potential immigration skills charges.
- Applicants can earn additional points toward the 70-point threshold through higher salary levels, roles in shortage occupations, or relevant academic qualifications like STEM PhDs.
- Specialized visa pathways exist alongside the Skilled Worker route, including the Global Talent visa for exceptional individuals, the Graduate visa for international students, and routes for innovators and intra-company transfers.
- Business travel to the EU, EEA, and Switzerland is now restricted to 90 days within any 180-day period for meetings, with stricter requirements applied to specific professional services.

Slovak Game Industry Report 2022
Dear friends, I am proud to present the brand new Slovak also see the post-IDFA peak making game Game Industry 2022 report by the Slovak Game marketing more challenging than ever. Plus Developers Association. Firstly, allow me to give spiralling inflation and low availability of free some perspective about our small yet thriving capital will ratchet up the difficulty to hell mode industry in the larger context. with perma-death.
- The Slovak game industry experienced significant growth in 2021, both in terms of developers and revenue, despite global challenges like the COVID-19 pandemic and the post-IDFA period.
- The top 10% of Slovak game companies generated EUR 69.4 million in turnover in 2021.
- Foreign employees constitute 7% (79 individuals) of the Slovak game industry workforce, with Czechia (16%), Ukraine (12%), and the USA (9%) being the primary countries of origin.
- Self-funding is the dominant funding source for Slovak game developers at 80%, followed by public funding at 37% and international publishers at 24%.
- The Nintendo Switch is the most targeted platform for Slovak game development (30%), closely followed by PC (29%) and PlayStation (27%).
Annual Report of the German Games Industry 2022
01 Players in Germany 8 02 German market for computer 14 03 The games industry in Germany 26 .1 Employment figures and companies .3 The ten demands of the games industry 04 Esports 40 05 esports player foundation 42 06 gamescom and devcom 44 07 German Computer Games Awards 48 08 Entertainment Software 50 09 Foundation for Digital Games 52 10 About game –...
- The German games market grew by 19% in 2021, reaching €5.448 billion, following strong growth in 2020. In-game and in-app purchases were major growth drivers, increasing by 30% to €4.239 billion.
- 59% of Germans play computer and video games, a 6% increase since 2019, with 48% of players being women and 52% men. This indicates sustained engagement even after the pandemic-related surge in 2020.
- The German games industry is experiencing an upward trend, with increases in both companies and employees in 2021 and 2022. This growth is partly attributed to increased games-related study programs at universities.
- Germany has introduced a games funding scheme and its first federal games strategy, which aims to make Germany a globally competitive location for the games industry. Regional funding has also increased, with new schemes launched in Rhineland-Palatinate and plans in Mecklenburg-Vorpommern and Schleswig-Holstein.
- Esports has become a mass movement in Germany, with a growing number of hobby players, clubs, and professional esports players. The esports player foundation provides comprehensive support for aspiring professionals, including sports psychology, nutrition, and financial coaching.
2022 European Video Games Industry Insight Report
By European Game Developers Federation (EGDF) Supported by Video Games Europe European Video Games Industry Data 5 Number of game developer studios 7 Number of service providers 8 Number of people working in the video games industry 9 Percentage of women working in the industry ...
- France and Germany have a significant number of game development service providers, with 261 companies reported in 2022, indicating their importance in the industry.
- Poland had 494 game developer studios in 2022, a notable increase from 412 in 2018, and its industry employed 15,000 people in 2022, up from 9,710 in 2018.
- Spain's video game industry has shown consistent growth, with 447 developer studios in 2022, an increase from 375 in 2018, and employed 9,621 people in 2022, up from 6,900 in 2018.
- Italy had 160 game developer studios in 2022, a rise from 90 in 2018, and its industry employed 2,400 people in 2022, up from 1,100 in 2018.
- Estonia's game development sector in 2020 comprised 37 studios, employed 304 people, and generated 37.2 million euro in turnover.

Dutch Games Monitor 2022
TEXT AND ANALYSIS DESIGN All rights reserved NEO Observatory COVER IMAGE This publication is made possible with Walter Manshanden Horizon Forbidden West the support of Province of Utrecht, by Guerrilla Games Gemeente Utrecht, HKU: University of PROOFREADING AND the Arts Utrecht, Breda University of GENERAL SUPPORT SPECIAL THANKS TO Applied Sciences (BUAS), Hanze Marilla Valente ...
- The Dutch video game industry generated €420-€440 million in revenue in 2021, growing almost 18% annually between 2018 and 2021. The number of companies with over €1 million in revenue increased from 18% in 2018 to 24% in 2021.
- The industry employs 4560 people across 630 companies, with approximately 700 graduates annually. Companies with more than 50 employees doubled from 6 to 12 between 2018 and 2021, indicating significant scaling.
- The Dutch games industry is maturing, with a majority of companies having existed for over 7 years. The largest potential for scaling up is seen in companies with 4 to 12 years of experience.
- Dutch game developers utilize a multi-platform, multi-distribution, and multi-monetization strategy. While Unity remains the most popular game engine, Unreal Engine's usage grew significantly from 8% in 2018 to 25% in 2021.
- Growth is expected across various market segments, with the console/PC market (68% agree/strongly agree) and subscription services showing the most positive outlook. Expectations for the VR market are also more positive than three years ago.
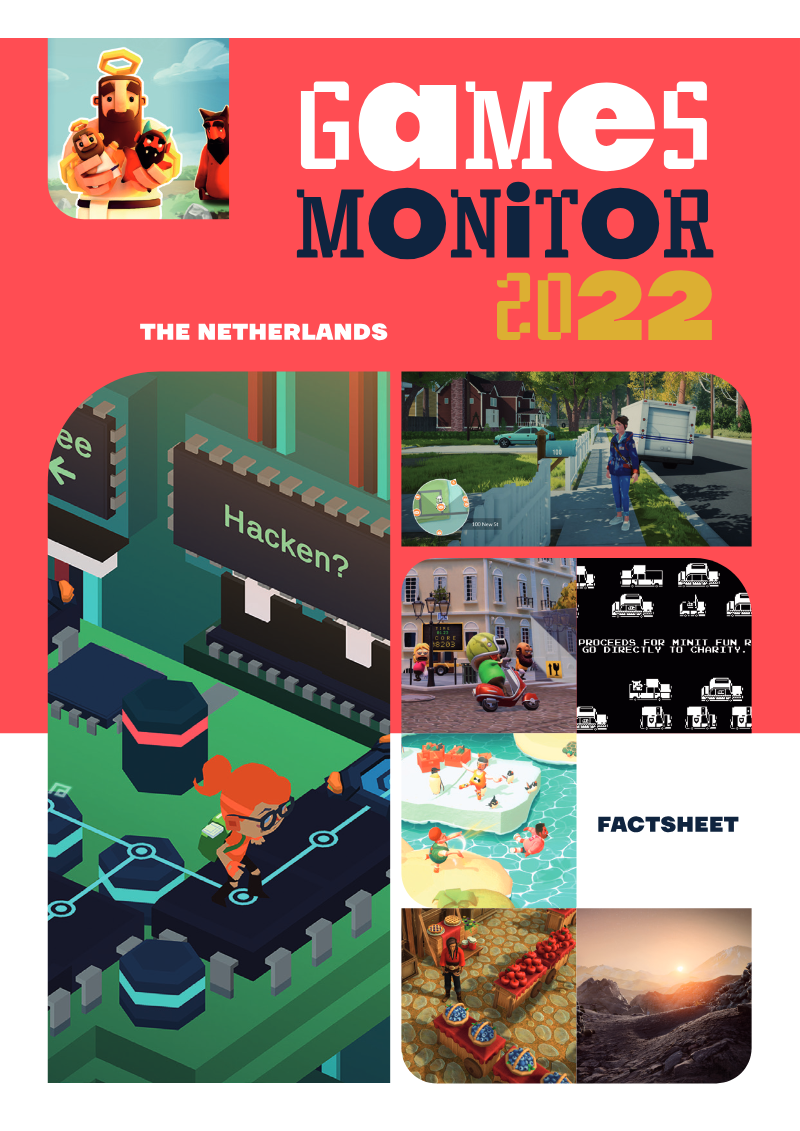
Dutch Games Monitor 2022: Factsheet
The Dutch Games Monitor 2022 provides a comprehensive analysis of the Netherlands' video game industry, covering the period from 2018 to 2021. The primary objective is to evaluate the sector's growth, maturity, and structural evolution. The research methodology incorporates desk research, roundtable discussions, and a survey of approximately 500 companies, yielding nearly 200 responses. The analysis focuses on two distinct domains: entertainment games and applied (serious) games, which serve sectors such as healthcare and education.
The industry demonstrates significant maturation, characterized by a shift from an initial increase in the number of companies to a more recent surge in revenue and employment. By the end of 2021, the sector comprised 630 companies, generating between €420 million and €440 million in annual revenue. This represents an average annual revenue growth of nearly 18%, outpacing global industry averages. Employment also expanded, reaching 4,560 jobs with an annual growth rate exceeding 5%. This job creation is particularly concentrated in larger organizations, with the number of scale-ups employing over 50 people doubling to 12 companies over the three-year period.
Geographically, the Greater Amsterdam region leads in total employment, while Utrecht maintains the highest concentration of applied game developers. Although the number of dedicated game education programs has slightly decreased, the industry is seeing a rise in diversity, with the percentage of women in the workforce reaching 23% by 2021. Furthermore, the sector is increasingly characterized by international expansion, a rise in external investments, and a growing number of mergers and acquisitions, signaling that the Dutch games industry is successfully transitioning into a more mature and globally competitive market.
- The Dutch games industry generated between €420 million and €440 million in annual revenue by the end of 2021, achieving an average annual growth rate of nearly 18%.
- Total employment in the sector reached 4,560 jobs by 2021, reflecting an annual growth rate of over 5%.
- The industry is scaling up, with the number of companies employing more than 50 people doubling to 12 firms between 2018 and 2021.
- The sector comprised 630 companies by the end of 2021, with the Greater Amsterdam region leading in total employment and Utrecht hosting the highest concentration of applied game developers.
- Workforce diversity has improved, with women accounting for 23% of the industry's employees by 2021.
Video Game Streaming Trends: 2022 Second Quarter Report
The second quarter of 2022 marked a period of stabilization for the live streaming industry as the rapid growth spurred by pandemic lockdowns began to cool. Total hours watched across major platforms fell 15% year-over-year to 8.1 billion hours. This decline is attributed in part to creator fatigue, evidenced by a 20% drop in unique channels and a 16% decrease in total hours broadcast. Despite this contraction, the industry remains significantly larger than its pre-pandemic state in 2019.
Twitch continues to dominate the market with a 68% share of total hours watched, followed by YouTube at 14%. Facebook Gaming saw a significant 50% decline in watch time compared to the previous year. Conversely, disruptor platforms like Trovo experienced a 127% increase in viewership, largely driven by Russian streamers migrating from Twitch. While the broader market slowed, the esports segment grew by 8%, with major events like the League of Legends Mid-Season Invitational and the PGL Major Antwerp driving significant engagement.
The data highlights a strategic shift among esports organizations, which are increasingly relying on content creators to reach broader audiences. For example, 98% of the hours watched for Luminosity were generated by its affiliated creators rather than competitive matches. Top-tier games like Grand Theft Auto V and League of Legends maintained their dominance, while new releases like The Quarry demonstrated the potential for narrative-driven titles to capture short-term viewership peaks. Non-gaming content also made an impact, as the Johnny Depp vs. Amber Heard trial boosted the Just Chatting category by over 7% during the quarter.
This analysis covers global streaming trends across nearly 20 platforms, including Twitch, YouTube, and Facebook Gaming, for the period of April through June 2022. The findings are based on proprietary data aggregation and business intelligence from Stream Hatchet.
- Total hours watched across live streaming platforms fell 15% year-over-year to 8.1 billion in Q2 2022, signaling a post-pandemic market stabilization.
- Twitch maintains a dominant 68% market share of total hours watched, while YouTube holds 14% and Facebook Gaming experienced a 50% decline in viewership.
- The esports segment grew by 8% during the quarter, bolstered by major events like the League of Legends Mid-Season Invitational and the PGL Major Antwerp.
- Creator activity contracted significantly, with a 20% drop in unique channels and a 16% decrease in total hours broadcast compared to the previous year.
- Esports organizations are increasingly reliant on content creators for reach, as evidenced by 98% of Luminosity’s total watch time being generated by affiliated creators rather than competitive matches.
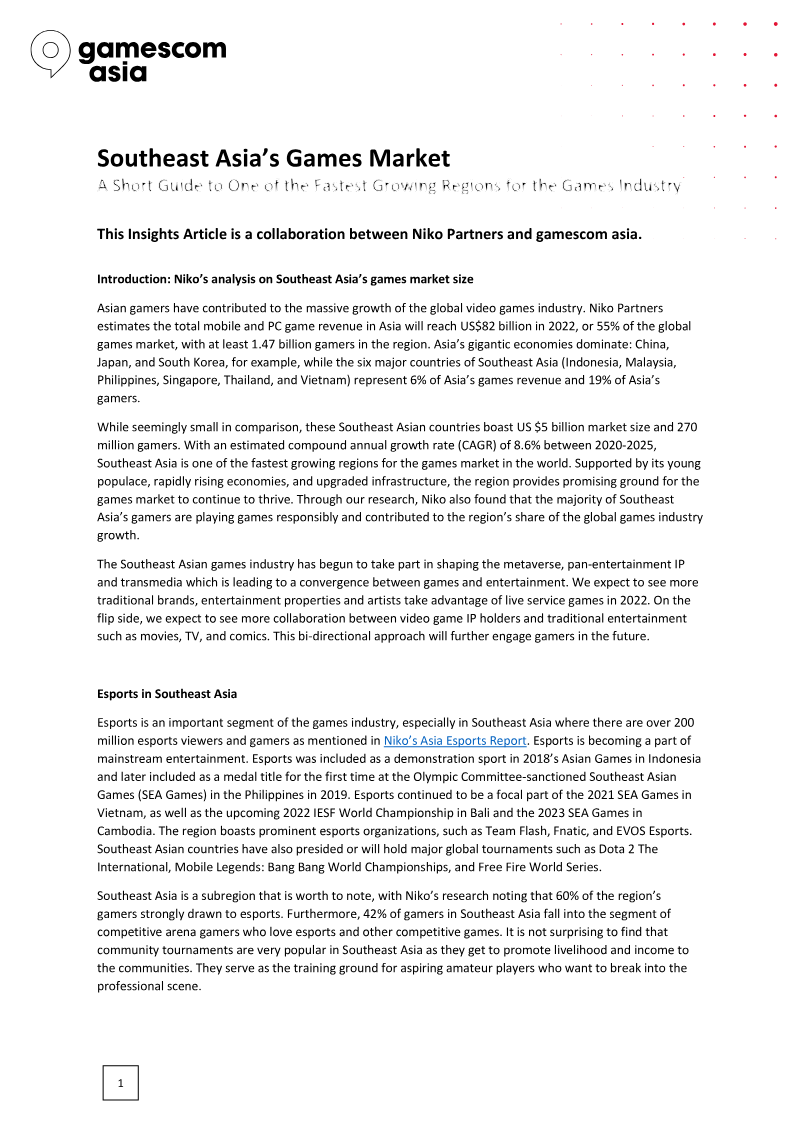
Southeast Asia’s Games Market
Southeast Asia represents one of the world’s fastest-growing video game markets, characterized by a young population, improving infrastructure, and a rapidly expanding digital economy. Data indicates that the six major countries in the region—Indonesia, Malaysia, the Philippines, Singapore, Thailand, and Vietnam—account for approximately $5 billion in market size and 270 million gamers. While this represents 6% of total Asian games revenue, the region is projected to maintain a compound annual growth rate of 8.6% through 2025.
Esports serves as a primary driver for this growth, with over 200 million viewers and gamers in the region. Approximately 60% of Southeast Asian gamers are strongly drawn to esports, and 42% are classified as competitive arena gamers. This interest has led to the integration of esports into major regional athletic events like the SEA Games. Furthermore, the audience is becoming increasingly diverse; female gamers now make up 40% of the total gaming population, with growth rates in this demographic outpacing the general market average. In specific markets like Indonesia and Singapore, women comprise nearly half of the gaming audience.
The region has also emerged as a pioneer in blockchain and play-to-earn gaming, exemplified by the success of titles like Axie Infinity, which reached over one million daily active users. However, the market faces unique challenges, including parental skepticism, fluctuating government regulations regarding game approvals and bans, and complex cultural sensitivities. Successful expansion requires navigating diverse religious and social landscapes, as localized content can significantly boost revenue while cultural oversights can lead to public backlash or censorship. Ultimately, Southeast Asia offers significant opportunities for global stakeholders, provided they adopt localized strategies rather than a one-size-fits-all approach.
- The Southeast Asian games market across six major countries generates approximately $5 billion in revenue from 270 million gamers and is projected to grow at a compound annual rate of 8.6% through 2025.
- Esports is a primary market driver, with over 200 million viewers and 60% of the regional gaming population expressing a strong interest in competitive play.
- Female gamers represent 40% of the total gaming population, with growth in this demographic outpacing the general market and reaching nearly 50% in Indonesia and Singapore.
- The region has pioneered blockchain and play-to-earn gaming, evidenced by titles like Axie Infinity achieving over one million daily active users.
- Market expansion requires localized strategies to navigate complex religious and social landscapes, as cultural oversights frequently lead to censorship or public backlash.
App Marketer Survey
The global app marketing landscape is currently defined by a paradox of rising performance expectations and diminishing data visibility. While nearly 60% of marketing professionals face more aggressive key performance indicators than in previous years, approximately half are struggling to meet these targets. This friction is primarily driven by the implementation of Apple’s App Tracking Transparency framework, which has negatively impacted 64% of user acquisition campaigns. The resulting data scarcity has complicated decision-making for 73% of marketers and led to increased costs for 72% of respondents, forcing a heavy daily focus on manual campaign analysis to compensate for the loss of granular tracking.
In response to these privacy-centric shifts, the industry is undergoing a strategic pivot toward diversification and alternative platforms. Marketers are increasingly reallocating budgets toward Android and exploring less trackable channels, with over half of professionals prioritizing influencer marketing and organic social media. Despite the challenges posed by rising costs and low familiarity with upcoming privacy updates like SKAN 4 and the deprecation of Google Advertising ID, the outlook for the sector remains growth-oriented. Fifty-two percent of marketers intend to increase their advertising spend in 2023, focusing on expanding their network of partners to navigate the post-ATT environment.
This transition is supported by a global infrastructure of programmatic user acquisition and monetization tools designed to scale revenue across sectors such as gaming, finance, and e-commerce. By leveraging creator-led campaigns and advanced game data analytics, businesses across 74 countries are attempting to offset the limitations of the current privacy era. The overarching trend indicates that while privacy regulations have fundamentally disrupted traditional acquisition models, the industry is responding through increased investment and a broader, multi-channel approach to mobile growth.
- Apple’s App Tracking Transparency (ATT) framework has negatively impacted 64% of user acquisition campaigns, leading to increased costs for 72% of marketers and complicating decision-making for 73%.
- Nearly 60% of marketing professionals report facing more aggressive KPIs than in previous years, yet approximately half are currently struggling to meet these targets.
- To combat data scarcity, 52% of marketers plan to increase their 2023 advertising budgets while diversifying into influencer marketing and organic social media.
- Marketers are shifting strategies away from traditional tracking by reallocating budgets toward Android and prioritizing alternative, less trackable channels.
- Industry professionals are currently navigating significant knowledge gaps regarding upcoming privacy changes, specifically the deprecation of Google Advertising ID and the implementation of SKAN 4.